(All MSCI index returns are shown net and in U.S. dollars unless otherwise noted.)
Markets Review
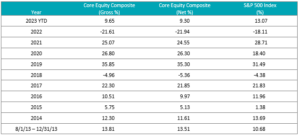
Sources: CAPS CompositeHubTM, Bloomberg
Past performance is not indicative of future results. Aristotle International Equity Composite returns are presented gross and net of investment advisory fees and include the reinvestment of all income. Gross returns will be reduced by fees and other expenses that may be incurred in the management of the account. Net returns are presented net of actual investment advisory fees and after the deduction of all trading expenses. Aristotle Capital Composite returns are preliminary pending final account reconciliation. Please see important disclosures at the end of this document.
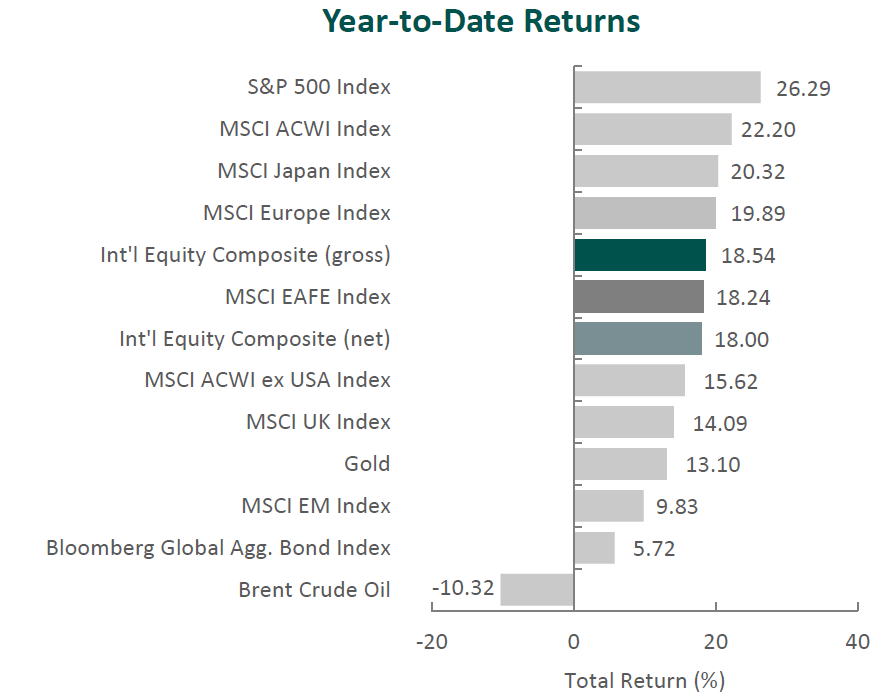
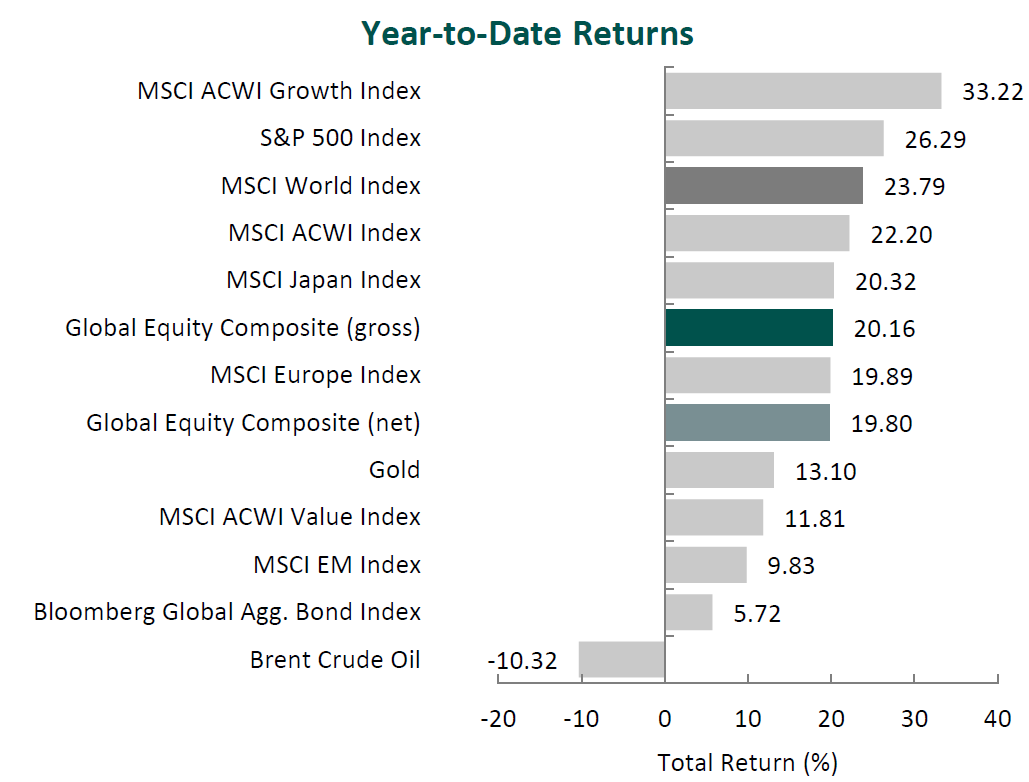
Global equity markets rallied in the fourth quarter. Overall, the MSCI ACWI Index rose 11.03% during the period. Concurrently, the Bloomberg Global Aggregate Bond Index increased 8.10%. In terms of style, value stocks underperformed their growth counterparts during the quarter, with the MSCI ACWI Value Index trailing the MSCI ACWI Growth Index by 3.57%.
Both regionally and on a sector basis, gains were broad-based. Latin America and North America posted the best results, while Emerging Markets and Japan, albeit strong performers, gained the least. On a sector basis, ten out of the eleven sectors within the MSCI ACWI Index finished in the green, with Information Technology, Real Estate and Industrials increasing the most. Meanwhile, Energy was the only sector to decline, while Consumer Staples and Health Care gained the least.
Despite posting overall gains, global equity markets were shocked with another war and humanitarian crisis as tensions between Israel and Hamas reached a watershed during the quarter. In response to the deadly terrorist attack on civilians by Hamas, Israel commenced a military campaign in the Gaza Strip. While concerns that the war might spread throughout the entire Middle East abated during the period, the complex religious, ethnic and political makeup of the region could complicate diplomatic relationships in the future.
Meanwhile, in Europe, Ukraine’s 2023 counteroffensive against Russia was confirmed as a failure, and Western support for the beleaguered nation seems to be waning. President Putin has stated that Russia’s war goals have not changed, but reports indicate that he may be open to a cease-fire. In Asia, President Xi Jinping claimed that reunification is inevitable, adding to the mounting Chinese pressure on Taiwan ahead of Taiwan’s 2024 election.
On the economic front, global labor markets remained tight, and most countries and regions continued to make inroads in the battle against inflation, as the U.S., U.K., eurozone and Japan all reported slowing annual inflation in November; 3.1%, 3.9%, 2.4% and 2.8%, respectively. In response to the improving conditions, both major western and eastern nations largely kept interest rate policy steady during the quarter. However, future policy direction looks to be divided heading into the new year, as the U.S. signaled potential rate cuts, the U.K. and eurozone rebuffed premature discussions of cuts, and Japan looks to end its policy of negative rates in 2024. Nevertheless, the International Monetary Fund expects global inflation to continue to steadily decline due to overall tighter monetary policy and lower commodity prices, which have been further suppressed by the bursting of China’s property bubble.
Annual Markets Review
After a tumultuous year in 2022, global equity markets rebounded in 2023, as the MSCI ACWI posted a full-year return of 22.20%. Additionally, after underperforming value in 2022 by the largest amount since 2000, growth recovered, as the MSCI ACWI Growth Index outperformed the MSCI ACWI Value Index by 21.41% in 2023. Meanwhile, fixed income markets also rose, as the Bloomberg Global Aggregate Bond Index increased 5.72%.
Though markets trended in a positive direction, 2023 still had its share of twists and turns in the form of a banking crisis and geopolitical conflicts in Europe, the Middle East and Asia. Furthermore, inflation, corresponding central bank policies, and economic recovery in areas like Europe and Asia generated significant headlines and proved to be key macroeconomic factors.
Given the multitude of headlines in a year and their fickle nature, short-term returns are often volatile and inconsistent. Therefore, we instead choose to focus on business fundamentals over the long term. By finding great businesses that are undervalued with actionable catalysts within our investment time horizon, we believe we can provide consistent and lasting value to our clients.
Performance and Attribution Summary
For the fourth quarter of 2023, Aristotle Capital’s Global Equity Composite posted a total return of 11.99% gross of fees
(11.90% net of fees), outperforming the MSCI World Index, which returned 11.42%, and the MSCI ACWI Index, which returned 11.03%. Please refer to the table below for detailed performance.
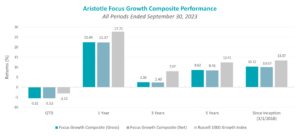
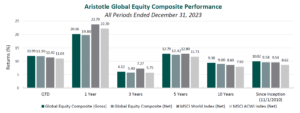
| Performance (%) | 4Q23 | 1 Year | 3 Years | 5 Years | 10 Years | Since Inception* |
|---|---|---|---|---|---|---|
| Global Equity Composite (gross) | 11.99 | 20.16 | 6.12 | 12.79 | 9.38 | 10.02 |
| Global Equity Composite (net) | 11.90 | 19.80 | 5.80 | 12.42 | 9.00 | 9.58 |
| MSCI World Index (net) | 11.42 | 23.79 | 7.27 | 12.80 | 8.60 | 9.54 |
| MSCI ACWI Index (net) | 11.03 | 22.20 | 5.75 | 11.71 | 7.92 | 8.62 |
Source: FactSet
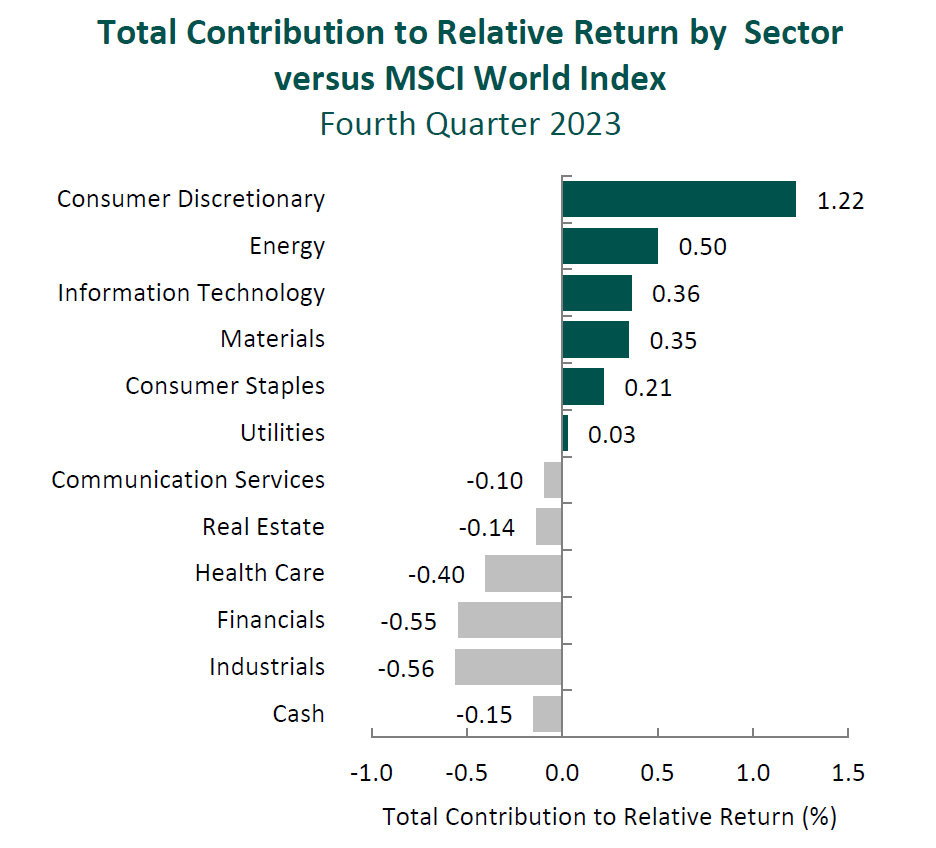
Past performance is not indicative of future results. Attribution results are based on sector returns which are gross of investment advisory fees. Attribution is based on performance that is gross of investment advisory fees and includes the reinvestment of income.
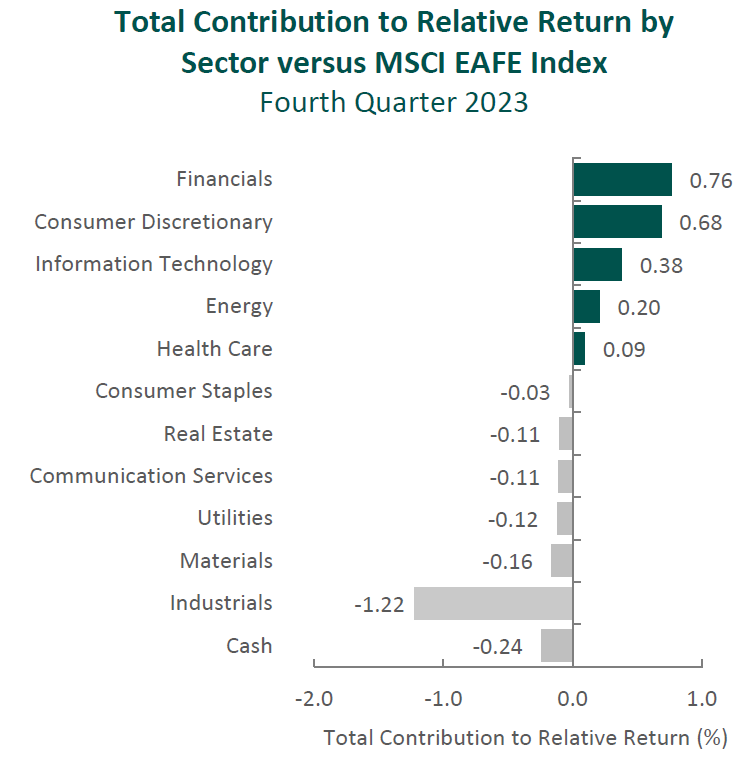
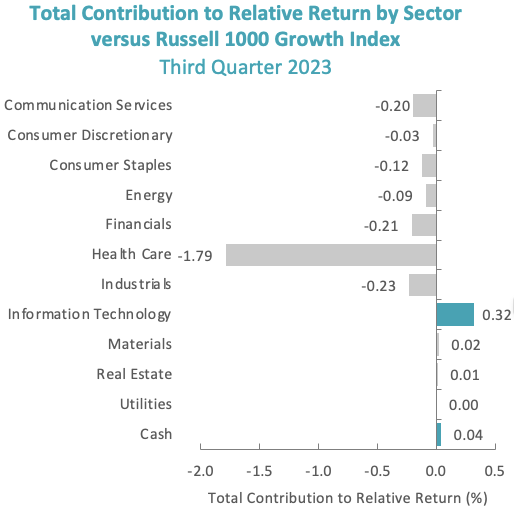
From a sector perspective, the portfolio’s outperformance relative to the MSCI World Index can be attributed to security selection, while allocation effects had a negative impact. Security selection in Consumer Discretionary, Energy and Information Technology contributed the most to the portfolio’s relative performance. Conversely, security selection in Industrials, Financials and Health Care detracted from relative return.
Regionally, security selection was responsible for the portfolio’s outperformance relative to the MSCI World Index, while allocation effects had a negative impact. Security selection in North America and our exposure in Emerging Markets contributed the most to relative performance, while security selection in Europe and an overweight in Japan detracted.
Contributors and Detractors for 4Q 2023
| Relative Contributors | Relative Detractors |
|---|---|
| Lennar | Rentokil Initial |
| Nemetschek | Jazz Pharmaceuticals |
| Martin Marietta Materials | FMC Corporation |
| Qualcomm | Alcon |
| Brookfield | TotalEnergies |
Lennar, one of the nation’s largest homebuilders, was the top contributor for the period. Increasing mortgage rates reached a peak during the fourth quarter, but Lennar’s dynamic pricing model, combined with its digital marketing platform and buyer incentives, continued to drive volume and generate cash flow, all while reducing construction cycle times, returning capital to shareholders and further lowering the company’s debt. In 2023, Lennar delivered 73,000 homes (a 10% year-over-year volume increase).The company’s land light strategy also continues to move forward, with 76% of land now controlled through options, as compared to 69% a year ago (and less than 30% in 2015).Over our decade-plus investment in Lennar, we have admired the management team’s ability to respond to changing housing dynamics. We believe Lennar’s current land and pricing strategy should continue to support enhanced FREE cash flow generation. In addition, Lennar’s strong balance sheet, prudent inventory management and further ability to implement cost and production efficiencies position it well to meet demand amid the decade-long undersupply of homes in the U.S.
Nemetschek, a project management software solutions provider for the architecture, engineering and construction industry, was the one of the largest contributors for the quarter. Over the past couple of years, the company has made significant efforts to transition the business from a license to a subscription SaaS (software as a service) model, which we expected would drive higher and more stable revenues per user while creating more long-term value for customers. In line with this strategy, the company reported that ~75% of its revenues are now recurring, up from ~65% last year. Furthermore, with the backdrop of stable demand and strong operational execution, management reported EBITDA margins at the high end of guidance and raised its revenue projections for the year. We believe the optimization of Nemetschek’s business model, continued improvement in operational efficiency through efforts like internalization, and product innovation such as the open and cloud-based dTwin platform, will lead to long-term improvements in profitability and position the company for market share gains as building complexity continues to increase.
Rentokil Initial, the U.K.-based pest control and hygiene services company, was the largest detractor for the quarter. The company’s pest control segment (which accounts for 94% of total operating profit) reported a slowdown in organic revenue growth from 5.6% in the first half of 2023 to 2.3% in the third quarter. As these results are short term in nature, we will continue to closely monitor the company’s progress on both integration of Terminix and further improvement of its marketing strategy. This includes the recent appointment of Brad Paulsen as CEO of the North America Region and his impact on the company’s most important geography (accounting for ~75% of pest control sales). Over the long term, we remain confident that the Terminix acquisition will create scale efficiencies and in-market densification (with a targeted $200 million in cost synergies by 2025), as well as accelerate the consolidation of the U.S. pest control market. Short-term impacts on the company’s stock price, in our opinion, are overdone given these fundamental improvements coupled with the resilient nature of the pest control business.
FMC Corporation, the global provider of crop protection solutions, was the largest detractor for the year and a top detractor for the fourth quarter. Following robust orders during the 2020-2022 period, customer destocking persisted throughout 2023, particularly in Latin America. Despite strong end-market demand, market forces, including inflationary prices and sharply higher interest rates, have combined to motivate customers to draw down existing inventories. As a result, FMC lowered its 2023 guidance and introduced a global restructuring initiative. In November, we attended FMC’s Investor Day where management detailed its strategic plans and introduced mid-term financial goals. We came away with increased confidence that FMC is at or near a cyclical bottom and that management is taking appropriate actions in navigating the worst downcycle the crop protection market has seen in more than 40 years.
Recent Portfolio Activity
| Buys | Sells |
|---|---|
| MonotaRO | Kubota |
During the quarter, we sold our position in Kubota and invested in a new position, MonotaRO.
We first invested in Kubota, the maker of tractors and construction machinery, during the second quarter of 2015. During our holding period, the company has increased its agricultural sales by entering wet field markets in Southeast Asia, gained share of small tractors/construction machinery in North America, and restructured its water and environment segment. We decided to sell in favor of what we think is a more compelling investment opportunity. However, we will continue to monitor this high-quality company and follow with interest its attempts to increase its presence in India, a very attractive tractor market where Kubota has yet to prove whether it will be able to take meaningful share.
MonotaRO Co., Ltd.
Established in Japan in 2000, MonotaRO operates a business-to-business (B2B) e-commerce platform, selling about 20 million items (over 650,000 SKUs) to more than 8 million customers (mostly in Japan). The company is an MRO (maintenance, repair and operations) distributor focused on small- and mid-sized companies (~two-thirds of customers), with manufacturing, construction and auto repair industries accounting for the majority of sales. For those reading this online, MonotaRO’s business may seem simple or even obvious; however, the company’s unique profile (>95% of sales are online) and innovative solutions, we believe, provide its customers a distinct value proposition and its shareholders a compelling opportunity to own a leader in a fragmented industry.
MonotaRO serves as a one-stop solution, allowing customers to shop for millions of products via a centralized location. Its transparent pricing saves clients time and reduces costs by removing the need to rely on independent catalogs, individual quotes or separate orders. The company sources its merchandise from thousands of suppliers (i.e., manufacturers and wholesalers) in ten countries and carries over 500,000 products in stock, ready for same-day shipment from its own distribution centers. In addition, its ONE SOURCE Lite allows large clients to link their purchasing management systems to MonotaRO’s, providing company-wide visibility of items and purchases and an integrated experience.
MonotaRO operates as a consolidated subsidiary of U.S.-based Grainger (an industrials supplier) and provides consulting services to the parent’s e-commerce businesses in the U.S., Germany and the U.K.
High-Quality Business
Some of the quality characteristics we have identified for MonotaRO include:
- High barriers to entry given that scale is essential to most products in the MRO market, which requires high variety yet small lot ordering, making it imperative to offer a high number of SKUs while investing in technology to provide easier curation and shorter delivery times;
- The company’s vast product breath, combined with its advanced data analytics, allows it to analyze procurement behaviors and better predict which items to keep in inventory. The client is able to spend less time ordering and can count on reliable delivery;
- Attractive business fundamentals, as ordering can be cumbersome, and clients value reliability, convenience and variety more so than price. The MRO market is also highly fragmented and inefficient. As MonotaRO expands, the more difficult it becomes for others to compete; and
- Expertise in database marketing leads to high repeat order rates, while its integrated purchasing management system into large corporations increases their switching costs.
Attractive Valuation
Using our estimates of normalized sales attained through continued market share gains, we believe MonotaRO’s current stock price is offered at a discount to our estimate of the company’s intrinsic value.
Compelling Catalysts
Catalysts we have identified for MonotaRo, which we believe will cause its stock price to appreciate over our three- to five-year investment horizon, include:
- Ability to continue gaining share from inefficient small players (e.g., door-to-door dealers relying on people, catalogs and even fax machines);
- Increasing existing customers’ sales through technological improvements (e.g., website personalization and recommendation displays) aimed at reducing the time it takes to (1) find, (2) purchase and (3) receive products;
- Further penetration into enterprise customers should provide a larger source for sales growth, as this segment represents a higher customer lifetime value as well as stickiness; and
- Growth in sales of MonotaRO’s private label offering of approximately 300,000 products that are higher margin yet provide savings to clients.
Conclusion
With volatile economic data points, changing central bank policies, shocks to the banking system and various geopolitical conflicts, 2023 was full of headline-worthy news. However, as the market’s attention quickly shifted from one macro event to the next, we remained true to our bottom up, fundamental investment philosophy.
As such, instead of chasing the next headline or “placing bets” on short-term predictions, our focus remains on business fundamentals and what is analyzable in the long run. For over the past quarter century, we have dedicated ourselves to a “bottom-up” process of identifying high-quality businesses trading at meaningful discounts to intrinsic value, that possess catalysts which are underway and within management’s control. By doing so, we believe we can find long-term success regardless of the macroeconomic environment or news of the day.
The opinions expressed herein are those of Aristotle Capital Management, LLC (Aristotle Capital) and are subject to change without notice. Past performance is not a guarantee or indicator of future results. This material is not financial advice or an offer to buy or sell any product. You should not assume that any of the securities transactions, sectors or holdings discussed in this report were or will be profitable, or that recommendations Aristotle Capital makes in the future will be profitable or equal the performance of the securities listed in this report. The portfolio characteristics shown relate to the Aristotle Global Equity strategy. Not every client’s account will have these characteristics. Aristotle Capital reserves the right to modify its current investment strategies and techniques based on changing market dynamics or client needs. There is no assurance that any securities discussed herein will remain in an account’s portfolio at the time you receive this report or that securities sold have not been repurchased. The securities discussed may not represent an account’s entire portfolio and, in the aggregate, may represent only a small percentage of an account’s portfolio holdings. The performance attribution presented is of a representative account from Aristotle Capital’s Global Equity Composite. The representative account is a discretionary client account which was chosen to most closely reflect the investment style of the strategy. The criteria used for representative account selection is based on the account’s period of time under management and its similarity of holdings in relation to the strategy. Recommendations made in the last 12 months are available upon request.
Returns are presented gross and net of investment advisory fees and include the reinvestment of all income. Gross returns will be reduced by fees and other expenses that may be incurred in the management of the account. Net returns are presented net of actual investment advisory fees and after the deduction of all trading expenses.
All investments carry a certain degree of risk, including the possible loss of principal. Investments are also subject to political, market, currency and regulatory risks or economic developments. International investments involve special risks that may in particular cause a loss in principal, including currency fluctuation, lower liquidity, different accounting methods and economic and political systems, and higher transaction costs. These risks typically are greater in emerging markets. Securities of small‐ and medium‐sized companies tend to have a shorter history of operations, be more volatile and less liquid. Value stocks can perform differently from the market as a whole and other types of stocks.
The material is provided for informational and/or educational purposes only and is not intended to be and should not be construed as investment, legal or tax advice and/or a legal opinion. Investors should consult their financial and tax adviser before making investments. The opinions referenced are as of the date of publication, may be modified due to changes in the market or economic conditions, and may not necessarily come to pass. Information and data presented has been developed internally and/or obtained from sources believed to be reliable. Aristotle Capital does not guarantee the accuracy, adequacy or completeness of such information.
Aristotle Capital Management, LLC is an independent investment adviser registered under the Investment Advisers Act of 1940, as amended. Registration does not imply a certain level of skill or training. More information about Aristotle Capital, including our investment strategies, fees and objectives, can be found in our Form ADV Part 2, which is available upon request. ACM-2401-89
Sources: CAPS CompositeHubTM, MSCI
Composite returns for all periods ended December 31, 2023 are preliminary pending final account reconciliation.
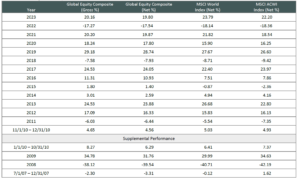
The Aristotle Global Equity Composite has an inception date of November 1, 2010; however, the strategy initially began at Howard Gleicher’s predecessor firm in July 2007. A supplemental performance track record from January 1, 2008 through October 31, 2010 is provided on this page and complements the Global Equity Composite presentation that is located at the end of this presentation. The performance results were achieved while Mr. Gleicher managed the strategy at a prior firm. The returns are those of a publicly available mutual fund from the fund’s inception through Mr. Gleicher’s departure from the firm. During that time, Mr. Gleicher had primary responsibility for managing the fund.
Past performance is not indicative of future results. The information provided should not be considered financial advice or a recommendation to purchase or sell any particular security or product. Performance results for periods greater than one year have been annualized.
Returns are presented gross and net of investment advisory fees and include the reinvestment of all income. Gross returns will be reduced by fees and other expenses that may be incurred in the management of the account. Net returns are presented net of actual investment advisory fees and after the deduction of all trading expenses.
The MSCI World Index is a free float-adjusted market capitalization weighted index that is designed to measure the equity market performance of developed markets. The MSCI World Index consists of the following 23 developed market country indexes: Australia, Austria, Belgium, Canada, Denmark, Finland, France, Germany, Hong Kong, Ireland, Israel, Italy, Japan, Netherlands, New Zealand, Norway, Portugal, Singapore, Spain, Sweden, Switzerland, the United Kingdom and the United States. The MSCI Emerging Markets Index is a free float-adjusted market capitalization-weighted index that is designed to measure equity market performance of emerging markets. The MSCI Emerging Markets Index consists of the following 24 emerging market country indexes: Brazil, Chile, China, Colombia, Czech Republic, Egypt, Greece, Hungary, India, Indonesia, Korea, Kuwait, Malaysia, Mexico, Peru, Philippines, Poland, Qatar, Saudi Arabia, South Africa, Taiwan, Thailand, Turkey and United Arab Emirates. The MSCI ACWI captures large and mid-cap representation across 23 developed markets and 24 emerging markets countries. With approximately 3,000 constituents, the Index covers approximately 85% of the global investable equity opportunity set. The MSCI ACWI Growth Index captures large and mid-cap securities exhibiting overall growth style characteristics across 23 developed markets countries and 24 emerging markets countries. The MSCI ACWI Value Index captures large and mid-cap securities exhibiting overall value style characteristics across 23 developed markets countries and 24 emerging markets countries. The MSCI Europe Index captures large and mid-cap representation across 15 developed markets countries in Europe. With more than 400 constituents, the Index covers approximately 85% of the free float-adjusted market capitalization across the European developed markets equity universe. The MSCI Japan Index is designed to measure the performance of the large and mid-cap segments of the Japanese market. With approximately 250 constituents, the Index covers approximately 85% of the free float-adjusted market capitalization in Japan. The S&P 500® Index is the Standard & Poor’s Composite Index of 500 stocks and is a widely recognized, unmanaged index of common stock prices. The Bloomberg Global Aggregate Bond Index is a flagship measure of global investment grade debt from 28 local currency markets. This multi-currency benchmark includes Treasury, government-related, corporate and securitized fixed rate bonds from both developed and emerging markets issuers. The Brent Crude Oil Index is a major trading classification of sweet light crude oil that serves as a major benchmark price for purchases of oil worldwide. The volatility (beta) of the Composite may be greater or less than the benchmarks. It is not possible to invest directly in these indexes.