Markets Review
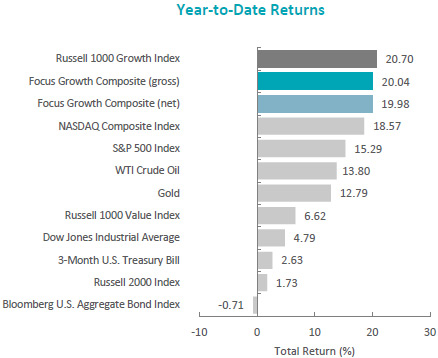
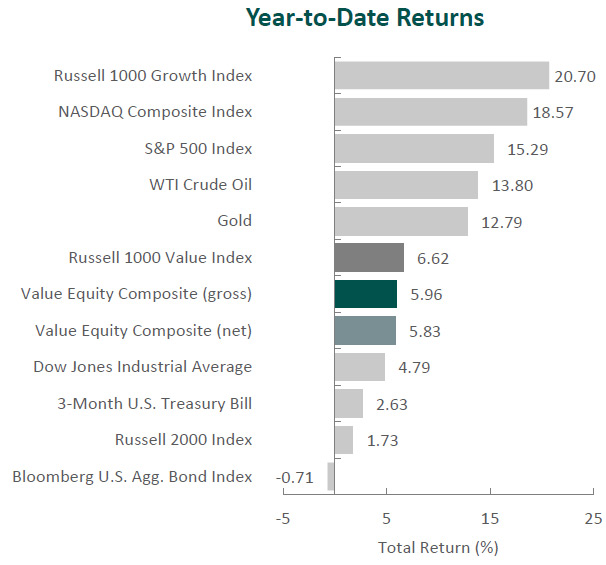
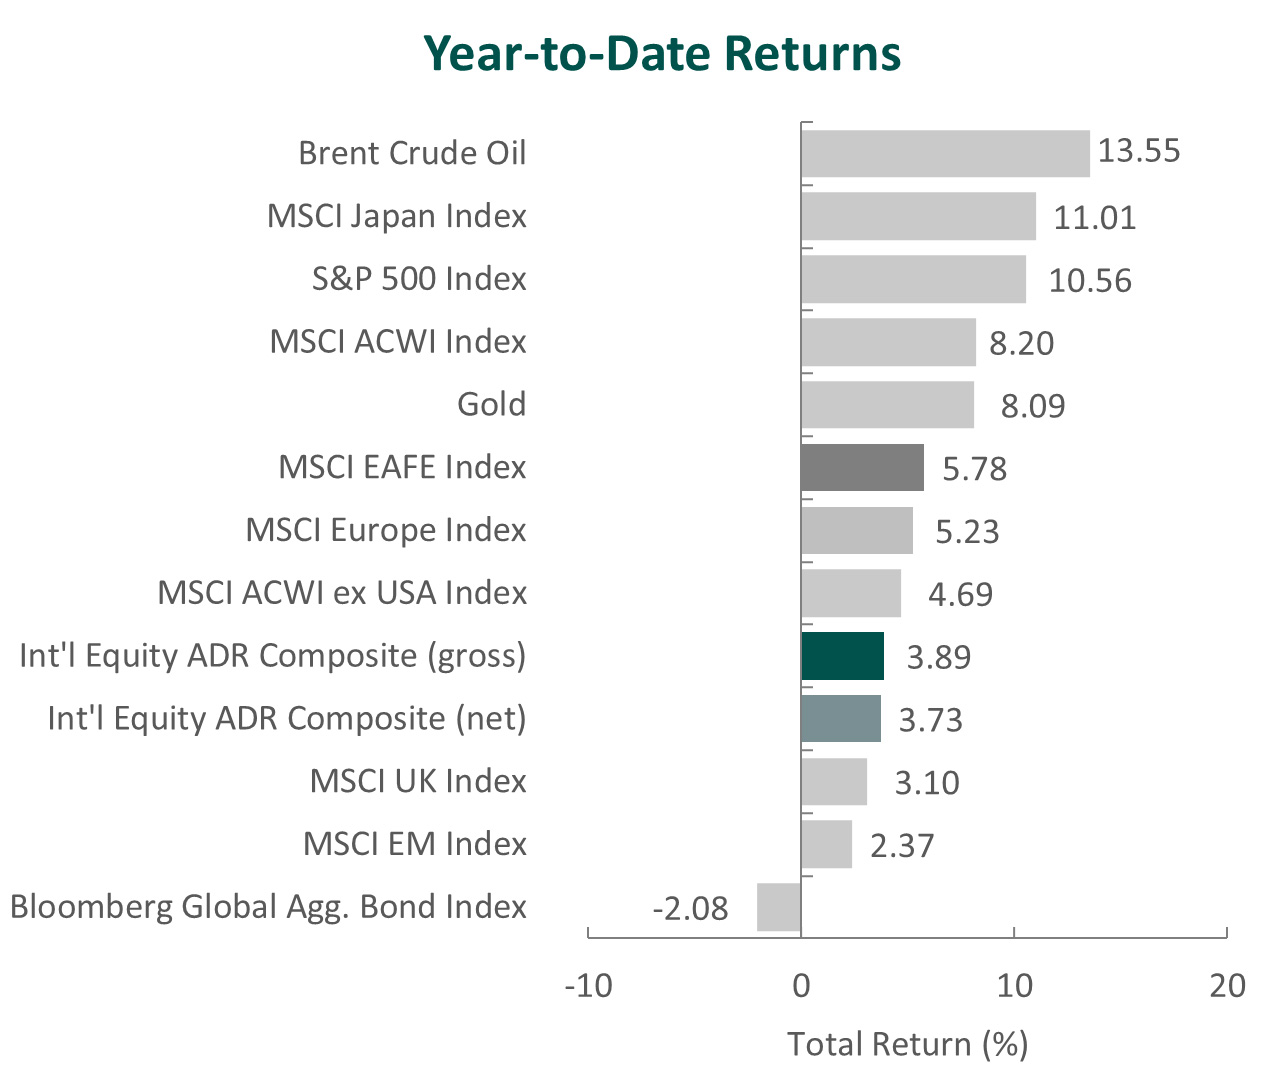
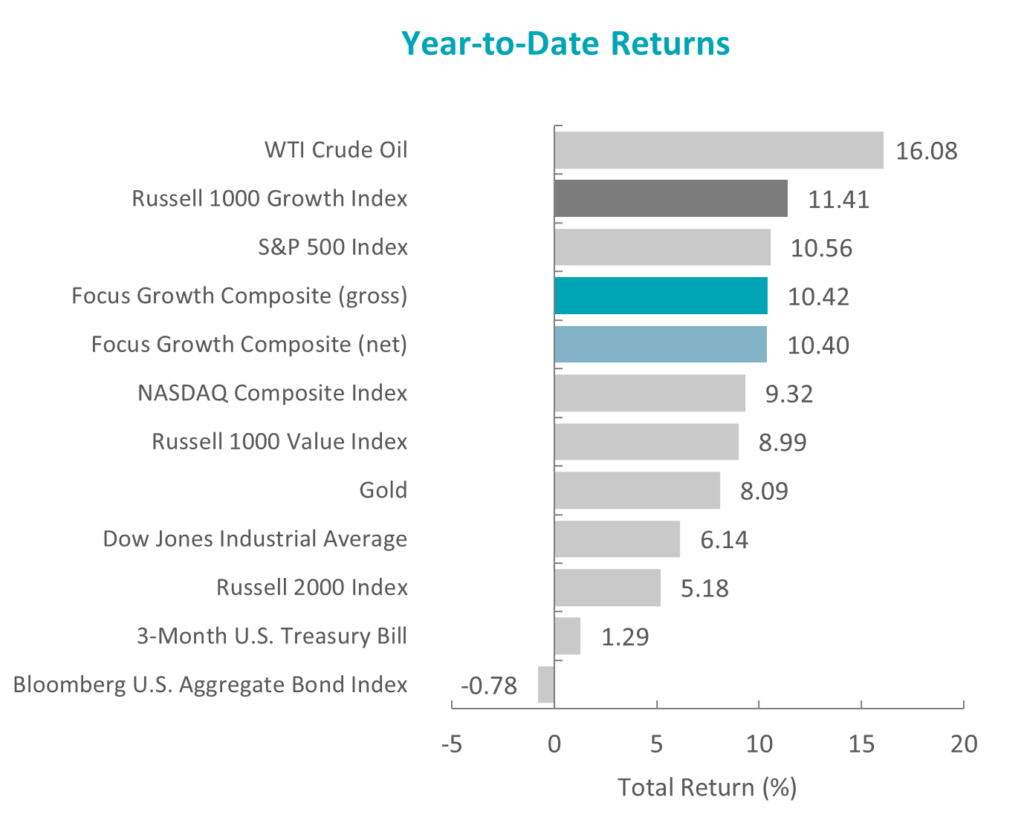
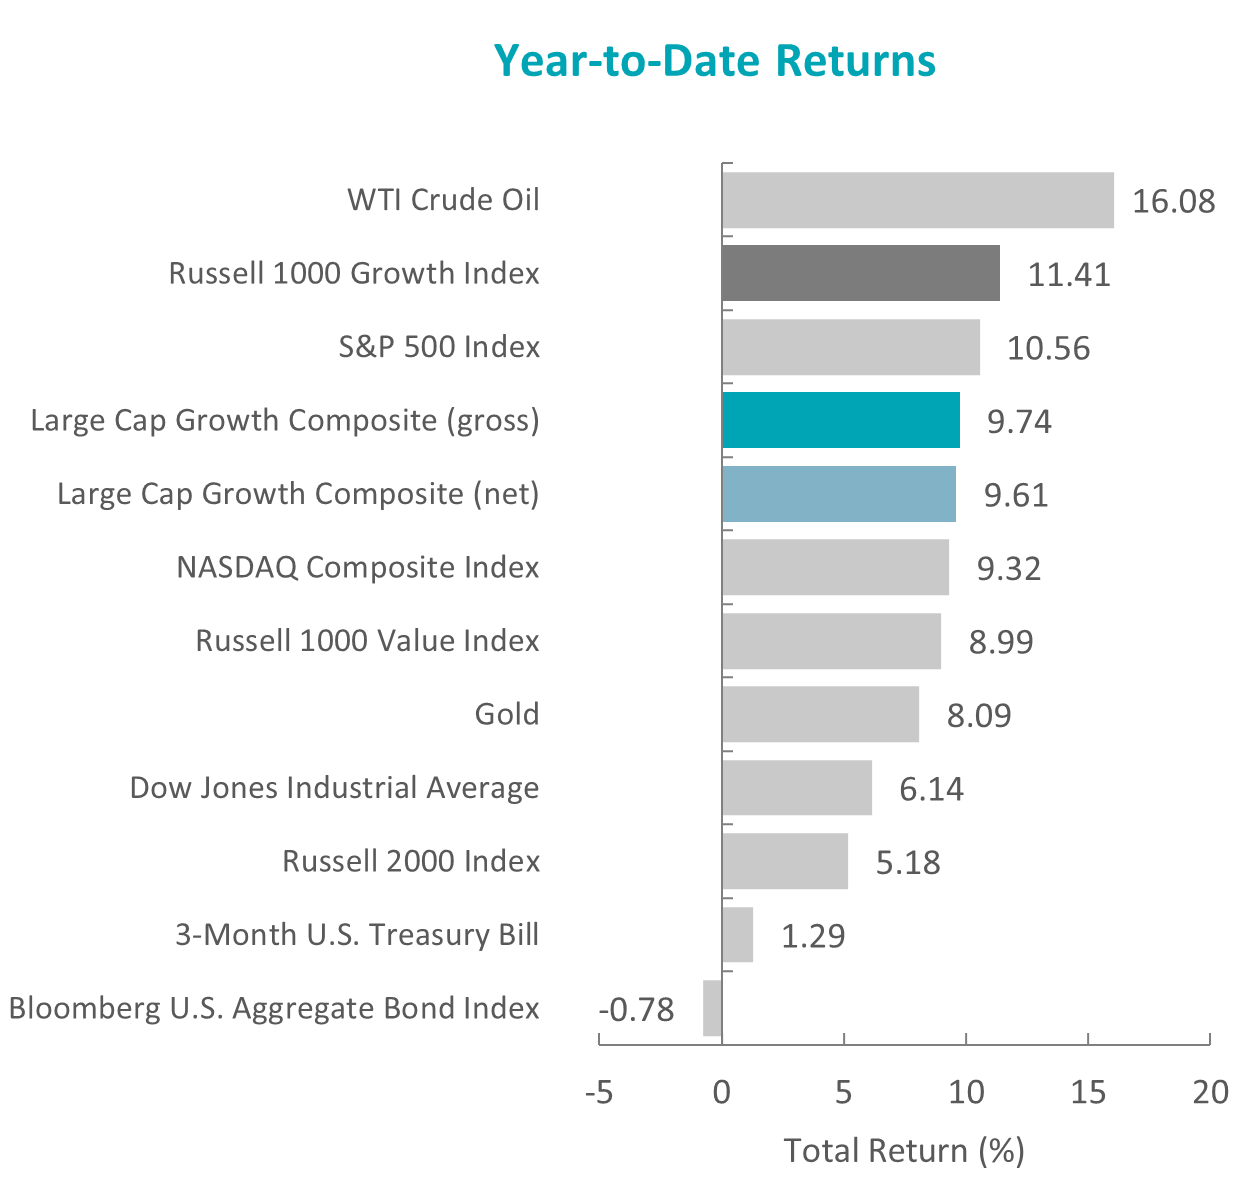
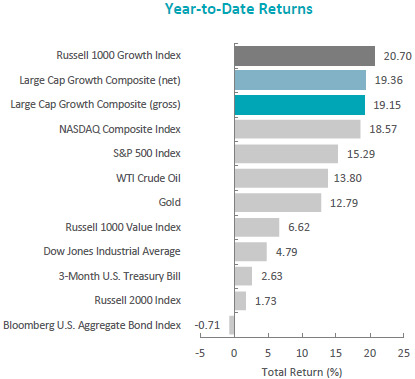
The U.S. equity market achieved record highs, as the S&P 500 Index rose 4.28% during the period. Gains were once again driven by the “Magnificent 7.” This narrow group of stocks was responsible for the majority of the S&P 500’s return during the quarter. Concurrently, the Bloomberg U.S. Aggregate Bond Index returned 0.07% for the quarter. In terms of style, the Russell 1000 Value Index underperformed its growth counterpart by 10.50%.
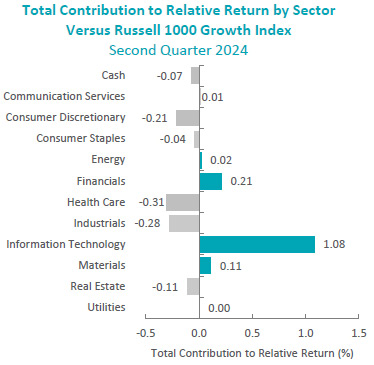
On a sector basis gains were made from seven of the eleven sectors within the Russell 1000 Growth index led by Information Technology and Communication Services. The worst performing sectors were Materials and Industrials.
Sources: CAPS CompositeHubTM, Bloomberg
Past performance is not indicative of future results. Aristotle Atlantic Large Cap Growth Composite returns are presented gross and net of investment advisory fees and include the reinvestment of all income. Gross returns will be reduced by fees and other expenses that may be incurred in the management of the account. Net returns are presented net of actual investment advisory fees and after the deduction of all trading expenses. Aristotle Atlantic Composite returns are preliminary pending final account reconciliation. Please see important disclosures at the end of this document.
Data released during the period showed that U.S. economic growth slowed to an annual rate of 1.4% in the first quarter from 3.4% in the last quarter of 2023, as consumer spending, exports and government spending decelerated. Meanwhile, CPI inflation rose at an annual rate of 3.4% in April and 3.3% in May. This combination of sluggish economic growth and persistent inflation raised concerns about potential stagflation. However, the U.S. labor market remained strong, with unemployment at 4.0%, and consumer spending continued to grow.
Due to the unchanged macroeconomic landscape, with elevated inflation and a healthy labor market, the Federal Reserve (Fed) maintained the benchmark federal funds rate’s targeted range of 5.25% to 5.50% and continued reducing its holdings of Treasury securities. Fed Chair Powell emphasized patience in monetary policy changes and indicated it may take longer than expected to lower rates, as the committee is seeking greater confidence that inflation is sustainably moving toward its 2% target.
Corporate earnings were strong, with S&P 500 companies reporting earnings growth of 6.0% and more companies exceeding EPS estimates compared to the previous quarter. Despite slowing economic growth, fewer companies discussed the potential for a recession on earnings calls, and fewer companies mentioned inflation.
In geopolitics, tensions remained high as President Biden hiked tariffs on $18 billion of imports from China in a bid to protect U.S. workers and businesses. In the Middle East, the U.S. continued efforts to stabilize maritime traffic in the Red Sea while also facing criticism from Israeli Prime Minister Netanyahu, who claimed the U.S. was withholding weapons from Israel. The U.S. presidential campaign season also began in earnest, with the first debate between incumbent Joe Biden and Republican rival Donald Trump taking place in June.
Performance and Attribution Summary
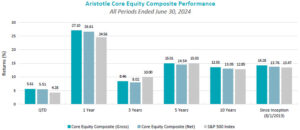
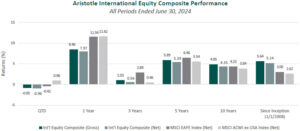
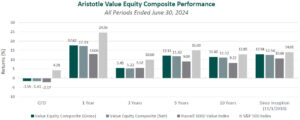
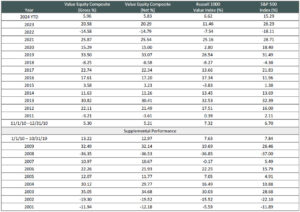
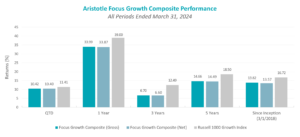
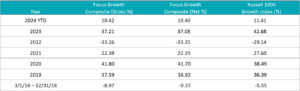
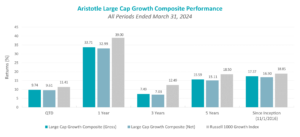
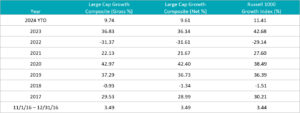
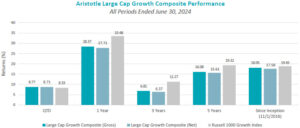
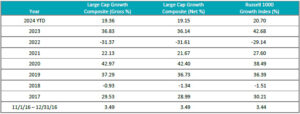
For the second quarter of 2024, Aristotle Atlantic’s Large Cap Growth Composite posted a total return of 8.77% gross of fees (8.71% net of fees), outperforming the 8.33% return of the Russell 1000 Growth Index.
| Performance (%) | 2Q24 | 1 Year | 3 Years | 5 Years | Since Inception* |
|---|---|---|---|---|---|
| Large Cap Growth Composite (gross) | 8.77 | 28.37 | 6.81 | 16.08 | 18.05 |
| Large Cap Growth Composite (net) | 8.71 | 27.71 | 6.37 | 15.61 | 17.58 |
| Russell 1000 Growth Index | 8.33 | 33.48 | 11.27 | 19.32 | 19.43 |
*The Large Cap Growth Composite has an inception date of November 1, 2016. Past performance is not indicative of future results. Aristotle Atlantic Large Cap Growth Equity Composite returns are presented gross and net of investment advisory fees and include the reinvestment of all income. Gross returns will be reduced by fees and other expenses that may be incurred in the management of the account. Net returns are presented net of actual investment advisory fees and after the deduction of all trading expenses. Aristotle Atlantic Composite returns are preliminary pending final account reconciliation. Please see important disclosures at the end of this document.
Sources: FactSet
Past performance is not indicative of future results. Attribution results are based on sector returns which are gross of investment advisory fees. Attribution is based on performance that is gross of investment advisory fees and includes the reinvestment of income. Please see important disclosures at the end of this document.
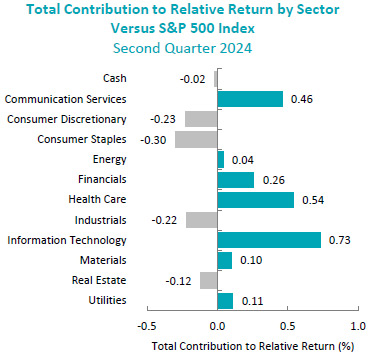
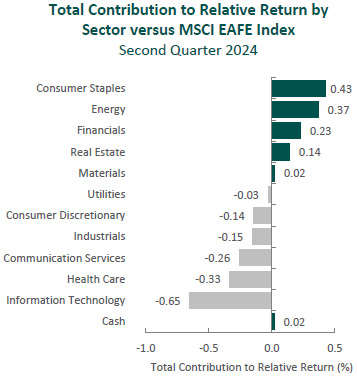
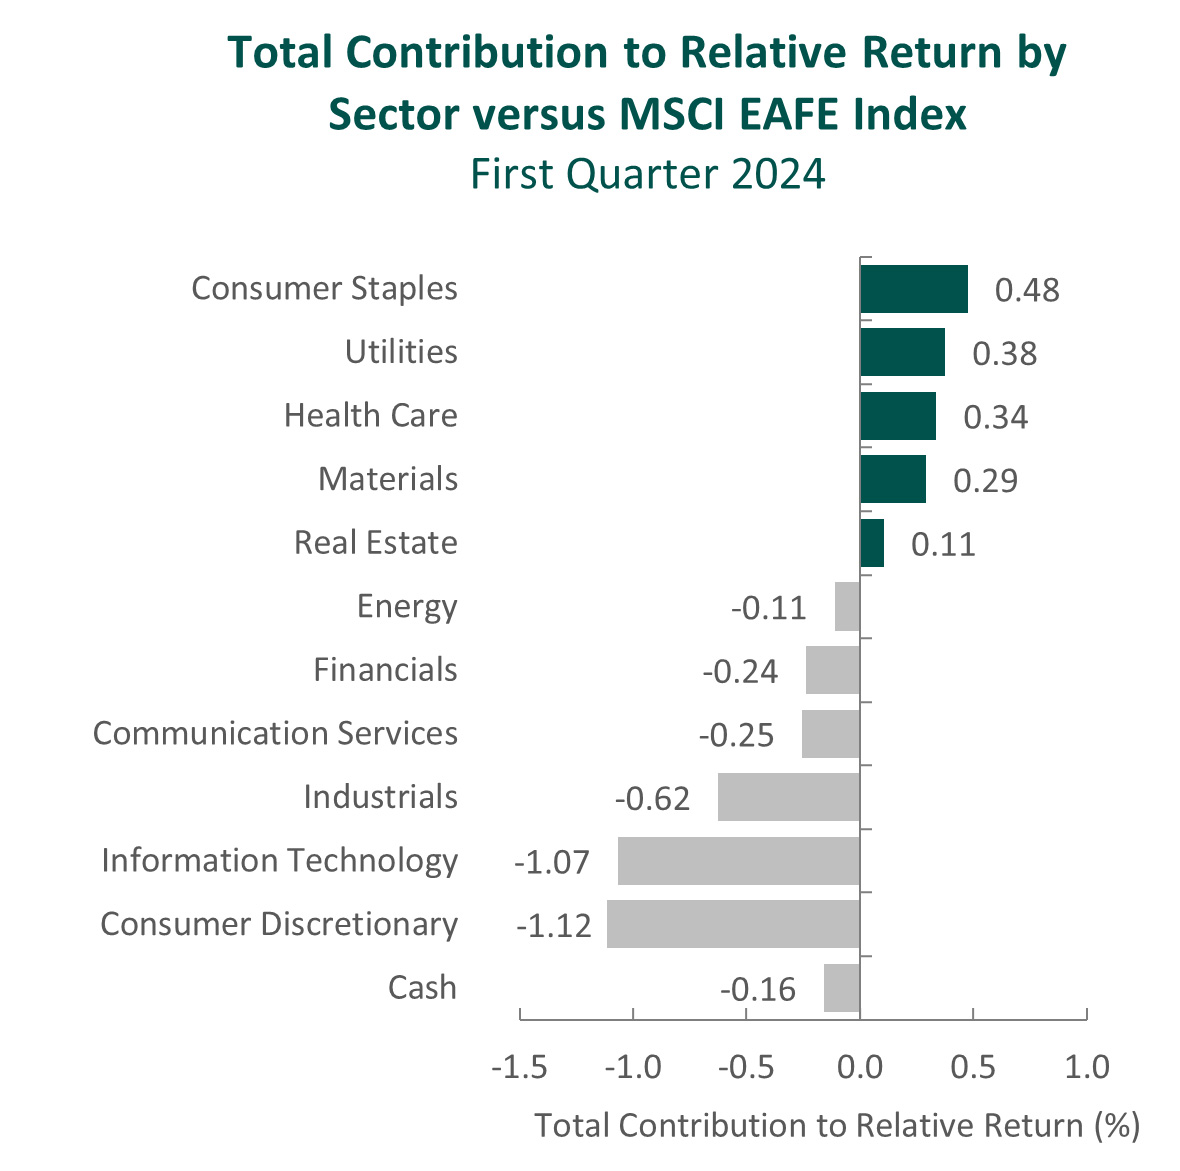
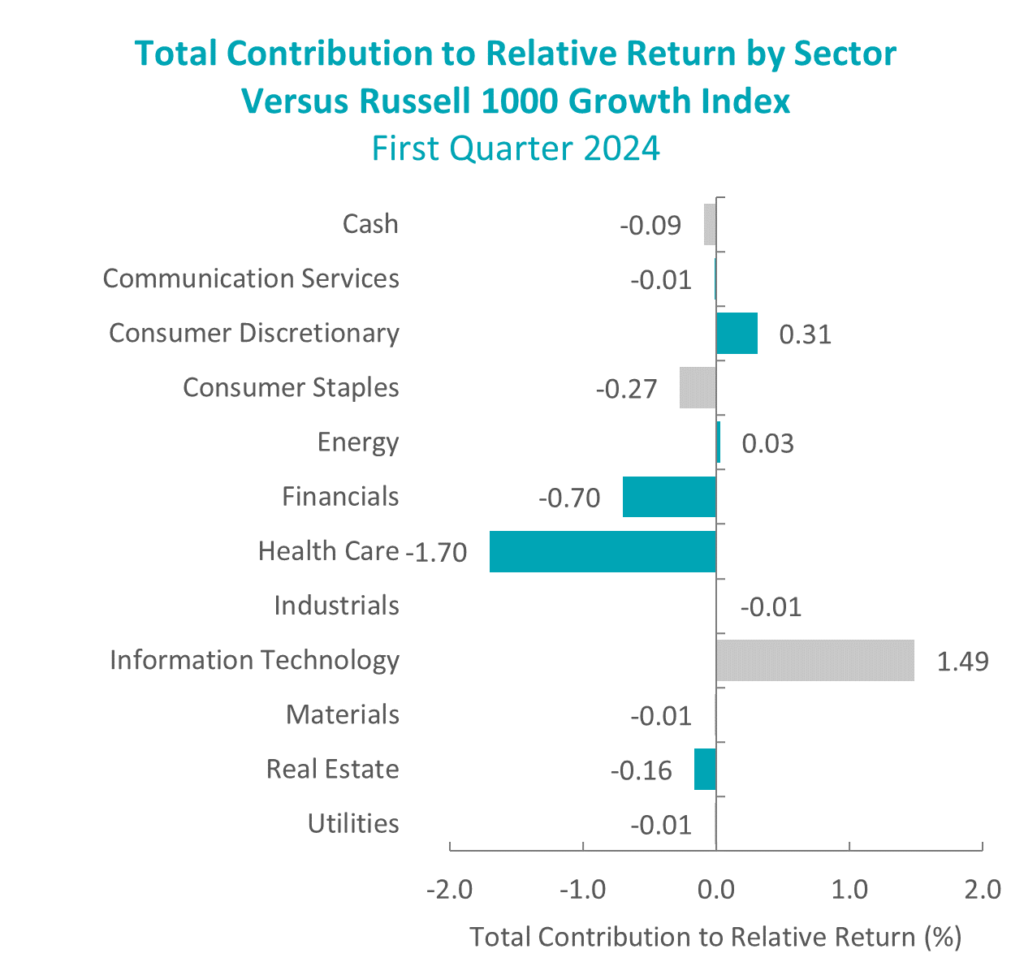
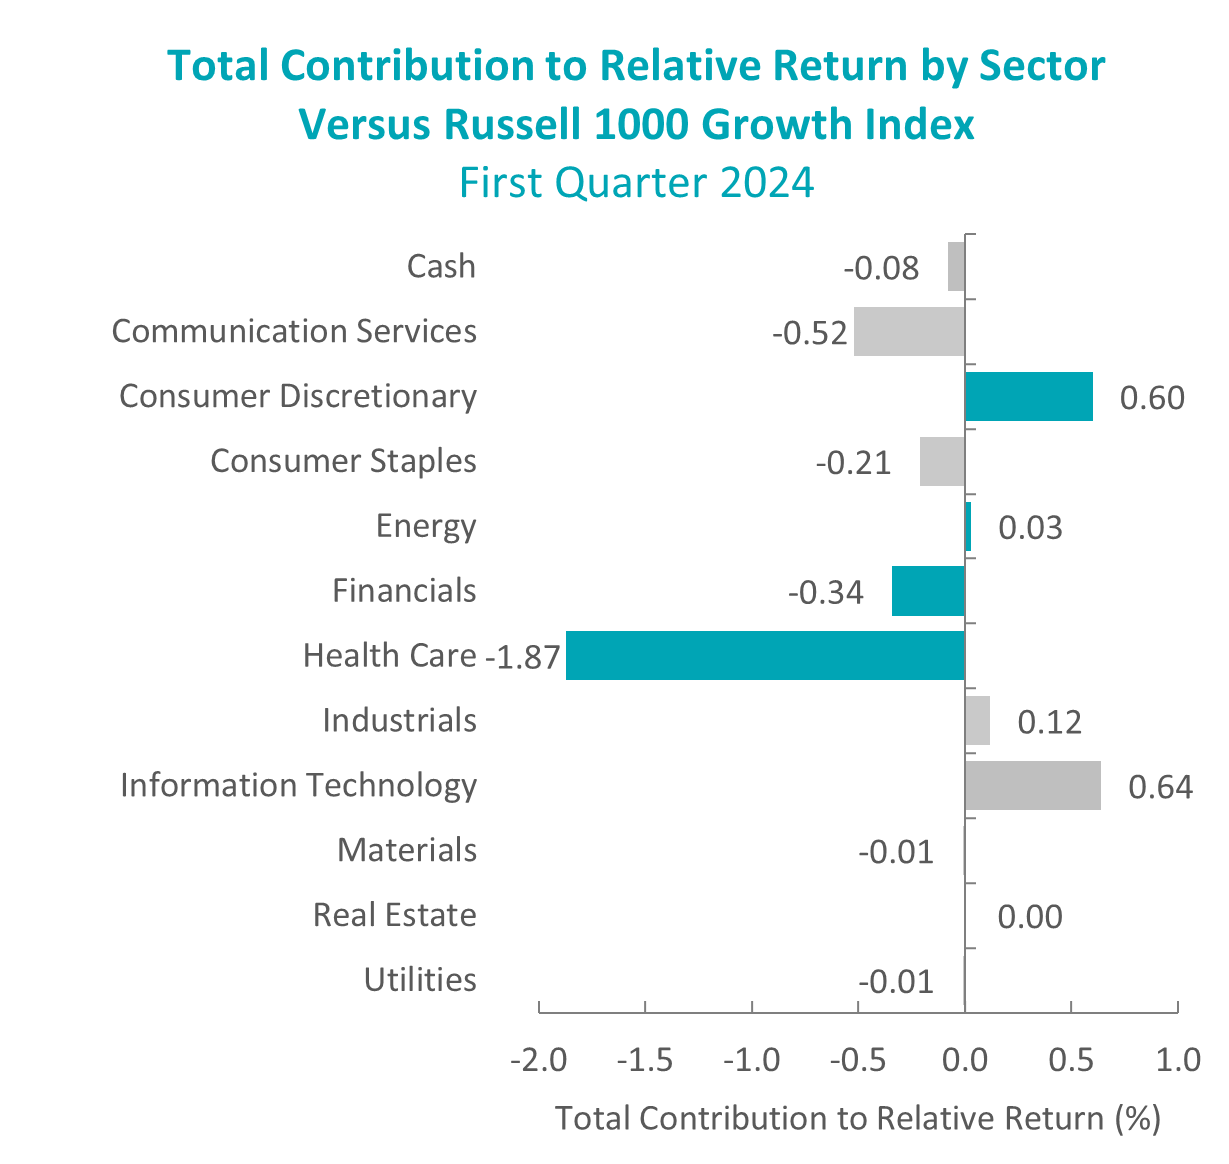
During the second quarter, the portfolio’s outperformance relative to the Russell 1000 Growth Index was primarily due to security selection. Security selection in Information Technology and Financials contributed the most to relative performance. Conversely, security selection in Heath Care and Industrials detracted from relative performance.
Contributors and Detractors for 2Q 2024
| Relative Contributors | Relative Detractors |
|---|---|
| Nvidia | Dexcom |
| KLA Corporation | Darling Ingredients |
| Guardant Health | Visa |
| Costco Wholesale | Expedia Group |
| Vertex Pharmaceuticals | Norfolk Southern |
Contributors
Nvidia
Nvidia contributed to portfolio performance in the second quarter as investors continued to view positively the new product roadmap for the rest of the year. The company sees accelerating demand for its GPU semiconductors from hyperscalers and enterprises. Nvidia’s GPU semiconductors continue to be the industry-leading building blocks of the accelerated computing data center architecture to drive AI compute and applications.
KLA Corporation
KLA contributed to portfolio performance in the second quarter as the company reported a strong March quarter. The results were driven by better-than-expected performance in patterning and services segments. The company also provided positive commentary on customer orders and increased visibility on growing sequential revenue through the rest of 2024. Commentary surrounding wafer fab equipment (WFE) spending for 2024 shows improving demand, with 2024 at least flat versus 2023 and growing customer spend driven by strong foundry/logic and high bandwidth memory (HBM) demand from accelerating AI-compute infrastructure spend.
Detractors
Dexcom
Dexcom detracted from performance in the quarter as the stock price gave back all the strong gains from the first quarter of this year. The company reported strong first quarter earnings, beating consensus estimates for the top and bottom lines, highlighted by 25% organic revenue growth. Additionally, it raised the low end of full-year revenue guidance based on the strong start to the year, with record new patient starts. Dexcom is launching an over-the-counter continuous glucose monitoring device set to target the over 25 million Type 2 diabetes patients who are not dependent on insulin. Furthermore, the medical device company recently expanded its salesforce to better address the ~200K primary care physicians in the United States. We see several catalysts going forward, and the stock is trading at a discount to historical valuation metrics.
Darling Ingredients
Darling Ingredients detracted from portfolio performance in the quarter, as shares continued to be weak following an in-line quarterly earnings report where the company provided initial 2024 EBITDA guidance of $1.3B to $1.4B, below consensus estimates. On a positive note, the company called out improving fat prices exiting the first quarter. Additionally, in its renewable diesel joint venture, the company has worked through higher-cost feedstocks contracted during start-up, so renewable diesel margins should improve on the lower input prices. We believe there are several catalysts for Darling going forward, including the blenders tax credit transitioning to a producer’s tax credit on January 1, 2025 and positive commentary around contracting sustainable aviation fuel (SAF) at a $1-$2 per gallon premium to renewable diesel. SAF production starts were pulled forward to the fourth quarter from prior guidance of early 2025.
Recent Portfolio Activity
The table below shows all buys and sells completed during the quarter, followed by a brief rationale.
| Buys | Sells |
|---|---|
| Analog Devices | ON Semiconductor |
| Broadcom |
Buys
Analog Devices
Analog Devices is a global semiconductor leader dedicated to solving customers’ most complex engineering challenges. The company delivers innovations that connect technology to human breakthroughs and play a critical role at the intersection of the physical and digital worlds by providing the building blocks to sense, measure, interpret, connect and power. Analog designs, manufactures, tests and markets a broad portfolio of solutions, including integrated circuits, software and subsystems that leverage high-performance analog, mixed-signal and digital signal processing technologies. Its comprehensive product portfolio, deep domain expertise and advanced manufacturing capabilities extend across high-performance precision and high-speed mixed-signal, power management and processing technologies, including data converters, amplifiers, power management, radio frequency, integrated circuits, edge processors and other sensors. The company’s customers include original equipment manufacturers and customers that build electronic subsystems for integration into larger systems.
We see the company’s analog products providing exposure to high-growth trends, including automotive electrification and driver assistance systems, factory intelligence and automation, the Intelligent Edge, Internet of Things device proliferation, and sustainable energy. We expect the company to return excess free cash flow, benefiting shareholders.
Broadcom
Broadcom is a global technology leader that designs, develops and supplies a broad range of semiconductor and infrastructure software solutions. The company strategically focuses its research and development resources to address niche opportunities in target markets and leverage its extensive portfolio of U.S. and other patents and other intellectual property to integrate multiple technologies and create system-on-chip component and software solutions that target growth opportunities. Broadcom designs products and software that deliver high performance and provide mission-critical functionality. The company has a history of innovation in the semiconductor industry and offers thousands of products that are used in end products such as enterprise and data center networking, home connectivity, “set-top boxes broadband access”, telecommunication equipment, smartphones and base stations, data center servers and storage systems, factory automation, power generation and alternative energy systems, and electronic displays. Broadcom differentiates itself through its high-performance design and integration capabilities and focuses on developing products for target markets where it believes it can earn attractive margins.
We view Broadcom’s semiconductor business as being very well positioned to benefit from secular growth in data center networking, which is being driven by AI and cloud computing. The company continues to invest in research and development, and we see this as a competitive advantage for the company. Broadcom’s infrastructure software business is a recurring revenue business model that provides mission-critical mainframe support software to its customer base. The recent VMware acquisition will enhance this business strategy and accelerate the growth rate of this business unit, as VMware’s product suite includes key tools for AI server upgrades. Our long-term investment thesis is supported by Broadcom’s success in its strategy of maintaining technology and market share leadership in mission-critical markets with high switching costs and deep profit pools.
Sells
ON Semiconductor
We sold ON Semiconductor and have become more cautious on the global automotive market, especially for electric vehicles, which we believe will see a period of slower sales due to both new infrastructure requirements and consumers becoming more knowledgeable about the potential costs and issues with owning EVs. In addition, the market is becoming a lot more competitive on the supply side, with many new models being launched simultaneously, which we believe will lead to pricing pressures for the OEMs, which could create pricing headwinds for suppliers such as ON Semiconductor. While we see global EV penetration as continuing to increase over the next decade, supported by government incentives, we remain cautious in the near term and believe we are entering a period of lower sales trends following the explosive growth of the past three years.
Outlook
The equity markets in the second quarter posted positive returns, led by the broadening secular trend in AI. The move in interest rates was muted in the quarter as markets await a clear signal from the Federal Reserve on the timing of a rate reduction. On the margin, economic activity slowed, with multiple ISM manufacturing readings in contraction territory and a weakening housing market. Equity valuations remain high, with AI-focused companies contributing the most to these elevated levels. The geopolitical situation remains very unsettled, and a U.S. presidential election moves into focus, adding to the level of uncertainty. With many issues unresolved, we could see markets move into a period of higher volatility off very low levels. The equity markets continue to reflect the positive backdrop of growing earnings and a potential lowering of interest rates. Our focus will continue to be at the company level, with an emphasis on seeking to invest in companies with secular tailwinds or strong product-driven cycles.
The opinions expressed herein are those of Aristotle Atlantic Partners, LLC (Aristotle Atlantic) and are subject to change without notice. Past performance is not a guarantee or indicator of future results. This material is not financial advice or an offer to purchase or sell any product. You should not assume that any of the securities transactions, sectors or holdings discussed in this report were or will be profitable, or that recommendations Aristotle Atlantic makes in the future will be profitable or equal the performance of the securities listed in this report. The portfolio characteristics shown relate to the Aristotle Atlantic Large Cap Growth strategy. Not every client’s account will have these characteristics. Aristotle Atlantic reserves the right to modify its current investment strategies and techniques based on changing market dynamics or client needs. There is no assurance that any securities discussed herein will remain in an account’s portfolio at the time you receive this report or that securities sold have not been repurchased. The securities discussed may not represent an account’s entire portfolio and, in the aggregate, may represent only a small percentage of an account’s portfolio holdings. The performance attribution presented is of a representative account from Aristotle Atlantic’s Large Cap Growth Composite. The representative account is a discretionary client account which was chosen to most closely reflect the investment style of the strategy. The criteria used for representative account selection is based on the account’s period of time under management and its similarity of holdings in relation to the strategy. Recommendations made in the last 12 months are available upon request. Returns are presented gross and net of investment advisory fees and include the reinvestment of all income. Gross returns will be reduced by fees and other expenses that may be incurred in the management of the account. Net returns are presented net of actual investment advisory fees and after the deduction of all trading expenses.
All investments carry a certain degree of risk, including the possible loss of principal. Investments are also subject to political, market, currency and regulatory risks or economic developments. International investments involve special risks that may in particular cause a loss in principal, including currency fluctuation, lower liquidity, different accounting methods and economic and political systems, and higher transaction costs. These risks typically are greater in emerging markets. Securities of small‐ and medium‐sized companies tend to have a shorter history of operations, be more volatile and less liquid. Value stocks can perform differently from the market as a whole and other types of stocks.
The material is provided for informational and/or educational purposes only and is not intended to be and should not be construed as investment, legal or tax advice and/or a legal opinion. Investors should consult their financial and tax adviser before making investments. The opinions referenced are as of the date of publication, may be modified due to changes in the market or economic conditions, and may not necessarily come to pass. Information and data presented has been developed internally and/or obtained from sources believed to be reliable. Aristotle Atlantic does not guarantee the accuracy, adequacy or completeness of such information.
Aristotle Atlantic Partners, LLC is an independent registered investment adviser under the Advisers Act of 1940, as amended. Registration does not imply a certain level of skill or training. More information about Aristotle Atlantic, including our investment strategies, fees and objectives, can be found in our Form ADV Part 2, which is available upon request. AAP-2407-12
Sources: CAPS CompositeHubTM, Russell Investments
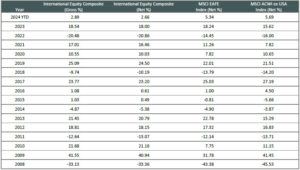
Composite returns for all periods ended June 30, 2024 are preliminary pending final account reconciliation.
Past performance is not indicative of future results. Performance results for periods greater than one year have been annualized. Returns are presented gross and net of investment advisory fees and include the reinvestment of all income. Gross returns will be reduced by fees and other expenses that may be incurred in the management of the account. Net returns are presented net of actual investment advisory fees and after the deduction of all trading expenses.
The Russell 1000® Growth Index measures the performance of the large cap growth segment of the U.S. equity universe. It includes those Russell 1000 companies with higher price-to-book ratios and higher forecasted growth values. This index has been selected as the benchmark and is used for comparison purposes only. The Russell 1000® Value Index measures the performance of the large cap value segment of the U.S. equity universe. It includes those Russell 1000 companies with lower price-to-book ratios and lower expected growth values. The Russell 2000® Index measures the performance of the small cap segment of the U.S. equity universe. The Russell 2000 Index is a subset of the Russell 3000® Index representing approximately 10% of the total market capitalization of that index. It includes approximately 2000 of the smallest securities based on a combination of their market cap and current index membership. The S&P 500® Index is the Standard & Poor’s Composite Index of 500 stocks and is a widely recognized, unmanaged index of common stock prices. The Dow Jones Industrial Average® is a price-weighted measure of 30 U.S. blue-chip companies. The Index covers all industries except transportation and utilities. The NASDAQ Composite Index measures all NASDAQ domestic and international based common type stocks listed on The NASDAQ Stock Market. The NASDAQ Composite includes over 3,000 companies, more than most other stock market indices. The Bloomberg U.S. Aggregate Bond Index is an unmanaged index of domestic investment grade bonds, including corporate, government and mortgage-backed securities. The WTI Crude Oil Index is a major trading classification of sweet light crude oil that serves as a major benchmark price for oil consumed in the United States. The 3-Month U.S. Treasury Bill is a short-term debt obligation backed by the U.S. Treasury Department with a maturity of three months. The Consumer Price Index (CPI) is a measure of the average change over time in the prices paid by urban consumers for a market basket of consumer goods and services. While stock selection is not governed by quantitative rules, a stock typically is added only if the company has an excellent reputation, demonstrates sustained growth and is of interest to a large number of investors. The volatility (beta) of the Composite may be greater or less than its respective benchmarks. It is not possible to invest directly in these indices.