Commentary
Small Cap Equity 2Q 2023
ARISTOTLE CAPITAL BOSTON, LLC
Markets Review
After posting negative returns in April and May small caps rebounded in June to exit the quarter in positive territory. Investor optimism largely overshadowed concerns about interest rates, inflation, and a recession during the quarter as enthusiasm over technology advances fueled a rally in a narrow group of mega-cap stocks seen as the big winners from the artificial intelligence revolution. These outsized gains drove strong returns for the tech-heavy Russell 1000 Index, which posted a total return of 8.58% during the quarter, leading the Russell 2000 Index of small caps, which returned 5.21%. On the policy front, in mid-June the Federal Reserve decided to hold off on raising interest rates as it takes stock of how its prior rate hikes are impacting the real economy. While this ends a streak of 10 consecutive rate increases, central bank officials were quick to point out that the tightening cycle is not necessarily over, indicating that additional rate hikes may be required. With a strong labor market, restabilized banking sector and resilient growth, it appears the Fed does not yet believe economic conditions are restrictive enough to bring inflation back to their 2% target.
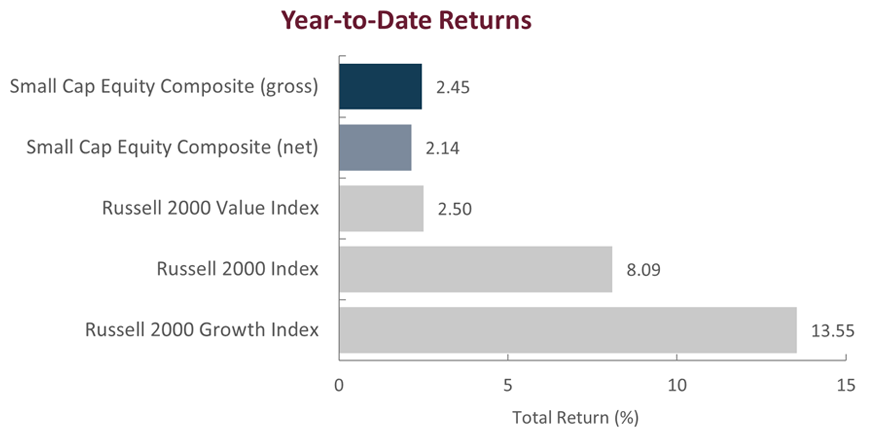
Within small cap markets, growth continued to outperform value in the quarter as evidenced by the Russell 2000 Growth Index returning 7.05% compared to 3.18% for the Russell 2000 Value Index. The year-to-date differential exiting the second quarter is the 3rd largest between growth vs. value to begin the year since the benchmarks were created. Penny stocks, highly shorted stocks, and unprofitable companies also outperformed during the quarter, while profitable companies generally lagged. More specifically, companies expected to lose money over the next twelve months outperformed those with expected profits by 6.85% during the period. While this dispersion would be extreme in any market environment, we believe it is even more unique given the uncertain macroeconomic backdrop, rising cost of capital, and uptick in bankruptcies which typically correlates to a more favorable relative performance backdrop for profitable companies with sound fundamentals.
At the sector level, nine of the eleven sectors in the Russell 2000 Index generated positive returns during the second quarter, however, only three generated gains above that of the broader index. Health Care (+11.48%), Industrials (+9.91%), and Information Technology (+8.71%) were the only sectors to outperform during the period while Utilities (-3.60%), Financials (-1.08%), and Communication Services (0.02%) lagged. Further demonstrating the narrowness of the market is the fact that 75% of the Russell 2000 Index’s quarterly contribution to return came from just four industries (Capital Goods, BioPharma, Health Care Equipment & Services, and Technology Hardware). This type of concentrated market leadership has historically made it challenging for diversified active managers to outperform.

Sources: SS&C Advent; Russell Investments
Past performance is not indicative of future results. Returns are presented gross and net of investment advisory fees and include the reinvestment of all income. Gross returns will be reduced by fees and other expenses that may be incurred in the management of the account. Net returns are presented net of actual investment advisory fees and after the deduction of all trading expenses. Aristotle Small Cap Equity Composite returns are preliminary pending final account reconciliation. Please see important disclosures at the end of this document.
Performance Review
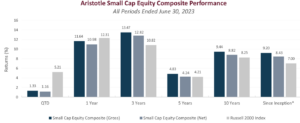
For the second quarter of 2023, the Aristotle Small Cap Equity Composite posted a total return of 1.16% net of fees (1.33% gross of fees), trailing the 5.21% total return of the Russell 2000 Index. Underperformance was driven by security selection while allocation effects positively contributed. Overall, security selection within the Health Care, and Information Technology and Consumer Discretionary sectors detracted the most from relative performance while security selection in Communication Services and Materials along with an overweight to Industrials contributed.
| Relative Contributors | Relative Detractors |
|---|---|
| Itron | ModivCare |
| Dycom | Mercury Systems |
| Customers Bancorp | Ardmore Shipping |
| Summit Materials | Infinera |
| AZEK | Aspen Technology |
CONTRIBUTORS
Itron (ITRI), a global manufacturer and distributor of electric, water and gas meters and advanced meter systems, benefitted from an improving operational outlook for its business, which has been held back in recent periods by supply chain constraints leading to delays of product deliveries. We maintain a position, as we believe the company remains well-positioned to benefit from power grid modernization efforts, which should continue to drive demand for the company’s smart metering and grid monitoring solutions. Additionally, we believe an acceleration in the company’s services and SaaS-based revenue will improve the earnings and margin profile of the business moving forward.
Dycom (DY), a provider of engineering and construction services to the telecommunications and cable television industries, benefitted from continued growth in its core business and expanding margins as demand for wireline services continues to grow. We maintain a position as we believe the company remains well positioned for longer term growth alongside secular trends for expanding fiber deployments to support faster broadband connectivity speeds and opportunities to deploy fiber to rural or underserved areas across the country.
DETRACTORS
ModivCare (MODV), a Colorado-based health care services company that provides non-emergency medical transportation (NEMT), homecare services, and remote monitoring to Medicaid and Medicare populations declined during the period. We believe the catalyst for the pullback appears to be a function of concerns around potential reimbursement rate cuts. Nevertheless, we continue to maintain a position, as we believe that any potential cuts are overly discounted in the share price, and that the fundamental outlook for the business remains attractive.
Mercury Systems (MRCY), a provider of secure sensor and safety-critical processing subsystems for the aerospace and defense markets, declined amid supply chain and logistical challenges, a resulting increase in lead times, and labor cost headwinds. We maintain a position, as we believe the company remains well-positioned to capitalize on continued outsourcing of subsystem development, modernization initiatives, and continued technological innovation under a new incoming leadership team.
Recent Portfolio Activity
| Buys/Acquisitions | Sells/Liquidations |
|---|---|
| GXO Logistics | Adeia |
| Cerence | Star Holdings |
BUYS/ACQUISITIONS
GXO Logistics (GXO), a pure-play contract logistics company that offers warehousing, distribution, fulfillment, e-commerce, reverse logistics, and other custom solutions, was added to the portfolio. As one of the largest warehouse logistics providers in the world, we believe the company remains well positioned to benefit from a variety of secular tailwinds including: increases in outsourcing of fulfillment capabilities, automation of warehouse operations, global e-commerce growth and adoption, and nearshoring of warehouse and distribution networks.
Cerence (CRNC), a provider of artificial intelligence (AI)-powered voice recognition software and services to automotive original equipment manufacturers (OEMs), was added to the portfolio. The company’s products provide voice, motion, control, safety and a user experience interface for drivers and passengers. As a market share leader in voice AI, we believe the company remains uniquely positioned to drive increased content per vehicle over the next several years as the OEMs continue to incorporate new technologies into their vehicles.
SELLS/LIQUIDATIONS
Adeia (ADEA) is an intellectual property (IP) licensing business with patent assets focused on the media and semiconductor end markets. The company was spun off and rebranded from our former portfolio holding Xperi, and after further analysis, we decided to sell our position.
Star Holdings (STHO) is a separate public company that was spun off and created as a result of the merger between our existing holdings iStar and Safehold. This newly created entity consists of iStar’s historical non-ground lease related commercial real estate businesses. We decided to liquidate our position as we believe the future value of iStar’s legacy portfolio remains within its ground lease REIT business rather than its multi-use non-ground lease property portfolio.
Outlook
Several macroeconomic events that occurred during the first half of the year did in fact play out how many investors anticipated: Inflation trended lower, U.S. economic growth slowed from the prior year, the Federal Reserve appears to be near(ing) the latter stages of its rate-hike cycle, and the U.S. government debt ceiling standoff was resolved before a potential default. One perhaps unexpected outcome has been the strength and leadership of the broader stock market. The first half of 2023 has produced strong returns across most equity markets, driven by investor optimism following a tumultuous 2022. While the second half of 2023 may hold the potential for fewer surprises, the lagging effects of tightening in the real economy, sticky and stubborn inflation, and a muted outlook for corporate earnings suggest the path ahead remains uncertain. As a result, we believe prudence dictates remaining true to our long-term approach, quality-orientation, and valuation discipline.
From an asset class perspective, valuations of small versus large continue to remain near multi-decade lows, which we believe suggests a more favorable setup for small caps relative to large caps in the periods to come (11.5x P/E for the Russell 2000 Index vs. 21.4x P/E for the Russell 1000 Index). Small caps, as represented by the Russell 2000, also remain historically attractive on an absolute basis and are trading near their lowest levels in over 30 years, slightly above the lows during the GFC and below the COVID-19 recession and 2001 recession lows. Concentration within the large cap market also remains high, with the top five stocks comprising over 24% of the S&P 500 at quarter end, eclipsing prior highs experienced during the 2000 and 1973 periods. Investors who piled into a small group of large cap names during these time periods learned a painful lesson as valuations stretched too far, sentiment shifted and returns rapidly reversed, giving way to greater participation down the cap spectrum and jumpstarting a multiyear cycle of outperformance for small caps. So, while past performance is not always indicative of future returns, and the near-term outlook remains uncertain, decades of investing have taught us that these can be the most rewarding times to be invested in small caps for the long-term.
Positioning
As always, our current positioning is a function of our bottom-up security selection process and our ability to identify what we view as attractive investment candidates, regardless of economic sector definitions. Overweights in Industrials and Information Technology are mostly a function of recent portfolio activity and the relative performance of our holdings in these sectors over the past few periods. Conversely, we continue to be underweight in Consumer Discretionary, as we have been unable to identify what we consider to be compelling long-term opportunities that fit our discipline given the rising risk profiles of many retail businesses and a potential deceleration in goods spending following a period of strength fueled in part by government backed stimulus payments. While the portfolio’s allocation to Health Care is modestly below that of the benchmark’s, we continue to remain underweight the Biotechnology industry as many companies within that group do not fit our discipline due to their elevated levels of binary risk. Given the rising levels of volatility and the apparent short-term disconnect between certain areas of the market and business fundamentals, we believe it is important to remain patient in identifying investment opportunities to ensure they offer a compelling risk-reward trade-off and a sufficient margin of safety. Furthermore, we remain focused on trying to understand the risks associated with each investment position within the context of our fundamentally oriented research process and managing those risks through a disciplined approach to portfolio construction and management.
The opinions expressed herein are those of Aristotle Capital Boston, LLC (Aristotle Boston) and are subject to change without notice.
Past performance is not indicative of future results. The information provided in this report should not be considered financial advice or a recommendation to purchase or sell any particular security. There is no assurance that any securities discussed herein will remain in an account’s portfolio at the time you receive this report or that securities sold have not been repurchased. The securities discussed may not represent an account’s entire portfolio and, in the aggregate, may represent only a small percentage of an account’s portfolio holdings. The performance attribution presented is of a representative account from Aristotle Boston’s Small Cap Equity Composite. The representative account is a discretionary client account which was chosen to most closely reflect the investment style of the strategy. The criteria used for representative account selection is based on the account’s period of time under management and its similarity of holdings in relation to the strategy. It should not be assumed that any of the securities transactions, holdings or sectors discussed were or will be profitable, or that the investment recommendations or decisions Aristotle Boston makes in the future will be profitable or equal the performance of the securities discussed herein. Aristotle Boston reserves the right to modify its current investment strategies and techniques based on changing market dynamics or client needs. Recommendations made in the last 12 months are available upon request.
Returns are presented gross and net of investment advisory fees and include the reinvestment of all income. Gross returns will be reduced by fees and other expenses that may be incurred in the management of the account. Net returns are presented net of actual investment advisory fees and after the deduction of all trading expenses.
Effective January 1, 2022, the Aristotle Small Cap Equity Composite has been redefined to exclude accounts with meaningful industry-specific restrictions or substantial values-based screens hampering implementation of the small cap strategy.
Effective January 1, 2022, the Russell 2000 Value Index was removed as the secondary benchmark for the Aristotle Capital Boston Small Cap Equity strategy.
All investments carry a certain degree of risk, including the possible loss of principal. Investments are also subject to political, market, currency and regulatory risks or economic developments. International investments involve special risks that may in particular cause a loss in principal, including currency fluctuation, lower liquidity, different accounting methods and economic and political systems, and higher transaction costs.
These risks typically are greater in emerging markets. Securities of small‐ and medium‐sized companies tend to have a shorter history of operations, be more volatile and less liquid. Value stocks can perform differently from the market as a whole and other types of stocks. The material is provided for informational and/or educational purposes only and is not intended to be and should not be construed as investment, legal or tax advice and/or a legal opinion. Investors should consult their financial and tax adviser before making investments.
The opinions referenced are as of the date of publication, may be modified due to changes in the market or economic conditions, and may not necessarily come to pass.
The firm’s coverage of Signature Bank includes time at a predecessor firm.
Aristotle Capital Boston, LLC is an independent investment adviser registered under the Investment Advisers Act of 1940, as amended. Registration does not imply a certain level of skill or training. More information about Aristotle Boston, including our investment strategies, fees and objectives, can be found in our Form ADV Part 2, which is available upon request. ACB-2307-14


Sources: SS&C Advent, Russell Investments
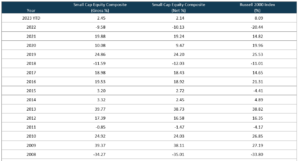
Composite returns for periods ended June 30, 2023 are preliminary pending final account reconciliation.
*The Aristotle Small Cap Equity Composite has an inception date of November 1, 2006 at a predecessor firm. During this time, Jack McPherson and Dave Adams had primary responsibility for managing the strategy. Performance starting January 1, 2015 was achieved at Aristotle Boston.
**For the period November 2006 through December 2006.
Past performance is not indicative of future results. Performance results for periods greater than one year have been annualized.
Effective January 1, 2022, the Aristotle Small Cap Equity Composite has been redefined to exclude accounts with meaningful industry-specific restrictions or substantial values-based screens hampering implementation of the small cap strategy.
Effective January 1, 2022, the Russell 2000 Value was removed as the secondary benchmark for the Aristotle Capital Boston Small Cap Equity strategy.
Returns are presented gross and net of investment advisory fees and include the reinvestment of all income. Gross returns will be reduced by fees and other expenses that may be incurred in the management of the account. Net returns are presented net of actual investment advisory fees and after the deduction of all trading expenses. Please see important disclosures enclosed within this document.
The Russell 2000® Index measures the performance of the small cap segment of the U.S. equity universe. The Russell 2000 Index is a subset of the Russell 3000® Index representing approximately 10% of the total market capitalization of that index. It includes approximately 2000 of the smallest securities based on a combination of their market cap and current index membership. The Russell 2000 Growth® Index measures the performance of the small cap companies located in the United States that also exhibit a growth probability. The Russell 2000 Value® Index measures the performance of the small cap companies located in the United States that also exhibit a value probability. The Russell 1000® Index measures the performance of the large cap segment of the U.S. equity universe. The Russell 1000 Index is a subset of the Russell 3000® Index, representing approximately 90% of the total market capitalization of that index. It includes approximately 1,000 of the largest securities based on a combination of their market capitalization and current index membership. The volatility (beta) of the composite may be greater or less than the benchmarks. It is not possible to invest directly in these indices.

