Commentary
Global Equity 3Q 2023
(All MSCI index returns are shown net and in U.S. dollars unless otherwise noted.)
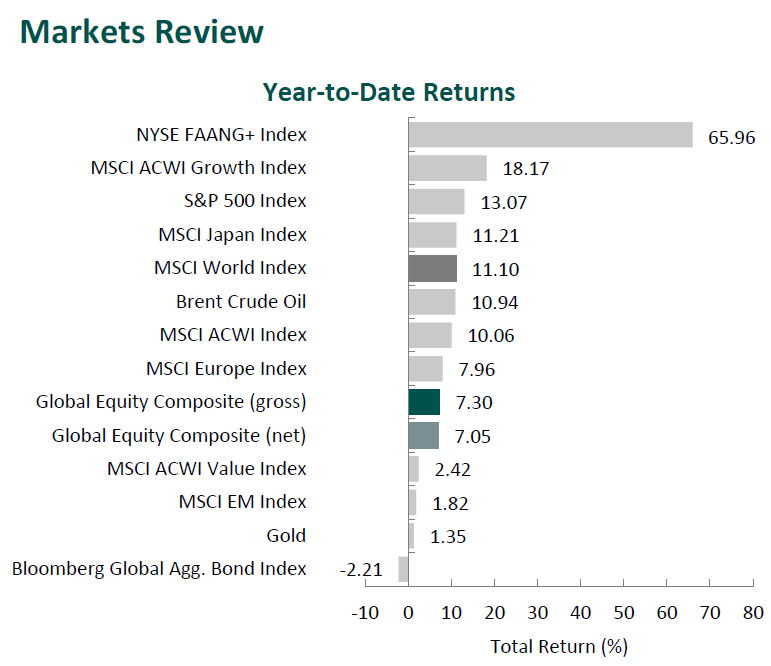
Markets Review

Sources: CAPS CompositeHubTM, Bloomberg
Past performance is not indicative of future results. Aristotle International Equity Composite returns are presented gross and net of investment advisory fees and include the reinvestment of all income. Gross returns will be reduced by fees and other expenses that may be incurred in the management of the account. Net returns are presented net of actual investment advisory fees and after the deduction of all trading expenses. Aristotle Capital Composite returns are preliminary pending final account reconciliation. Please see important disclosures at the end of this document.
After three consecutive positive quarters, global equity markets reversed, as the MSCI ACWI Index fell 3.40% during the period. Concurrently, the Bloomberg Global Aggregate Bond Index decreased 3.59%. In terms of style, value stocks outperformed their growth counterparts during the quarter, with the MSCI ACWI Value Index beating the MSCI ACWI Growth Index by 3.13%.
Both regionally and on a sector basis, declines were broad-based. Asia/Pacific ex-Japan and Europe were the worst performers, while Latin America, the only region to post a positive return, and Japan were the best. Meanwhile, nine out of the eleven sectors within the MSCI ACWI Index posted losses, with Utilities, Real Estate and Consumer Staples being the worst performers. Energy and Communication Services finished in the green, while Financials declined the least.
Although global financial markets experienced less turmoil than they did earlier this year, inflation remains elevated and economic data remains weak. In fact, the IMF forecast global GDP growth to decline to 3.0% in 2023.
China’s recovery remained sluggish amid an ongoing property slump and lackluster consumer spending. Meanwhile, high levels of inflation persisted across many regions of the world, although inflation in the U.S., eurozone and the U.K. eased significantly from levels seen earlier in the year. As such, the IMF trimmed its global inflation projection to 6.8% from its prior estimate of 7.0% in April but warned inflation could remain high or reaccelerate due to factors such as geopolitics and weather-related events.
By contrast, in Asia, Japanese inflation edged down to 3.2% in August, and the Bank of Japan diverged from its Western counterparts by keeping short-term interest rates steady. China also took an easier approach to its monetary policy, cutting both short- and medium-term lending rates, as the country has struggled to recover following the pandemic. The People’s Bank of China hopes to combat weak consumer spending, falling exports and the country’s real estate crisis. Chinese property developers have come under increased scrutiny, as Evergrande filed for bankruptcy protection in the U.S. while Country Garden warned investors of significant losses.
On the geopolitical front, Ukraine continues to push its counteroffensive in the eastern and southern portions of the country. Western nations have largely remained dedicated to their support of Ukraine, as countries such as the U.S., Canada and the U.K. have all pledged to provide additional aid. In Taiwan, China carried out military exercises in the Taiwan Strait following the Taiwanese vice president’s visit to New York and San Francisco. Despite tense relations between the U.S. and China, the Biden Administration announced $345 million in military aid for Taiwan.
Performance and Attribution Summary
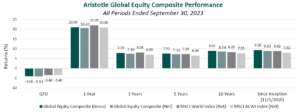
For the third quarter of 2023, Aristotle Capital’s Global Equity Composite posted a total return of -4.06% gross of fees (-4.13% net of fees), underperforming the MSCI World Index, which returned -3.46%, and the MSCI ACWI Index, which returned -3.40%. Please refer to the table below for detailed performance.
| Performance (%) | 3Q23 | YTD | 1 Year | 3 Years | 5 Years | 10 Years | Since Inception* |
|---|---|---|---|---|---|---|---|
| Global Equity Composite (gross) | -4.06 | 7.30 | 20.99 | 7.79 | 7.51 | 8.92 | 9.26 |
| Global Equity Composite (net) | -4.13 | 7.05 | 20.62 | 7.46 | 7.16 | 8.54 | 8.83 |
| MSCI World Index (net) | -3.46 | 11.10 | 21.95 | 8.08 | 7.25 | 8.26 | 8.82 |
| MSCI ACWI Index (net) | -3.40 | 10.06 | 20.80 | 6.89 | 6.46 | 7.55 | 7.92 |

Source: FactSet
Past performance is not indicative of future results. Attribution results are based on sector returns which are gross of investment advisory fees. Attribution is based on performance that is gross of investment advisory fees and includes the reinvestment of income.
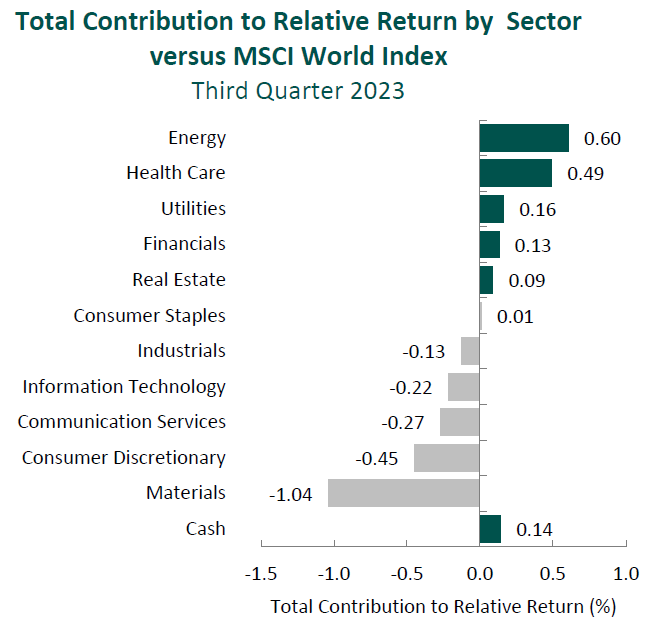
From a sector perspective, the portfolio’s underperformance relative to the MSCI World Index can be attributed to security selection, while allocation effects had a positive impact. Security selection in Materials, Consumer Discretionary and Information Technology detracted the most from the portfolio’s relative performance. Conversely, security selection in Health Care and Energy and a lack of exposure to Utilities contributed to relative return.
Regionally, both allocation effects and security selection were responsible for the portfolio’s underperformance relative to the MSCI World Index. Security selection in Europe and our exposure in Emerging Markets detracted the most from relative performance, while an overweight in Japan contributed.
Contributors and Detractors for 3Q 2023
| Relative Contributors | Relative Detractors |
|---|---|
| Cameco | FMC |
| Amgen | LVMH |
| TotalEnergies | FANUC |
| FirstCash | Nemetschek |
| Oshkosh | Microchip Technology |
Japan-based FANUC, the global manufacturer of industrial robots as well as control systems for machine tools, was a primary detractor for the period. During the June quarter, orders for the company’s robots fell 23% year-on-year following ten consecutive quarters of annual increases. This abrupt decline may have been due to inventory adjustments in China and the Americas as many manufacturers became more cautious over capital investments. Looking past the short-term headwinds, we will continue to monitor the company’s progress shifting its revenue mix toward higher-margin service and IoT capabilities, which should improve profitability. This includes its FIELD platform, which offers predictive maintenance, optimization and self-learning that customers can utilize to reduce production downtime and energy costs. Moreover, we believe long-term prospects for the company are underappreciated since FANUC, as the industrial robot market leader, is uniquely positioned to benefit from further penetration of factory automation and robot usage across geographies.
Microchip Technology, the microcontroller (MCU) and analog semiconductor producer, was a primary detractor for the period. Despiteposting record levels of sales, margins and gross profit, management indicated it expects a challenging near-term demand environment due to weakness in China, a slowdown in Europe and early signs of weakness in auto. The company has also accommodated some push-out requests from customers, which will translate into lower sales for the coming months. Despite operating in a cyclical industry, Microchip has been able to generate 15+ years of robust FREE cash flow and margins, while lowering its debt (has paid down $6.8 billion of debt over the last 20 quarters, reducing net leverage to 1.29x) and consistently returning money to shareholders. This, we believe, speaks to management’s proven ability to manage the business through economic cycles, while taking advantage of its broad portfolio to continue gaining share in areas including IoT, 5G infrastructure, autonomous driving and data centers.
Amgen, the biopharmaceutical company, was one of the top contributors for the quarter. The company continues to leverage its innovative platform to strengthen its product portfolio, offset maturing products, such as Epogen and Neulasta, and increase market share. Over the past year, Amgen has reported double-digit volume growth, operating margin expansion to over 40% and record levels of sales for cholesterol drug Repatha, bone-strengthening drug Prolia and cancer drug Blincyto. Additionally, the company remains well positioned to benefit from the continued development and commercialization of biosimilars such as Amgevita, the first biosimilar to Humira, and the successful integration of Otezla to bolster its inflammation segment. Lastly, the FTC agreed to allow Amgen to proceed with its $27.8 billion acquisition of Horizon Therapeutics. We note that this is yet another unsuccessful attempt by the FTC to block an M&A transaction of one of our holdings (see below re: Activision Blizzard). The transaction closed on October 6, 2023 and brings expertise in rare disease therapies (including bulging eye-drug Tepezza), as well as adds to Amgen’s immunology portfolio.
TotalEnergies, one of the world’s largest energy companies, was also a primary contributor for the quarter. The company continues to execute on its strategic plan to reach net-zero emissions by 2050 which, in contrast to many European energy providers, it looks to achieve through expanding ownership of renewable power and low-carbon assets rather than purely divestment. The company expects to more than double its gross renewable generation capacity by 2025 (primarily in solar) and invest over 30% of its total spending in low-carbon businesses through 2030. As such, we believe TotalEnergies is uniquely positioned to benefit from the increase in global demand for clean energy. In recent years, TotalEnergies’ reduction in capex and operating expenses has improved its FREE cash flow generation, now further aided by the favorable energy environment. This has supported its continued ability to return cash to shareholders, one of our catalysts, as demonstrated by the $3.8 billion returned through share buybacks and dividends during the second quarter.
Recent Portfolio Activity
| Buys | Sells |
|---|---|
| Jazz Pharmaceuticals | Magna International |
During the quarter, we sold our position in Magna International and invested in a new position, Jazz Pharmaceuticals.
We first invested in Magna International, a Canada-based global auto parts, systems and assembly company, in the first quarter of 2020. The company, in our opinion, has a unique capability of supplying parts for an increasingly electrified and autonomous fleet of vehicles. This includes Magna’s specialty in lightweighting vehicles—a necessity for heavy electric cars—as well as its years of investment in self-driving technologies. In addition, with leading market share positions in many of its core markets and products, we believe Magna remains well positioned to benefit as content-per-vehicle increases and automotive parts and systems become more complex. Though the company continues to meet each of our criteria for investment, we decided to exit our position in Magna to fund our purchase of Jazz Pharmaceuticals, which we view as a more optimal investment.
Jazz Pharmaceuticals plc
Founded in 2003, Jazz Pharmaceuticals is a global biopharmaceutical company headquartered in Ireland. The drugmaker’s portfolio of nine approved products focuses on conditions with limited therapeutic treatments in neuroscience (~75% of 2022 revenue) and oncology (~25%).
Jazz’s drug Xyrem was added to its portfolio in 2005 and was approved for use in patients with narcolepsy. The drug’s strong efficacy propelled it to be the standard of care for this incurable sleep condition and has achieved wide adoption for the treatment of excessive daytime sleepiness and cataplexy (episodes of loss of muscle control).
Xyrem’s patent exclusivity ended in January 2023, and authorized generic versions of the product have entered the market. To prepare for the patent cliff, the company developed Xywav, a lower-sodium version of Xyrem, which is touted for its potentially better heart safety. The drug has received FDA approval for the treatment of narcolepsy and idiopathic hypersomnia and has orphan drug exclusivity through 2027.
Jazz has focused on adding new products to its portfolio through both internal innovation and acquisitions. At the end of 2022, 63% of Jazz’s net product sales were generated from products launched or acquired over the past three years, while 75% of net product sales were generated by a single drug—Xyrem—in 2018. Within oncology, Jazz received recent approvals for Zepzelca (for small cell lung cancer) and Rylaze (for acute lymphoblastic leukemia). In addition, through the acquisition of GW Pharmaceuticals in 2021, Jazz added Epidiolex for the treatment of severe (and rare) forms of epilepsy.
High-Quality Business
Some of the quality characteristics we have identified for Jazz Pharmaceuticals include:
- Decades of success developing and marketing novel treatments for rare conditions using biopharmaceuticals;
- Jazz’s extensive network of sleep doctors provides the company with a competitive edge to promote new therapies;
- History of strong FREE cash flow generation with a track record of accretive acquisitions; and
- Pricing power, as the company’s key drugs treat rare diseases where alternative options are limited.
Attractive Valuation
Based on our estimates, shares of the company are attractively valued. We believe continued market share gains for several of the company’s therapies will lead to higher levels of normalized FREE cash flow than are currently appreciated by the market. Though not (yet) incorporated into our estimates, we view the company’s strong neuroscience and oncology pipeline assets as “free options.”
Compelling Catalysts
Catalysts we have identified for Jazz Pharmaceuticals, which we believe will cause its stock price to appreciate over our three- to five-year investment horizon, include:
- Continued market share gains for Xywav, as this recently released drug has already achieved market-leading adoption in narcolepsy and increased patient usage for idiopathic hypersomnia;
- Increased penetration of Epidiolex, which has demonstrated strong efficacy and where there are limited therapeutic substitutes for the rare forms of epilepsy it treats; and
- Further uptake of Zepzelca—a well-established, second-line cancer treatment that is also being studied for potential usage as a first-line treatment.
Conclusion
Rather than attempting to predict short-term market dynamics, at Aristotle Capital, we stay focused on understanding company fundamentals while carefully monitoring the long-term evolution of our portfolio of holdings. Our approach to understanding individual businesses reveals more insightful conclusions than would undue time spent concentrating on ever-changing and often unclear macroeconomic signals. While we strive to remain macro aware, our goal instead is to invest in businesses which are run by what we believe are capable and proven management teams that have the skill to navigate changing factors such as inflation, interest rates and government policy. We also analyze how such factors could alter the fundamentals of a business and whether those impacts are long term in nature.
We aim to find companies with high-quality characteristics that can succeed over full market cycles. It is our belief that a disciplined, research-oriented approach to finding great companies, as well as a consistent, well-executed portfolio management process, is how we can add the most value for our clients.
The opinions expressed herein are those of Aristotle Capital Management, LLC (Aristotle Capital) and are subject to change without notice. Past performance is not a guarantee or indicator of future results. This material is not financial advice or an offer to buy or sell any product. You should not assume that any of the securities transactions, sectors or holdings discussed in this report were or will be profitable, or that recommendations Aristotle Capital makes in the future will be profitable or equal the performance of the securities listed in this report. The portfolio characteristics shown relate to the Aristotle Global Equity strategy. Not every client’s account will have these characteristics. Aristotle Capital reserves the right to modify its current investment strategies and techniques based on changing market dynamics or client needs. There is no assurance that any securities discussed herein will remain in an account’s portfolio at the time you receive this report or that securities sold have not been repurchased. The securities discussed may not represent an account’s entire portfolio and, in the aggregate, may represent only a small percentage of an account’s portfolio holdings. The performance attribution presented is of a representative account from Aristotle Capital’s Global Equity Composite. The representative account is a discretionary client account which was chosen to most closely reflect the investment style of the strategy. The criteria used for representative account selection is based on the account’s period of time under management and its similarity of holdings in relation to the strategy. Recommendations made in the last 12 months are available upon request.
Returns are presented gross and net of investment advisory fees and include the reinvestment of all income. Gross returns will be reduced by fees and other expenses that may be incurred in the management of the account. Net returns are presented net of actual investment advisory fees and after the deduction of all trading expenses.
All investments carry a certain degree of risk, including the possible loss of principal. Investments are also subject to political, market, currency and regulatory risks or economic developments. International investments involve special risks that may in particular cause a loss in principal, including currency fluctuation, lower liquidity, different accounting methods and economic and political systems, and higher transaction costs. These risks typically are greater in emerging markets. Securities of small‐ and medium‐sized companies tend to have a shorter history of operations, be more volatile and less liquid. Value stocks can perform differently from the market as a whole and other types of stocks.
The material is provided for informational and/or educational purposes only and is not intended to be and should not be construed as investment, legal or tax advice and/or a legal opinion. Investors should consult their financial and tax adviser before making investments. The opinions referenced are as of the date of publication, may be modified due to changes in the market or economic conditions, and may not necessarily come to pass. Information and data presented has been developed internally and/or obtained from sources believed to be reliable. Aristotle Capital does not guarantee the accuracy, adequacy or completeness of such information.
Aristotle Capital Management, LLC is an independent investment adviser registered under the Investment Advisers Act of 1940, as amended. Registration does not imply a certain level of skill or training. More information about Aristotle Capital, including our investment strategies, fees and objectives, can be found in our Form ADV Part 2, which is available upon request. ACM-2310-34


Composite returns for all periods ended September 30, 2023 are preliminary pending final account reconciliation.
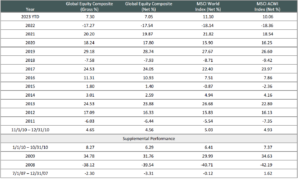
The Aristotle Global Equity Composite has an inception date of November 1, 2010; however, the strategy initially began at Howard Gleicher’s predecessor firm in July 2007. A supplemental performance track record from January 1, 2008 through October 31, 2010 is provided on this page and complements the Global Equity Composite presentation that is located at the end of this presentation. The performance results were achieved while Mr. Gleicher managed the strategy at a prior firm. The returns are those of a publicly available mutual fund from the fund’s inception through Mr. Gleicher’s departure from the firm. During that time, Mr. Gleicher had primary responsibility for managing the fund.
Past performance is not indicative of future results. The information provided should not be considered financial advice or a recommendation to purchase or sell any particular security or product. Performance results for periods greater than one year have been annualized.
Returns are presented gross and net of investment advisory fees and include the reinvestment of all income. Gross returns will be reduced by fees and other expenses that may be incurred in the management of the account. Net returns are presented net of actual investment advisory fees and after the deduction of all trading expenses
The MSCI World Index is a free float-adjusted market capitalization weighted index that is designed to measure the equity market performance of developed markets. The MSCI World Index consists of the following 23 developed market country indexes: Australia, Austria, Belgium, Canada, Denmark, Finland, France, Germany, Hong Kong, Ireland, Israel, Italy, Japan, Netherlands, New Zealand, Norway, Portugal, Singapore, Spain, Sweden, Switzerland, the United Kingdom and the United States. The MSCI Emerging Markets Index is a free float-adjusted market capitalization-weighted index that is designed to measure equity market performance of emerging markets. The MSCI Emerging Markets Index consists of the following 24 emerging market country indexes: Brazil, Chile, China, Colombia, Czech Republic, Egypt, Greece, Hungary, India, Indonesia, Korea, Kuwait, Malaysia, Mexico, Peru, Philippines, Poland, Qatar, Saudi Arabia, South Africa, Taiwan, Thailand, Turkey and United Arab Emirates. The MSCI ACWI captures large and mid-cap representation across 23 developed markets and 24 emerging markets countries. With approximately 3,000 constituents, the Index covers approximately 85% of the global investable equity opportunity set. The MSCI ACWI Growth Index captures large and mid-cap securities exhibiting overall growth style characteristics across 23 developed markets countries and 24 emerging markets countries. The MSCI ACWI Value Index captures large and mid-cap securities exhibiting overall value style characteristics across 23 developed markets countries and 24 emerging markets countries. The MSCI Europe Index captures large and mid-cap representation across 15 developed markets countries in Europe. With more than 400 constituents, the Index covers approximately 85% of the free float-adjusted market capitalization across the European developed markets equity universe. The MSCI Japan Index is designed to measure the performance of the large and mid-cap segments of the Japanese market. With approximately 250 constituents, the Index covers approximately 85% of the free float-adjusted market capitalization in Japan. The S&P 500® Index is the Standard & Poor’s Composite Index of 500 stocks and is a widely recognized, unmanaged index of common stock prices. The NYSE FAANG+ Index is an equal-dollar-weighted index designed to represent a segment of the Information Technology and Consumer Discretionary sectors consisting of highly traded growth stocks of technology and tech-enabled companies, such as Meta, Apple, Amazon, Netflix and Alphabet’s Google. The Bloomberg Global Aggregate Bond Index is a flagship measure of global investment grade debt from 28 local currency markets. This multi-currency benchmark includes Treasury, government-related, corporate and securitized fixed rate bonds from both developed and emerging markets issuers. The Brent Crude Oil Index is a major trading classification of sweet light crude oil that serves as a major benchmark price for purchases of oil worldwide. The volatility (beta) of the Composite may be greater or less than the benchmarks. It is not possible to invest directly in these indexes.


