Markets Review

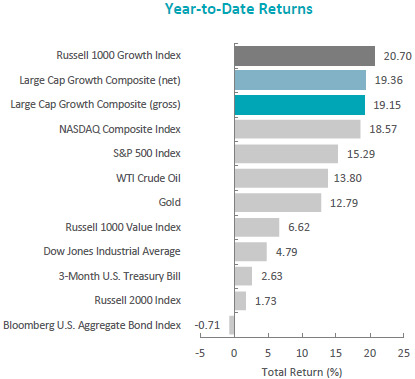
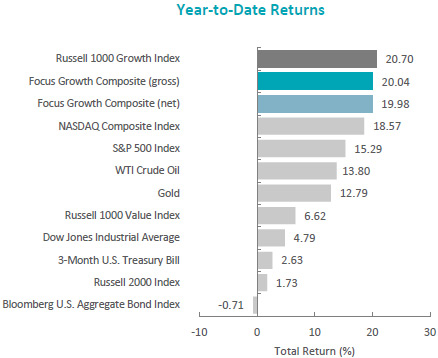
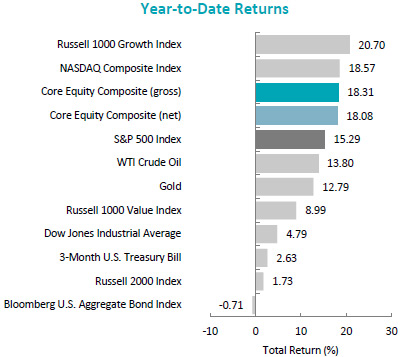
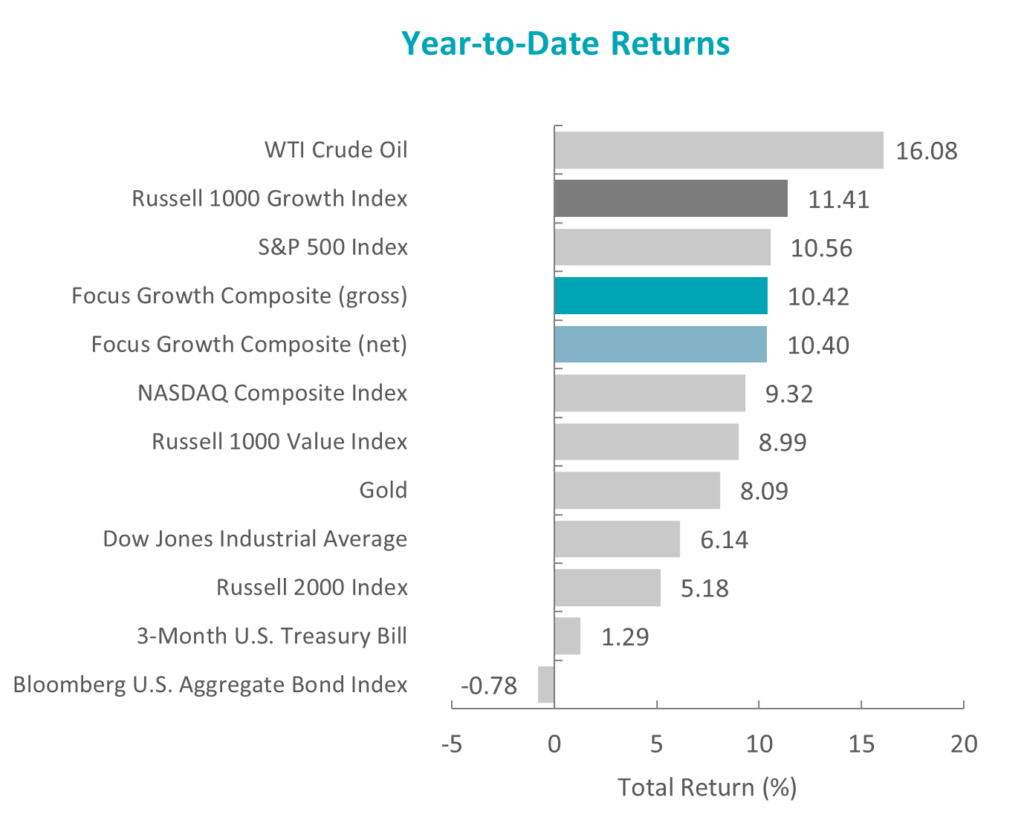
After three consecutive positive quarters, the U.S. equity market pulled back, as the S&P 500 Index declined 3.27% during the quarter. Concurrently, the Bloomberg U.S. Aggregate Bond Index also fell, dropping 3.23% for the quarter. In terms of style, the Russell 1000 Growth Index slightly outperformed its value counterpart by 0.03%.

Sources: CAPS CompositeHubTM, Bloomberg
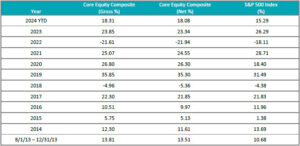
Past performance is not indicative of future results. Aristotle Atlantic Focus Growth Composite returns are presented gross and net of investment advisory fees and include the reinvestment of all income. Gross returns will be reduced by fees and other expenses that may be incurred in the management of the account. Net returns are presented net of actual investment advisory fees and after the deduction of all trading expenses. Aristotle Atlantic Composite returns are preliminary pending final account reconciliation. Please see important disclosures at the end of this document.

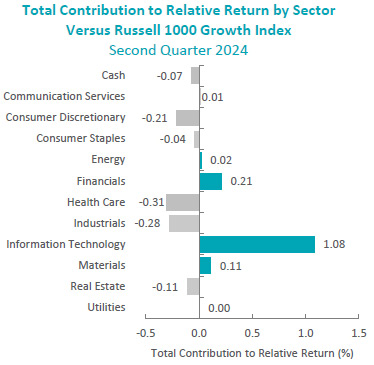
Declines were broad-based, as nine out of the eleven sectors within the Russell 1000 Growth Index finished lower. Utilities, Real Estate and Consumer Staples were the worst-performing sectors. Meanwhile, Energy and Communication Services were the only two sectors in the green, and Health Care declined the least.

Economic growth in the U.S. remained steady, as data released during the quarter showed real GDP increased at an annual rate of 2.1%. The increase was driven by higher levels of consumer and government spending, as well as nonresidential fixed investment. The labor market remained tight during the period, with a 3.8% unemployment rate in August, while average hourly earnings for all employees increased by 4.3% year-over-year.

There was an uptick in inflation reported during the quarter, as annualized CPI increased from 3.0% in June to 3.7% in August. In addition, oil hit its highest level of the year, with both WTI and Brent eclipsing $90 a barrel. Given the concerns about rebounding inflation, 10-year and 30-year Treasury yields spiked to their highest marks since 2007 and 2011, finishing the quarter at 4.59% and 4.73%, respectively. However, the broader trend of disinflation continues, as the 3.7% August CPI figure is still less than half the 8.3% increase the Index experienced the year prior.

After raising its benchmark federal funds rate to a range of 5.25% to 5.50% in July, the Federal Reserve (Fed) held interest rates steady in September, citing a solid pace of expanding economic activity, a slightly softer—yet still strong—labor market and tighter credit conditions. The Fed indicated that it would continue to monitor cumulative monetary policy, the lagged effects of policy decisions, and economic and financial developments when determining the extent of additional rate increases.

On the corporate earnings front, S&P 500 companies reported a 4.1% decline in earnings, the third straight quarter that saw a year-over-year decrease. Despite the drop, fewer companies discussed “recession” and “inflation” during the reporting period. Furthermore, aggregate earnings estimates for the third quarter increased by 0.4% (above the 10-year average of -3.4%), the first increase in nearly two years.

Performance and Attribution Summary

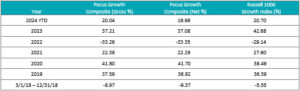
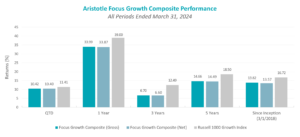
For the third quarter of 2023, Aristotle Atlantic’s Focus Growth Composite posted a total return of -5.51% gross of fees (-5.53% net of fees), underperforming the -3.13% total return of the Russell 1000 Growth Index.

Performance (%)3Q23YTD1 Year3 Years5 YearsSince Inception*
Focus Growth Composite (gross)-5.5119.2922.492.508.6210.32
Focus Growth Composite (net)-5.5319.2122.372.408.4110.07
Russell 1000 Growth Index-3.1324.9827.727.9712.4113.37
*The Focus Growth Composite has an inception date of March 1, 2018. Past performance is not indicative of future results. Aristotle Atlantic Focus Growth Composite returns are presented gross and net of investment advisory fees and include the reinvestment of all income. Gross returns will be reduced by fees and other expenses that may be incurred in the management of the account. Net returns are presented net of actual investment advisory fees and after the deduction of all trading expenses. Aristotle Atlantic Composite returns are preliminary pending final account reconciliation. Please see important disclosures at the end of this document.

Sources: FactSet
Past performance is not indicative of future results. Attribution results are based on sector returns which are gross of investment advisory fees. Attribution is based on performance that is gross of investment advisory fees and includes the reinvestment of income. Please see important disclosures at the end of this document.

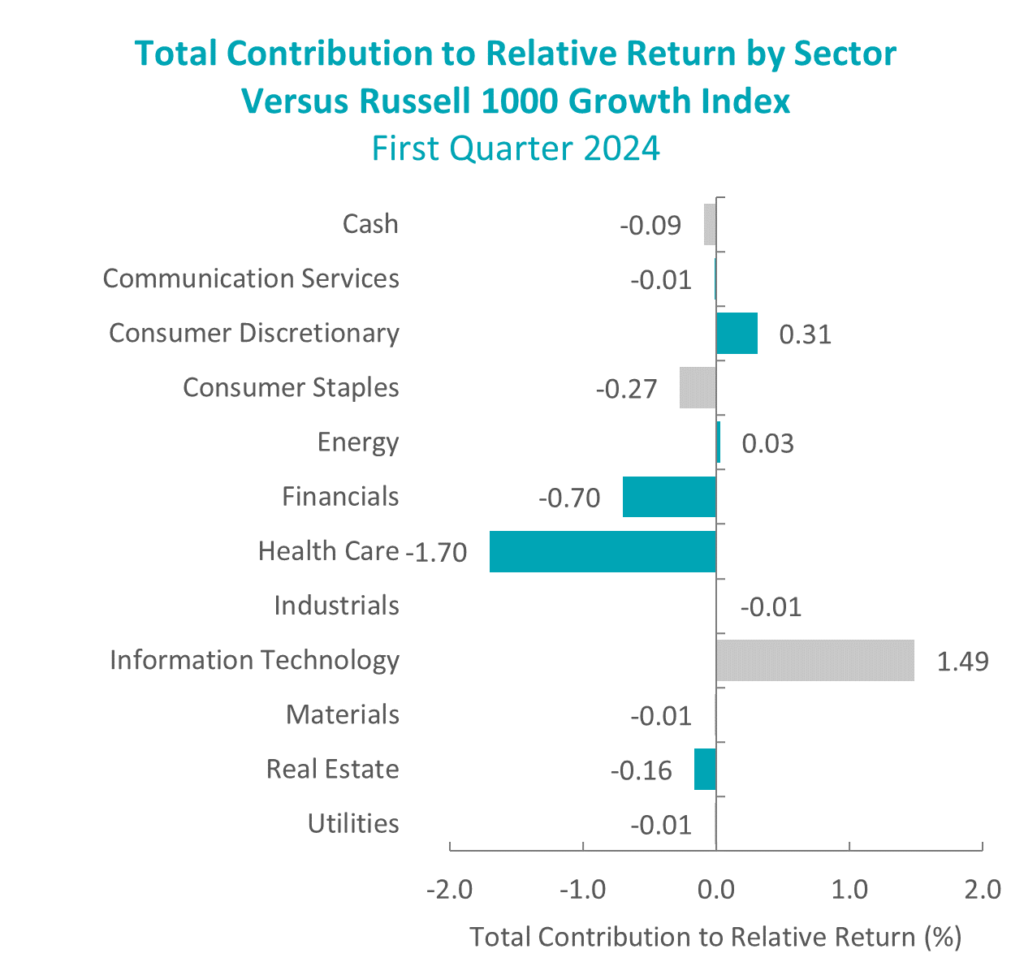
During the third quarter, the portfolio’s underperformance relative to the Russell 1000 Growth Index was due to both allocation effects and security selection. Security selection in Health Care, Financials and Industrials detracted the most from performance. Conversely, security selection in Information Technology and Real Estate, as well as an overweight in Financials, contributed to relative results.

Contributors and Detractors for 3Q 2023

Relative ContributorsRelative Detractors
AppleDexCom
SynopsysSage Therapeutics
Costco WholesaleDarling Ingredients
NvidiaIovance Biotherapeutics
ServiceNowBio-Techne

Contributors

Apple

Apple contributed to outperformance in the third quarter, as a result of the underweight position relative to the benchmark.  Following a very strong first-half performance, the stock saw a pullback ahead of the iPhone 15 launch, as investors weigh the potential growth from the new phone in the face of macroeconomic headwinds and slowing consumer spend.

Synopsys

Synopsys contributed to performance in the quarter as the company reported third quarter revenues that were above consensus, additionally the company raised fiscal year guidance for 2023. Synopsys continues to be a key beneficiary from the demand for semiconductors throughout the entire economy, as well as the increasing complexity of semiconductor design, particularly for silicon used in the artificial intelligence (AI) technology stack.  The company is also leveraging AI for its design tools which can drive increased usage and improve margins for the company’s tools. 

Detractors

DexCom

DexCom shares were weaker in the third quarter following Novo Nordisk’s announcement of topline data from the SELECT trial on cardiovascular outcomes on patients using their weight loss drug Wegovy on August 8th.  The trial showed a 20% reduction in major adverse cardiovascular events in patients using the drug.  This led to broad-based pressure on companies in the diabetes space, as well as those exposed to other weight-related maladies.  The weakness came despite DexCom reporting 26% organic growth and raising full-year guidance in late July.  We continue to see continuous glucose monitoring devices playing an important role in driving better health outcomes for diabetes patients and believe that given the low penetration rates, DexCom can continue to grow. 

Darling Ingredients

Darling Ingredients shares were weak in the third quarter after the company reported an inline quarter and reaffirmed guidance for the fourth quarter. Diamond Green Diesel had a planned downtime in July when an unexpected fire resulted in 10 days of no production in Norco Los Angeles later in the quarter. Higher interest rates this month pressured companies with outsized leverage, such as Darling Ingredients, and they are working on deleveraging following several acquisitions last year.    

Recent Portfolio Activity

The table below shows all buys and sells completed during the quarter, followed by a brief rationale.

BuysSells
Adobe Crowdstrike Holdings
Meta Platforms NXP Semiconductors
Sage Therapeutics
Iovance Biotechnologies

Buys

Adobe

Adobe is one of the largest and most diversified software companies in the world. It has been known for brands such as Acrobat, Photoshop and Adobe Document Cloud. Adobe’s business is organized into three reportable segments: Digital Media, Digital Experience, and Publishing and Advertising. The Company’s products allow users to express and use information across all print and electronic media.

We see Adobe as a key enabler of digital transformation initiatives through the Digital Media and Digital Experience business segments. Adobe continues to innovate and integrate new capabilities across all its product suites. We see several products per customer continuing to increase, as Adobe users continue to use more products.  We see this as a competitive advantage.

Meta Platforms

Meta Platforms, formerly known as Facebook, is a global technology company specializing in social networking and the development of augmented and virtual reality technologies. Founded in 2004 and headquartered in Menlo Park, CA, the company has expanded its reach to nearly three billion monthly active users worldwide.

We see Meta as well-positioned to capture a significant share of the rapidly growing digital advertising market and has created an interconnected ecosystem of apps that drives higher user engagements. While leveraging AI and machine learning technology, Meta should see an acceleration in the development of targeted digital advertising capabilities and enhance the user experience across its platform. We see near-term catalysts in Rising Reels and Messenger revenue monetization and an expected robust 2024 political and Olympic advertising. Year-to-date, investors have been optimistic about the company’s pivot away from a focus on metaverse investments to an emphasis on profitability and growth in what the company calls its “Year of Efficiency.”

Sells

CrowdStrike Holdings

We sold CrowdStrike Holdings and believe that recent channel checks and commentary from competitors and software companies indicate increasing headwinds across multiple industry verticals. We also believe that macroeconomic conditions and high interest rates are resulting in shorter contract cycles which also represent headwinds to Free Cash Flow growth.  While the company continues to be an industry leader in endpoint detection, we view a potential slowdown.

NXP Semiconductors

We sold NXP Semiconductors to reduce our exposure to the automotive sector in semiconductors following the strong returns over the past 3 years.  We are seeing early data of slowing global auto sales due to macroeconomic conditions and higher interest rates.  While we think this may be a shorter-term slowdown, the risk is increasing of elevated inventory levels and pricing headwinds.

Sage Therapeutics

We sold Sage Therapeutics following results of the company’s new drug application for Zuranalone that was approved in Post Partem Depression (PPD), but not major depressive disorder (MDD).  The complete response letter (CRL) on MDD stated that the company would need to complete additional trials to prove the efficacy and durability in MDD, so they are evaluating next steps along with Biogen.  Sage was unable to say how committed they or Biogen would be to funding additional studies at this point.  Given the uncertainty surrounding the company, we decided to exit the position.

Iovance Biotherapeutics

We sold Iovance Biotherapeutics, following uncertainty which arose from the company canceling out of two investor events.  Iovance is in the late stages of FDA review on their lead candidate Lifileucel in advanced melanoma. These cancellations could stem from issues with site inspections which tend to take place later in the review cycle.  The company has not commented on why it canceled these investor events, and we do not think this bodes well for the prospects of a straightforward approval with a clean, positive label for the company.

Outlook

The equity markets in the third quarter were negatively impacted by a steep rise in interest rates. The move in interest rates reflects the outlook that the Fed will have to keep rates higher for longer to get inflation under control. Rising oil prices did not help the inflation outlook but did result in pushing the Energy sector into positive territory and making the sector the best performer for the period. The consumer is now facing higher gasoline prices at the pump, and those with student loans are now faced with renewed interest payments due to the failed attempt to forgive student debt. This has resulted in an increased probability of slower economic growth due to these challenges. The one bright spot continues to be the strong backlog of orders in the industrial segment of the economy. We have yet to see a material benefit from the recently passed legislative packages that could extend and add to these backlogs. We are now entering a period where the economy should show signs of slowing given the duration and severity of rate hikes on the part of the Fed. The equity markets may very well welcome bad economic news as a sign that the rate cycle is finally coming to an end. Our focus will continue to be at the company level, with an emphasis on seeking to invest in companies with secular tailwinds or strong product-driven cycles.

Disclosures

The opinions expressed herein are those of Aristotle Atlantic Partners, LLC (Aristotle Atlantic) and are subject to change without notice. Past performance is not a guarantee or indicator of future results. This material is not financial advice or an offer to purchase or sell any product. You should not assume that any of the securities transactions, sectors or holdings discussed in this report were or will be profitable, or that recommendations Aristotle Atlantic makes in the future will be profitable or equal the performance of the listed in this report. The portfolio characteristics shown relate to the Aristotle Atlantic Focus Growth strategy. Not every client’s account will have these characteristics. Aristotle Atlantic reserves the right to modify its current investment strategies and techniques based on changing market dynamics or client needs. There is no assurance that any securities discussed herein will remain in an account’s portfolio at the time you receive this report or that securities sold have not been repurchased. The securities discussed may not represent an account’s entire portfolio and, in the aggregate, may represent only a small percentage of an account’s portfolio holdings. The performance attribution presented is of a representative account from Aristotle Atlantic’s Focus Growth Composite. The representative account is a discretionary client account which was chosen to most closely reflect the investment style of the strategy. The criteria used for representative account selection is based on the account’s period of time under management and its similarity of holdings in relation to the strategy. Recommendations made in the last 12 months are available upon request. Returns are presented gross and net of investment advisory fees and include the reinvestment of all income. Gross returns will be reduced by fees and other expenses that may be incurred in the management of the account. Net returns are presented net of actual investment advisory fees and after the deduction of all trading expenses.

All investments carry a certain degree of risk, including the possible loss of principal. Investments are also subject to political, market, currency and regulatory risks or economic developments. International investments involve special risks that may in particular cause a loss in principal, including currency fluctuation, lower liquidity, different accounting methods and economic and political systems, and higher transaction costs. These risks typically are greater in emerging markets. Securities of small‐ and medium‐sized companies tend to have a shorter history of operations, be more volatile and less liquid. Value stocks can perform differently from the market as a whole and other types of stocks.

The material is provided for informational and/or educational purposes only and is not intended to be and should not be construed as investment, legal or tax advice and/or a legal opinion. Investors should consult their financial and tax adviser before making investments. The opinions referenced are as of the date of publication, may be modified due to changes in the market or economic conditions, and may not necessarily come to pass. Information and data presented has been developed internally and/or obtained from sources believed to be reliable. Aristotle Atlantic does not guarantee the accuracy, adequacy or completeness of such information.

Aristotle Atlantic Partners, LLC is an independent registered investment adviser under the Advisers Act of 1940, as amended. Registration does not imply a certain level of skill or training. More information about Aristotle Atlantic, including our investment strategies, fees and objectives, can be found in our Form ADV Part 2, which is available upon request.  AAP-2310-34

Performance Disclosures

Sources: CAPS Composite Hub, Russell Investments

Composite returns for all periods ended September 30, 2023 are preliminary pending final account reconciliation.

Past performance is not indicative of future results. Performance results for periods greater than one year have been annualized. Returns are presented gross and net of investment advisory fees and include the reinvestment of all income. Gross returns will be reduced by fees and other expenses that may be incurred in the management of the account. Net returns are presented net of actual investment advisory fees and after the deduction of all trading expenses.

Index Disclosures

The Russell 1000® Growth Index measures the performance of the large cap growth segment of the U.S. equity universe. It includes those Russell 1000 companies with higher price-to-book ratios and higher forecasted growth values. This index has been selected as the benchmark and is used for comparison purposes only. The Russell 1000® Value Index measures the performance of the large cap value segment of the U.S. equity universe. It includes those Russell 1000 companies with lower price-to-book ratios and lower expected growth values. The S&P 500® Index is the Standard & Poor’s Composite Index of 500 stocks and is a widely recognized, unmanaged index of common stock prices. The Russell 2000® Index measures the performance of the small cap segment of the U.S. equity universe. The Russell 2000 Index is a subset of the Russell 3000® Index representing approximately 10% of the total market capitalization of that index. It includes approximately 2,000 of the smallest securities based on a combination of their market cap and current index membership. The Dow Jones Industrial Average® is a price-weighted measure of 30 U.S. blue-chip companies. The Index covers all industries except transportation and utilities. The NASDAQ Composite Index measures all NASDAQ domestic and international based common type stocks listed on The NASDAQ Stock Market. The NASDAQ Composite includes over 3,000 companies, more than most other stock market indices. The Bloomberg U.S. Aggregate Bond Index is an unmanaged index of domestic investment grade bonds, including corporate, government and mortgage-backed securities. The WTI Crude Oil Index is a major trading classification of sweet light crude oil that serves as a major benchmark price for oil consumed in the United States. The 3-Month U.S. Treasury Bill is a short-term debt obligation backed by the U.S. Treasury Department with a maturity of three months.  The Consumer Price Index (CPI) is a measure of the average change over time in the prices paid by urban consumers for a market basket of consumer goods and services. While stock selection is not governed by quantitative rules, a stock typically is added only if the company has an excellent reputation, demonstrates sustained growth and is of interest to a large number of investors. The volatility (beta) of the Composite may be greater or less than its respective benchmarks. It is not possible to invest directly in these indices.

Markets Review

After three consecutive positive quarters, the U.S. equity market pulled back, as the S&P 500 Index declined 3.27% during the quarter. Concurrently, the Bloomberg U.S. Aggregate Bond Index also fell, dropping 3.23% for the quarter. In terms of style, the Russell 1000 Growth Index slightly outperformed its value counterpart by 0.03%.

Sources: CAPS CompositeHubTM, Bloomberg
Past performance is not indicative of future results. Aristotle Atlantic Large Cap Growth Composite returns are presented gross and net of investment advisory fees and include the reinvestment of all income. Gross returns will be reduced by fees and other expenses that may be incurred in the management of the account. Net returns are presented net of actual investment advisory fees and after the deduction of all trading expenses. Aristotle Atlantic Composite returns are preliminary pending final account reconciliation. Please see important disclosures at the end of this document.

Declines were broad-based, as nine out of the eleven sectors within the Russell 1000 Growth Index finished lower. Utilities, Real Estate and Consumer Staples were the worst-performing sectors. Meanwhile, Energy and Communication Services were the only two sectors in the green, and Health Care declined the least.

Economic growth in the U.S. remained steady, as data released during the quarter showed real GDP increased at an annual rate of 2.1%. The increase was driven by higher levels of consumer and government spending, as well as nonresidential fixed investment. The labor market remained tight during the period, with a 3.8% unemployment rate in August, while average hourly earnings for all employees increased by 4.3% year-over-year.

There was an uptick in inflation reported during the quarter, as annualized CPI increased from 3.0% in June to 3.7% in August. In addition, oil hit its highest level of the year, with both WTI and Brent eclipsing $90 a barrel. Given the concerns about rebounding inflation, 10-year and 30-year Treasury yields spiked to their highest marks since 2007 and 2011, finishing the quarter at 4.59% and 4.73%, respectively. However, the broader trend of disinflation continues, as the 3.7% August CPI figure is still less than half the 8.3% increase the Index experienced the year prior.

After raising its benchmark federal funds rate to a range of 5.25% to 5.50% in July, the Federal Reserve (Fed) held interest rates steady in September, citing a solid pace of expanding economic activity, a slightly softer—yet still strong—labor market and tighter credit conditions. The Fed indicated that it would continue to monitor cumulative monetary policy, the lagged effects of policy decisions, and economic and financial developments when determining the extent of additional rate increases.

On the corporate earnings front, S&P 500 companies reported a 4.1% decline in earnings, the third straight quarter that saw a year-over-year decrease. Despite the drop, fewer companies discussed “recession” and “inflation” during the reporting period. Furthermore, aggregate earnings estimates for the third quarter increased by 0.4% (above the 10-year average of -3.4%), the first increase in nearly two years.

Performance and Attribution Summary

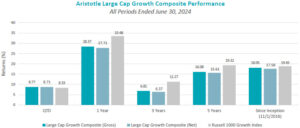
For the third quarter of 2023, Aristotle Atlantic’s Large Cap Growth Composite posted a total return of -5.34% gross of fees
(-5.51% net of fees), underperforming the -3.13% return of the Russell 1000 Growth Index.

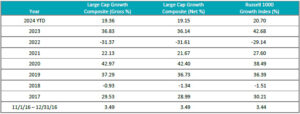
Performance (%) 3Q23YTD1 Year3 Years5 YearsSince Inception*
Large Cap Growth Composite (gross)-5.3420.4423.284.2310.2515.01
Large Cap Growth Composite (net)-5.5120.0222.743.829.8114.56
Russell 1000 Growth Index-3.1324.9827.727.9712.4116.24

*The Large Cap Growth Composite has an inception date of November 1, 2016. Past performance is not indicative of future results. Aristotle Atlantic Large Cap Growth Equity Composite returns are presented gross and net of investment advisory fees and include the reinvestment of all income. Gross returns will be reduced by fees and other expenses that may be incurred in the management of the account. Net returns are presented net of actual investment advisory fees and after the deduction of all trading expenses. Aristotle Atlantic Composite returns are preliminary pending final account reconciliation. Please see important disclosures at the end of this document.

Sources: FactSet
Past performance is not indicative of future results. Attribution results are based on sector returns which are gross of investment advisory fees. Attribution is based on performance that is gross of investment advisory fees and includes the reinvestment of income. Please see important disclosures at the end of this document.

During the third quarter, the portfolio’s underperformance relative to the Russell 1000 Growth Index was due to both security selection and allocation effects. Security selection in Health Care, Industrials and Financials detracted the most from relative performance. Conversely, security selection in Information Technology and Real Estate, as well as an overweight in Health Care contributed to relative returns.

Contributors and Detractors for 3Q 2023

Relative ContributorsRelative Detractors
SynopsysSage Therapeutics
AppleDexCom
NvidiaDarling Ingredients
Chart Industries Bio-Techne
UnitedHealth GroupIovance Biotherapeutics

Contributors

Synopsys

Synopsys contributed to performance in the quarter as the company reported third quarter revenues that were above consensus, additionally the company raised fiscal year guidance for 2023. Synopsys continues to be a key beneficiary from the demand for semiconductors throughout the entire economy, as well as the increasing complexity of semiconductor design, particularly for silicon used in the aritifical intelligence (AI) technology stack.  The company is also leveraging AI for its design tools which can drive increased usage and improve margins for the company’s tools.

Apple

Apple contributed to outperformance in the third quarter, as a result of the underweight position relative to the benchmark.  Following a very strong first-half performance, the stock saw a pullback ahead of the iPhone 15 launch, as investors weigh the potential growth from the new phone in the face of macroeconomic headwinds and slowing consumer spend. 

Detractors

DexCom

DexCom shares were weaker in the third quarter following Novo Nordisk’s announcement of topline data from the SELECT trial on cardiovascular outcomes on patients using their weight loss drug Wegovy on August 8th.  The trial showed a 20% reduction in major adverse cardiovascular events in patients using the drug.  This led to broad-based pressure on companies in the diabetes space, as well as those exposed to other weight-related maladies. The weakness came despite DexCom reporting 26% organic growth and raising full-year guidance in late July.  We continue to see continuous glucose monitoring devices playing an important role in driving better health outcomes for diabetes patients and believe that given the low penetration rates, DexCom can continue to grow. 

Darling Ingredients

Darling Ingredients shares were weak in the third quarter after the company reported an inline quarter and reaffirmed guidance for the fourth quarter. Diamond Green Diesel had a planned downtime in July when an unexpected fire resulted in 10 days of no production in Norco Los Angeles later in the quarter. Higher interest rates this month pressured companies with outsized leverage, such as Darling Ingredients, and they are working on deleveraging following several acquisitions last year. 

Recent Portfolio Activity

The table below shows all buys and sells completed during the quarter, followed by a brief rationale.

BuysSells
Meta PlatformsAmeriprise Financial
AdobeCrowdstrike Holdings
Uber TechnologiesNXP Semiconductors
Sage Therapeutics
Iovance Biotherapeutics

Buys

Meta Platforms

Meta Platforms, formerly known as Facebook, is a global technology company specializing in social networking and the development of augmented and virtual reality technologies. Founded in 2004 and headquartered in Menlo Park, CA, the company has expanded its reach to nearly three billion monthly active users worldwide.

We see Meta as well-positioned to capture a significant share of the rapidly growing digital advertising market and has created an interconnected ecosystem of apps that drives higher user engagements. While leveraging AI and machine learning technology, Meta should see an acceleration in the development of targeted digital advertising capabilities and enhance the user experience across its platform. We see near-term catalysts in Rising Reels and Messenger revenue monetization and an expected robust 2024 political and Olympic advertising. Year-to-date, investors have been optimistic about the company’s pivot away from a focus on metaverse investments to an emphasis on profitability and growth in what the company calls its “Year of Efficiency.”

Adobe

Adobe is one of the largest and most diversified software companies in the world. It has been known for brands such as Acrobat, Photoshop and Adobe Document Cloud. Adobe’s business is organized into three reportable segments: Digital Media, Digital Experience, and Publishing and Advertising. The Company’s products allow users to express and use information across all print and electronic media.

We see Adobe as a key enabler of digital transformation initiatives through the Digital Media and Digital Experience business segments. Adobe continues to innovate and integrate new capabilities across all its product suites. We see several products per customer continuing to increase, as Adobe users continue to use more products. We see this as a competitive advantage.

Uber Technologies

Uber Technologies develops and operates proprietary technology applications. The company operates through three segments: Mobility, Delivery and Freight. The Company develops and operates proprietary technology applications supporting a variety of offerings on its platform.

We see the company as the global leader in ride-hailing and one of the few delivery app companies with a strong network effect for both businesses. Uber is experiencing strong revenue growth as adoption and frequency of usage continue to grow in both segments. We expect the company will also benefit from more demand due to the higher frequency of workers attending work in the office, rather than working from their homes. We look for revenue growth as the adoption of Uber’s services increases and the company expands globally.

Sells

Ameriprise Financial

We sold our position in Ameriprise Financial out of the Large Cap Growth strategy to fund our initiation of Meta Platforms. We continue to believe Amerprise’s continued mix-shift to its higher-growth, higher-margin and less capital-intensive Advice & Wealth Management business will increase shareholder value over time; however, META offers a more attractive risk-reward opportunity currently, in our view. In addition, Ameriprise Financial continues to face the near-term headwinds that sustained high-interest rates have on its securities portfolio and customer cash-sorting activity.

CrowdStrike Holdings

We sold CrowdStrike Holdings and believe that recent channel checks and commentary from competitors and software companies indicate increasing headwinds across multiple industry verticals. We also believe that macroeconomic conditions and high interest rates are resulting in shorter contract cycles which also represent headwinds to Free Cash Flow growth.  While the company continues to be an industry leader in endpoint detection, we view a potential slowdown.

NXP Semiconductors

We sold NXP Semiconductors to reduce our exposure to the automotive sector in semiconductors following the strong returns over the past 3 years.  We are seeing early data of slowing global auto sales due to macroeconomic conditions and higher interest rates.  While we think this may be a shorter-term slowdown, the risk is increasing of elevated inventory levels and pricing headwinds.

Sage Therapeutics

We sold Sage Therapeutics following results of the company’s new drug application for Zuranalone that was approved in Post Partem Depression (PPD), but not major depressive disorder (MDD).  The complete response letter (CRL) on MDD stated that the company would need to complete additional trials to prove the efficacy and durability in MDD, so they are evaluating next steps along with Biogen.  Sage was unable to say how committed they or Biogen would be to funding additional studies at this point.  Given the uncertainty surrounding the company, we decided to exit the position.

Iovance Biotherapeutics

We sold Iovance Biotherapeutics following uncertainty which arose from the company canceling out of two investor events.  Iovance is in the late stages of FDA review on their lead candidate Lifileucel in advanced melanoma. These cancellations could stem from issues with site inspections which tend to take place later in the review cycle.  The company has not commented on why it canceled these investor events, and we do not think this bodes well for the prospects of a straightforward approval with a clean, positive label for the company.

Outlook

The equity markets in the third quarter were negatively impacted by a steep rise in interest rates. The move in interest rates reflects the outlook that the Fed will have to keep rates higher for longer to get inflation under control. Rising oil prices did not help the inflation outlook but did result in pushing the Energy sector into positive territory and making the sector the best performer for the period. The consumer is now facing higher gasoline prices at the pump, and those with student loans are now faced with renewed interest payments due to the failed attempt to forgive student debt. This has resulted in an increased probability of slower economic growth due to these challenges. The one bright spot continues to be the strong backlog of orders in the industrial segment of the economy. We have yet to see a material benefit from the recently passed legislative packages that could extend and add to these backlogs. We are now entering a period where the economy should show signs of slowing given the duration and severity of rate hikes on the part of the Fed. The equity markets may very well welcome bad economic news as a sign that the rate cycle is finally coming to an end. Our focus will continue to be at the company level, with an emphasis on seeking to invest in companies with secular tailwinds or strong product-driven cycles.

Disclosures

The opinions expressed herein are those of Aristotle Atlantic Partners, LLC (Aristotle Atlantic) and are subject to change without notice. Past performance is not a guarantee or indicator of future results. This material is not financial advice or an offer to purchase or sell any product. You should not assume that any of the securities transactions, sectors or holdings discussed in this report were or will be profitable, or that recommendations Aristotle Atlantic makes in the future will be profitable or equal the performance of the securities listed in this report. The portfolio characteristics shown relate to the Aristotle Atlantic Large Cap Growth strategy. Not every client’s account will have these characteristics. Aristotle Atlantic reserves the right to modify its current investment strategies and techniques based on changing market dynamics or client needs. There is no assurance that any securities discussed herein will remain in an account’s portfolio at the time you receive this report or that securities sold have not been repurchased. The securities discussed may not represent an account’s entire portfolio and, in the aggregate, may represent only a small percentage of an account’s portfolio holdings. The performance attribution presented is of a representative account from Aristotle Atlantic’s Large Cap Growth Composite. The representative account is a discretionary client account which was chosen to most closely reflect the investment style of the strategy. The criteria used for representative account selection is based on the account’s period of time under management and its similarity of holdings in relation to the strategy. Recommendations made in the last 12 months are available upon request. Returns are presented gross and net of investment advisory fees and include the reinvestment of all income. Gross returns will be reduced by fees and other expenses that may be incurred in the management of the account. Net returns are presented net of actual investment advisory fees and after the deduction of all trading expenses.

All investments carry a certain degree of risk, including the possible loss of principal. Investments are also subject to political, market, currency and regulatory risks or economic developments. International investments involve special risks that may in particular cause a loss in principal, including currency fluctuation, lower liquidity, different accounting methods and economic and political systems, and higher transaction costs. These risks typically are greater in emerging markets. Securities of small‐ and medium‐sized companies tend to have a shorter history of operations, be more volatile and less liquid. Value stocks can perform differently from the market as a whole and other types of stocks.

The material is provided for informational and/or educational purposes only and is not intended to be and should not be construed as investment, legal or tax advice and/or a legal opinion. Investors should consult their financial and tax adviser before making investments. The opinions referenced are as of the date of publication, may be modified due to changes in the market or economic conditions, and may not necessarily come to pass. Information and data presented has been developed internally and/or obtained from sources believed to be reliable. Aristotle Atlantic does not guarantee the accuracy, adequacy or completeness of such information.

Aristotle Atlantic Partners, LLC is an independent registered investment adviser under the Advisers Act of 1940, as amended. Registration does not imply a certain level of skill or training. More information about Aristotle Atlantic, including our investment strategies, fees and objectives, can be found in our Form ADV Part 2, which is available upon request. AAP-2310-31

Performance Disclosure

Sources: CAPS Composite Hub, Russell Investments

Composite returns for all periods ended September 30, 2023 are preliminary pending final account reconciliation.

Past performance is not indicative of future results. Performance results for periods greater than one year have been annualized. Returns are presented gross and net of investment advisory fees and include the reinvestment of all income. Gross returns will be reduced by fees and other expenses that may be incurred in the management of the account. Net returns are presented net of actual investment advisory fees and after the deduction of all trading expenses.

Index Disclosure

The Russell 1000® Growth Index measures the performance of the large cap growth segment of the U.S. equity universe. It includes those Russell 1000 companies with higher price-to-book ratios and higher forecasted growth values. This index has been selected as the benchmark and is used for comparison purposes only. The Russell 1000® Value Index measures the performance of the large cap value segment of the U.S. equity universe. It includes those Russell 1000 companies with lower price-to-book ratios and lower expected growth values. The S&P 500® Index is the Standard & Poor’s Composite Index of 500 stocks and is a widely recognized, unmanaged index of common stock prices. The Dow Jones Industrial Average® is a price-weighted measure of 30 U.S. blue-chip companies. The Index covers all industries except transportation and utilities. The NASDAQ Composite Index measures all NASDAQ domestic and international based common type stocks listed on The NASDAQ Stock Market. The NASDAQ Composite includes over 3,000 companies, more than most other stock market indices. The Bloomberg U.S. Aggregate Bond Index is an unmanaged index of domestic investment grade bonds, including corporate, government and mortgage-backed securities. The WTI Crude Oil Index is a major trading classification of sweet light crude oil that serves as a major benchmark price for oil consumed in the United States. The Brent Crude Oil Index is a major trading classification of sweet light crude oil that serves as a major benchmark price for purchases of oil worldwide. The 3-Month U.S. Treasury Bill is a short-term debt obligation backed by the U.S. Treasury Department with a maturity of three months.  The Consumer Price Index (CPI) is a measure of the average change over time in the prices paid by urban consumers for a market basket of consumer goods and services. While stock selection is not governed by quantitative rules, a stock typically is added only if the company has an excellent reputation, demonstrates sustained growth and is of interest to a large number of investors. The volatility (beta) of the Composite may be greater or less than its respective benchmarks. It is not possible to invest directly in these indices.

Markets Review

After three consecutive positive quarters, the U.S. equity market pulled back, as the S&P 500 Index declined 3.27% during the quarter. Concurrently, the Bloomberg U.S. Aggregate Bond Index also fell, dropping 3.23% for the quarter. In terms of style, the Russell 1000 Growth Index slightly outperformed its value counterpart by 0.03%

Declines were broad-based, as nine out of the eleven sectors within the S&P 500 Index finished lower for the quarter. Utilities, Real Estate and Consumer Staples were the worst-performing sectors. Meanwhile, Energy and Communication services were the only two sectors in the green, and Financials declined the least.

Sources: CAPS CompositeHubTM, Bloomberg
Past performance is not indicative of future results. Aristotle Atlantic Core Equity Composite returns are presented gross and net of investment advisory fees and include the reinvestment of all income. Gross returns will be reduced by fees and other expenses that may be incurred in the management of the account. Net returns are presented net of actual investment advisory fees and after the deduction of all trading expenses. Aristotle Atlantic Composite returns are preliminary pending final account reconciliation. Please see important disclosures at the end of this document.

Economic growth in the U.S. remained steady, as data released during the quarter showed real GDP increased at an annual rate of 2.1%. The increase was driven by higher levels of consumer and government spending, as well as nonresidential fixed investment. The labor market remained tight during the period, with a 3.8% unemployment rate in August, while average hourly earnings for all employees increased by 4.3% year-over-year.

There was an uptick in inflation reported during the quarter, as annualized CPI increased from 3.0% in June to 3.7% in August. In addition, oil hit its highest level of the year, with both WTI and Brent eclipsing $90 a barrel. Given the concerns about rebounding inflation, 10-year and 30-year Treasury yields spiked to their highest marks since 2007 and 2011, finishing the quarter at 4.59% and 4.73%, respectively. However, the broader trend of disinflation continues, as the 3.7% August CPI figure is still less than half the 8.3% increase the Index experienced the year prior.

After raising its benchmark federal funds rate to a range of 5.25% to 5.50% in July, the Federal Reserve (Fed) held interest rates steady in September, citing a solid pace of expanding economic activity, a slightly softer—yet still strong—labor market and tighter credit conditions. The Fed indicated that it would continue to monitor cumulative monetary policy, the lagged effects of policy decisions, and economic and financial developments when determining the extent of additional rate increases.

On the corporate earnings front, S&P 500 companies reported a 4.1% decline in earnings, the third straight quarter that saw a year-over-year decrease. Despite the drop, fewer companies discussed “recession” and “inflation” during the reporting period. Furthermore, aggregate earnings estimates for the third quarter increased by 0.4% (above the 10-year average of -3.4%), the first increase in nearly two years.

Performance and Attribution Summary

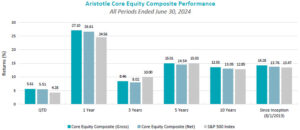
For the third quarter of 2023, Aristotle Atlantic’s Core Equity Composite posted a total return of -4.87 % gross of fees (-4.98% net of fees), underperforming the S&P 500 Index, which recorded a total return of -3.27%.

Performance (%) 3Q23YTD1 Year3 Years5 Years7 YearsSince Inception*
Core Equity Composite (gross)-4.879.6517.377.139.2012.1712.17
Core Equity Composite (net)-4.989.3016.876.688.7511.6511.65
S&P 500 Index-3.2713.0721.6210.159.9111.9111.72
*The Core Equity Composite has an inception date of August 1, 2013. Past performance is not indicative of future results. Aristotle Atlantic Core Equity Composite returns are presented gross and net of investment advisory fees and include the reinvestment of all income. Gross returns will be reduced by fees and other expenses that may be incurred in the management of the account. Net returns are presented net of actual investment advisory fees and after the deduction of all trading expenses. Aristotle Atlantic Composite returns are preliminary pending final account reconciliation. Please see important disclosures at the end of this document.

Source: FactSet
Past performance is not indicative of future results. Attribution results are based on sector returns which are gross of investment advisory fees. Attribution is based on performance that is gross of investment advisory fees and includes the reinvestment of income. Please see important disclosures at the end of this document.

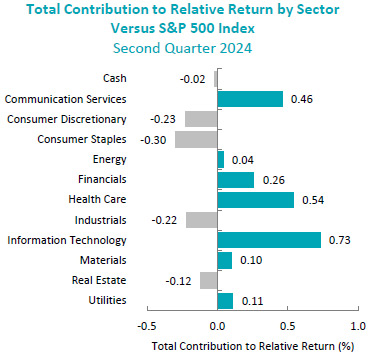
During the third quarter, the portfolio’s underperformance relative to the S&P 500 Index was due to both security selection and allocation effects. Security selection in Health Care, Consumer Staples and Industrials detracted the most from relative performance. Conversely, security selection in Materials, Financials and Communication Services contributed to relative performance.

Contributors and Detractors for 3Q 2023

Relative ContributorsRelative Detractors
HalliburtonDarling Ingredients
ChubbSpirit AeroSystems
Avery DennisonBio-Techne
Marriott InternationalDollar General
Trane TechnologiesTeleflex

Contributors

Halliburton

Halliburton contributed to outperformance in the quarter. The company continues to benefit from higher commodity prices, with both oil and natural gas prices increasing due to supply concerns, as well as improving supply-demand fundamentals in 2024. Investors are focusing on the upside growth benefits to the company in 2024, as North American oil and gas producers begin to increase rig counts, and international oil companies (IOCs) and national oil companies (NOCs) continue to increase their spending on mega projects. Halliburton should see a reacceleration in topline growth and improved margins as the result of the company’s focus over the last few years on higher-margin tools and technology offerings.

Chubb

Chubb contributed to outperformance due to sustained momentum across business units and global regions, a favorable property and casualty (P&C) rate environment and an attractive valuation with shares trading below historical averages. The company’s earnings report early in the quarter highlighted its underwriting and risk-assessment capabilities, with management projecting a continuation of what we believe are positive pricing trends through the remainder of this year. 

Detractors

Darling Ingredients

Darling Ingredients shares were weak in the third quarter after the company reported an inline quarter and reaffirmed guidance for the fourth quarter. Diamond Green Diesel had a planned downtime in July when an unexpected fire resulted in 10 days of no production in Norco Los Angeles later in the quarter. Higher interest rates this month pressured companies with outsized leverage, such as Darling Ingredients, and they are working on deleveraging following several acquisitions last year. 

Spirit AeroSystems

Spirit AeroSystems underperformed in the third quarter. The company reported disappointing earnings in August. Additionally, the company reported its second manufacturing quality issue on its most important aircraft program, the 737 MAX which should result in additional costs to the company and a delay in revenue recognition on the program. The company is also experiencing manufacturing issues on the Boeing 787, Airbus A220 and A350 that need to be resolved with Boeing and Airbus, respectively.  After the end of the quarter, the CEO was replaced, which we view as a positive development.

Recent Portfolio Activity

The table below shows all buys and sells completed during the quarter, followed by a brief rationale.

BuysSells
OracleMicrochip Technology
Meta PlatformsDollar General

Buys

Oracle

Oracle provides products and services that address enterprise information technology (IT) environments. The company’s products and services include enterprise applications and infrastructure offerings that are delivered worldwide through a variety of flexible and interoperable IT deployment models. The company operates in three segments: cloud and license business, hardware, and services.

We believe Oracle’s cloud infrastructure product, OCI 2.0, continues to demonstrate strong revenue growth over several quarters. Additionally, we see the rapid growth of artificial intelligence (AI) computing needs as being a differentiated growth driver for Oracle. We believe that Oracle will continue to drive positive outcomes for the Cerner business through a better margin structure, as well as topline sales synergies.

Meta Platforms

Meta Platforms, formerly known as Facebook, is a global technology company specializing in social networking and the development of augmented and virtual reality technologies. Founded in 2004 and headquartered in Menlo Park, CA, the company has expanded its reach to nearly three billion monthly active users worldwide.

We see Meta as well-positioned to capture a significant share of the rapidly growing digital advertising market and has created an interconnected ecosystem of apps that drives higher user engagements. While leveraging AI and machine learning technology, Meta should see an acceleration in the development of targeted digital advertising capabilities and enhance the user experience across its platform. We see near-term catalysts in Rising Reels and Messenger revenue monetization and an expected robust 2024 political and Olympic advertising. Year-to-date, investors have been optimistic about the company’s pivot away from a focus on metaverse investments to an emphasis on profitability and growth in what the company calls its “Year of Efficiency.”

Sells

Microchip Technology

We sold Microchip Technology and moved to an equal weight in the semiconductor subsector. We expect to see a couple more quarters of volatility in many of the end markets that the company sells into and expect inventory levels to remain elevated, forcing lower sell-through than expected. 

Dollar General

We sold Dollar General following the company’s earnings report where same-store sales fell 0.1%, which was below expectations. The company cited the deteriorating macro environment affecting an already challenged consumer, including an unanticipated impact from reductions in federal food stamp programs (SNAP) and lower tax refunds. The company lowered its full-year guidance, as the company continues to invest in price, wages and supply chain initiatives. The shifting mix towards lower-margin consumables versus higher-margin discretionary items in store continues to hamper margins. Comparable sales are expected to be negative in the third quarter and improving in the fourth quarter on easing comparisons. Given Dollar General’s commitment to investing in growth initiatives, margin recovery could be delayed versus management’s plans.

Outlook

The equity markets in the third quarter were negatively impacted by a steep rise in interest rates. The move in interest rates reflects the outlook that the Fed will have to keep rates higher for longer to get inflation under control. Rising oil prices did not help the inflation outlook but did result in pushing the Energy sector into positive territory and making the sector the best performer for the period. The consumer is now facing higher gasoline prices at the pump, and those with student loans are now faced with renewed interest payments due to the failed attempt to forgive student debt. This has resulted in an increased probability of slower economic growth due to these challenges. The one bright spot continues to be the strong backlog of orders in the industrial segment of the economy. We have yet to see a material benefit from the recently passed legislative packages that could extend and add to these backlogs. We are now entering a period where the economy should show signs of slowing given the duration and severity of rate hikes on the part of the Fed. The equity markets may very well welcome bad economic news as a sign that the rate cycle is finally coming to an end. Our focus will continue to be at the company level, with an emphasis on seeking to invest in companies with secular tailwinds or strong product-driven cycles.

Disclosures

The opinions expressed herein are those of Aristotle Atlantic Partners, LLC (Aristotle Atlantic) and are subject to change without notice. Past performance is not a guarantee or indicator of future results. This material is not financial advice or an offer to purchase or sell any product. You should not assume that any of the securities transactions, sectors or holdings discussed in this report were or will be profitable, or that recommendations Aristotle Atlantic makes in the future will be profitable or equal the performance of the securities listed in this report. The portfolio characteristics shown relate to the Aristotle Atlantic Core Equity strategy. Not every client’s account will have these characteristics. Aristotle Atlantic reserves the right to modify its current investment strategies and techniques based on changing market dynamics or client needs. There is no assurance that any securities discussed herein will remain in an account’s portfolio at the time you receive this report or that securities sold have not been repurchased. The securities discussed may not represent an account’s entire portfolio and, in the aggregate, may represent only a small percentage of an account’s portfolio holdings. The performance attribution presented is of a representative account from Aristotle Atlantic’s Core Equity Composite. The representative account is a discretionary client account which was chosen to most closely reflect the investment style of the strategy. The criteria used for representative account selection is based on the account’s period of time under management and its similarity of holdings in relation to the strategy. Recommendations made in the last 12 months are available upon request.

Returns are presented gross and net of investment advisory fees and include the reinvestment of all income. Gross returns will be reduced by fees and other expenses that may be incurred in the management of the account. Net returns are presented net of actual investment advisory fees and after the deduction of all trading expenses.

All investments carry a certain degree of risk, including the possible loss of principal. Investments are also subject to political, market, currency and regulatory risks or economic developments. International investments involve special risks that may in particular cause a loss in principal, including currency fluctuation, lower liquidity, different accounting methods and economic and political systems, and higher transaction costs. These risks typically are greater in emerging markets. Securities of small‐ and medium‐sized companies tend to have a shorter history of operations, be more volatile and less liquid. Value stocks can perform differently from the market as a whole and other types of stocks.

The material is provided for informational and/or educational purposes only and is not intended to be and should not be construed as investment, legal or tax advice and/or a legal opinion. Investors should consult their financial and tax adviser before making investments. The opinions referenced are as of the date of publication, may be modified due to changes in the market or economic conditions, and may not necessarily come to pass. Information and data presented has been developed internally and/or obtained from sources believed to be reliable. Aristotle Atlantic does not guarantee the accuracy, adequacy or completeness of such information.

Aristotle Atlantic Partners, LLC is an independent registered investment adviser under the Advisers Act of 1940, as amended. Registration does not imply a certain level of skill or training. More information about Aristotle Atlantic, including our investment strategies, fees and objectives, can be found in our Form ADV Part 2, which is available upon request. AAP-2310-32

Performance Disclosures

Sources: CAPS Composite Hub, Russell Investments

Composite returns for all periods ended September 30, 2023 are preliminary pending final account reconciliation.

The Aristotle Core Equity Composite has an inception date of August 1, 2013 at a predecessor firm. During this time, Mr. Fitzpatrick had primary responsibility for managing the strategy. Performance starting November 1, 2016 was achieved at Aristotle Atlantic.

Past performance is not indicative of future results. Performance results for periods greater than one year have been annualized. Returns are presented gross and net of investment advisory fees and include the reinvestment of all income. Gross returns will be reduced by fees and other expenses that may be incurred in the management of the account. Net returns are presented net of actual investment advisory fees and after the deduction of all trading expenses.

Index Disclosures

The Russell 1000® Growth Index measures the performance of the large cap growth segment of the U.S. equity universe. It includes those Russell 1000 companies with higher price-to-book ratios and higher forecasted growth values. This index has been selected as the benchmark and is used for comparison purposes only. The Russell 1000® Value Index measures the performance of the large cap value segment of the U.S. equity universe. It includes those Russell 1000 companies with lower price-to-book ratios and lower expected growth values. The S&P 500® Index is the Standard & Poor’s Composite Index of 500 stocks and is a widely recognized, unmanaged index of common stock prices. The Dow Jones Industrial Average® is a price-weighted measure of 30 U.S. blue-chip companies. The Index covers all industries except transportation and utilities. The NASDAQ Composite Index measures all NASDAQ domestic and international based common type stocks listed on The NASDAQ Stock Market. The NASDAQ Composite includes over 3,000 companies, more than most other stock market indices. The Bloomberg U.S. Aggregate Bond Index is an unmanaged index of domestic investment grade bonds, including corporate, government and mortgage-backed securities. The WTI Crude Oil Index is a major trading classification of sweet light crude oil that serves as a major benchmark price for oil consumed in the United States. The Brent Crude Oil Index is a major trading classification of sweet light crude oil that serves as a major benchmark price for purchases of oil worldwide. The 3-Month U.S. Treasury Bill is a short-term debt obligation backed by the U.S. Treasury Department with a maturity of three months.  The Consumer Price Index (CPI) is a measure of the average change over time in the prices paid by urban consumers for a market basket of consumer goods and services. While stock selection is not governed by quantitative rules, a stock typically is added only if the company has an excellent reputation, demonstrates sustained growth and is of interest to a large number of investors. The volatility (beta) of the Composite may be greater or less than its respective benchmarks. It is not possible to invest directly in these indices.

Host: Alex Warren, CFA, CAIA

Guest: Thomas Hynes, Jr., CFA

October 16, 2023

Episode Length: 15:34

In this episode, we speak with Thomas Hynes, Jr., CFA, Managing Director and Portfolio Manager at Aristotle Atlantic Partners. He discusses why he believes identifying secular themes through fundamental, bottom-up, research of companies can lead to longer-term investment opportunities.

SHOW NOTES
  • Host introduction (0:00 – 0:19)
  • Episode introduction (0:20 – 00:56)
  • Introduction to the episode’s guest: Aristotle Atlantic’s Thomas Hynes (0:57 – 1:35)
  • What makes Aristotle Atlantic’s investment philosophy unique (1:36 – 3:31)
  • Identifying investible secular themes (3:32 – 5:01)
  • Why Aristotle Atlantic believes Personalized Health is an investible secular theme (5:02 – 7:23)
  • Potential investment opportunities in Personalized Health (7:24 – 8:45)
  • Why Aristotle Atlantic believes Pet Spending is an investible secular theme (8:46 – 10:36)
  • Potential investment opportunities in Pet Spending (10:37 – 11:48)
  • The lifecycle of secular themes and retired secular themes (11:49 – 13:30)
  • Conclusion (13:31 – 13:55)
  • Disclosures (13:56 – 15:34)
TRANSCRIPT

Alex Warren: Welcome to the Power of Patience, Aristotle’s podcast where we share views on topics actively explored by our investment teams and across the organization. I’m Alex Warren, Product Specialist at Aristotle, and I’ll be your host today. Coming up on today’s episode, we’ll be speaking with Tom Hynes, Managing Director and Portfolio Manager at Aristotle Atlantic Partners. Tom serves as a Portfolio Manager on Aristotle Atlantic’s Core Equity, Large Cap Growth and Focus Growth strategies. If you enjoyed this podcast, please like and share it on LinkedIn to help spread the word.

Today on the show, we’ll discuss how Aristotle Atlantic defines and identifies secular themes, the role of secular themes in the team’s investment philosophy, examples of current themes the team invests in, and why he believes certain secular themes offer attractive investment opportunities.

Without further ado, let’s get started. Tom, thank you so much for speaking with me today. To lead off the discussion, can you introduce yourself and tell me a bit about your role at Aristotle Atlantic?

Thomas Hynes: Yes. Thanks, Alex. I’m delighted to be here. My name’s Tom Hynes and I’m a Co-Portfolio Manager and Senior Sector Analyst on the team. I cover the Healthcare and Consumer Staples sector, and I also handle a lot of direct client interactions. I’m part of a five-person team that founded Aristotle Atlantic in late 2016 after spending about a decade together at Deutsche Asset Management. We’re headquartered in Sarasota, Florida, and we focus on managing US large cap equity mandates.

Alex Warren: Wonderful. Thank you, Tom. Can you discuss Aristotle Atlantic’s investment philosophy, and what do you believe makes it unique?

Thomas Hynes: Sure, Alex. So we believe that successful investments can be categorized into three different categories. Those are secular themes, product cycles and cyclical trends. I think what makes it unique is that we source these trends and cycles from bottom-up research. Not only are we looking to find the themes and cycles, we’re also trying to find the companies that are poised to benefit from them. So, let me drill down on each of those categories a little bit.

Cyclical themes refer to sort of the traditional form of investing. That would be trying to determine where we are within the business cycle, and then positioning in names that are either pro-cyclical, when the economy’s expanding, or defensive, when we see a slowdown or we see some sort of macro conditions that are slowing the economy. For us, this tends to be the smallest part of our process.

The next category is product cycles, and here what we’re looking for is a company that’s in the midst of a new product introduction or an innovative product enhancement.

What we’re really looking for here is companies that have protectable intellectual property, we’re looking for first mover advantage and we’re looking for large and growing total addressable markets. Really, to sum up this thing, we’re looking for companies that are poised to take meaningful market share in a profitable way. For us, this tends to be about 15 to 25% of our investment allocation.

The third category is what we call secular themes. We define these as long-term shifts in spending, either by corporations, consumers, or government entities. We currently have identified 20 secular themes, and for us, this makes up about 60 to 80% of our investments. We’ve identified that 12 of those themes align with the United Nation’s sustainable development goals, so we refer to those 12 themes as sustainable secular themes.

Alex Warren: Gotcha, that makes sense. Now, Tom, how does the team identify secular themes, and what makes them investible?

Thomas Hynes: Sure. So again, when we talk about secular themes, we’re talking about defined shifts in spending either by consumers, governments or corporations. We’re looking for an expected multi-year time horizon. In our experience, a lot of the investment community tends to underestimate these themes in their infancy. What we believe makes our approach different from some of our peers is that we source these ideas from listening to the companies that we cover. Again, so I talked about sourcing these from the bottom up. We’re listening for a change in tone or a change in the way that a company is doing business.

Cloud computing, for example, when that was emerging as a secular theme, several companies in the technology space were establishing dedicated divisions to the growth in cloud computing. We knew that this spending was shifting towards this emerging modality. These trends tend to be multi-year and involve large and growing total addressable markets, just like I talked about with our product stories. So the list of secular themes is wide and ranging, but the one thing, Alex, that makes it unique is they all are underpinned by technological advancement, right?

So, I’m not trying to say that they’re all within the technology sector, but if you look at the list of the 20 secular themes that we have, you can see that technology influences many of them. Things like streaming and digital media, things like next-generation sequencing and personalized health, and practice management software and diagnostics within the pet care industry.

Alex Warren: Tom, can you discuss what personalized health is, and why do you believe it’s an investible secular theme?

Thomas Hynes: Sure. We first recognized personalized health, or as some might call it personalized medicine, as an investible theme back in 2019. However, it’s been around for quite a long time. Personalized health is the idea that we can use advanced technology to tailor customized solutions based on a patient’s specific disease characteristics. These customized solutions are called targeted therapies, and they seek to deliver better patient outcomes with fewer side effects, and also in a more cost-efficient manner.

What’s nice about targeted therapies is they also help the companies that are developing drugs, right? So if a company can identify patients that are most likely to benefit from a therapy based on the specifics of their drug, it increases the odds of success in that clinical trial, and it potentially can increase the speed to market for these innovative therapies. However, personalized medicine is not just limited to these therapeutics. We have personalized health, which involves devices and trackers, things that can create a lot of data to help consumers lead a more healthy life.

So, let’s drill down really quick, Alex, and we’ll do an example within the use of targeted therapies in oncology. We believe targeted therapies have the potential to transform the cancer treatment paradigm. In the traditional treatment of cancer, all patients were given the same therapy. It was typically something like chemotherapy, which can be somewhat crude, highly toxic medicine with unpleasant side effects and questionable efficacy. Cancer researchers realize each tumor gives off a series of biomarkers or mutational signatures that can make each patient’s tumor unique.

By identifying these proteins, biomarkers or mutations, scientists are working on better therapies that can address those idiosyncrasies at the patient level. Recently, we’ve seen a lot of FDA approvals around these targeted therapies, and advanced diagnostic techniques are used to determine the exact genetic profile of the tumor, and then, if available, they can match patients to these targeted therapies. Again, these drugs typically have a better efficacy profile, they have s cleaner side effect profile, and perhaps most importantly, they can save money for the entire system by providing those better outcomes, which is important, right? It can sort of democratize health, and proper healthcare can get to more people.

Alex Warren: That sounds promising for the future. Now, how would you invest in this theme?

Thomas Hynes: We think there are several current opportunities to invest around personalized health. The first would be in the advanced diagnostics that are needed to do the comprehensive genetic profiling of the tumor. So, traditionally, to learn more about a patient’s tumor, this was done with what’s called a tissue biopsy. Tissue biopsy is a surgical procedure where a surgeon goes in and slices off a small piece of the tumor, and then that small piece of tissue is analyzed. What we’re excited about is what’s called liquid biopsy. These are more simple tests. They’re done with easily attainable liquid samples – things like blood, saliva, or urine – and they can attain that same comprehensive genetic profile of a patient’s tumor.

Liquid biopsies are important and we think they’re a better modality. They’re less invasive, less expensive, and they can offer a faster time to result. The second opportunity is, again, within the biopharmaceutical industry that I talked about, where they can develop better clinical trials and increase their odds of successfully bringing that drug to market. And then lastly, the third opportunity we think about is in the wearables and device segment. One example of this that we are excited about is continuous glucose monitoring devices. These are used by diabetic patients to help them increase their treatment and have a better treatment paradigm overall.
Alex Warren: Gotcha. It sounds like there’s a lot of opportunities in personalized health. Now, let’s switch gears and talk about pet spending. Can you talk about this secular theme a bit more?

Thomas Hynes: Sure, yeah. We first recognized pet spending as a secular theme back in 2017. It shouldn’t come as a surprise to many, but over the past couple of decades, we’ve seen a broad global expansion in pet ownership. In fact, in 2022, it’s estimated that 70% of all US households owned a pet, and that’s up from 56% when the survey was first taken back in 1988. In addition to more pets and more pet ownership, pets are increasingly becoming thought of more as a member of the family, as there’s this growing bond between pet owners and their pets. You see this every day, or at least I do, right? More people are traveling with pets, they let the pets sleep in bed with them, they might take them to a restaurant. I just feel like we’re seeing them kind of all over the place.

Alex Warren: Absolutely.

Thomas Hynes: Another recent survey that was out of pet owners, Alex, came out and said that most people, or a majority of people would make sacrifices to their own daily living before they would deprive their pet of anything.

Alex Warren: Wow.

Thomas Hynes: Yeah. That’s kind of interesting, and I think in the COVID-19 pandemic, that only accelerated this thing. People were locked down, they were trapped inside their homes, so we saw another uptick in pet ownership coming out of COVID. Maybe just two quick stats before I wrap up. The one would be pet spending. Pet spending has increased to over $123 billion in 2021, and that’s up from roughly $70 billion in 2017.

Alex Warren: Wow.

Thomas Hynes: Yeah. That represents a compound annual growth rate (CAGR) of 15%, well outpacing that of typical GDP growth. And then lastly, just an interesting little quip is that the average dog owner spends about $1,500 a year annually on the dog, whereas cats come in a little cheaper at about $900 per year.

Alex Warren: People love their dogs, I get it. I’m a dog owner myself, so these numbers certainly track. Now, going one step further, how do you invest in this theme?

Thomas Hynes: Sure, yeah. We think there’s a couple of different ways. The first one would be investing in companies that are making or selling pet food, treats, accessories, or some of the things I just talked about. For example, we actually had a theme in the past around natural and organic food, and this theme initially was focused on humans, right? People were more interested in eating well, eating cleanly, that sort of thing. We identified a few opportunities in companies that were also making natural and organic food for pets. So pet owners, they’re growing more conscious of what their pets are eating as well.

The second one, and one we think is very interesting, is opportunities for companies focused on that pet diagnostic services and equipment market for the veterinary segment. Similar to you and I, if we go in for an annual physical, we might go have some blood work done. Well, that’s the increasing standard of care we’re seeing for pets as well. They’re doing diagnostics both for wellness visits, your annual visit for your dog, and also for sick visits. And it’s really taking a step up in that standard of care. And again, people are treating their pets more like a member of family, so they’re more interested in better outcomes, keeping them healthy.

Alex Warren: Absolutely. That makes sense. Now, Tom, this has been a great conversation and we have time for a couple of final questions. Have there been any secular themes in the portfolio that have run their course, and can you discuss how the team decided whether that theme was no longer investible?

Thomas Hynes: Sure. So, part of our job is to be constantly reviewing these themes and listening to these companies, again, for emerging themes or new themes. So we do, on a quarterly basis, we do a formal review where we sit down, we go through all 20 of the secular themes. We also open up to all of the team members for anyone to bring up a theme, right? So it doesn’t need to be specific to our coverage, but if we’re hearing about something, we’re reading about something, we can propose and then discuss that theme. So there’s a couple that have run their course. A quick one would be 5G, right? The move from 4G to 5G for cellular communications.

We had a theme around that spending. It’s largely played out, and we eventually took that one off. The other is around shale drilling. Shale drilling was a new, emerging technique used to extract more oil and gas from the ground. It actually led to increasing levels of supply, which brought the price of those items down. So secular shale drilling sort of ate itself, cannibalized a little bit. One more quick point before we wrap up, I would make is that some of the themes just morph over time. I mentioned that one we had around natural and organic foods, and eventually, we realized it wasn’t that people just wanted to eat more cleanly and eat better foods. They wanted to look better, they wanted to feel better.

And over time, over I’d say probably the course of two or three years, that evolved into a current theme that we have that we call healthy living and vanity. And again, that’s about people wanting to exercise more, feel better about themselves, live better and ultimately look better.

Alex Warren: That brings us to the end of this episode. Thank you so much, Tom, for joining us today. We hope you’ve enjoyed it and learned more about Aristotle. Thanks for listening to the Power of Patience. To learn more about Aristotle, please visit www.aristotlecap.com or follow the link in the show notes. If you enjoyed the show, please rate and review us on Spotify and Apple Podcasts. And on behalf of Aristotle, this is Alex Warren, and thank you for listening.

DISCLOSURE

For additional disclosures please refer to www.aristotlecap.com

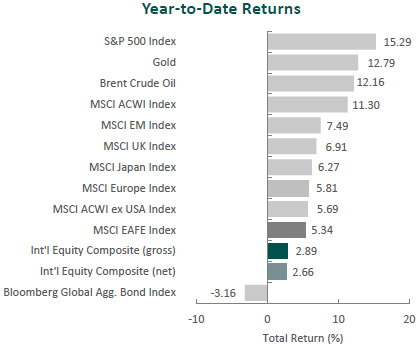
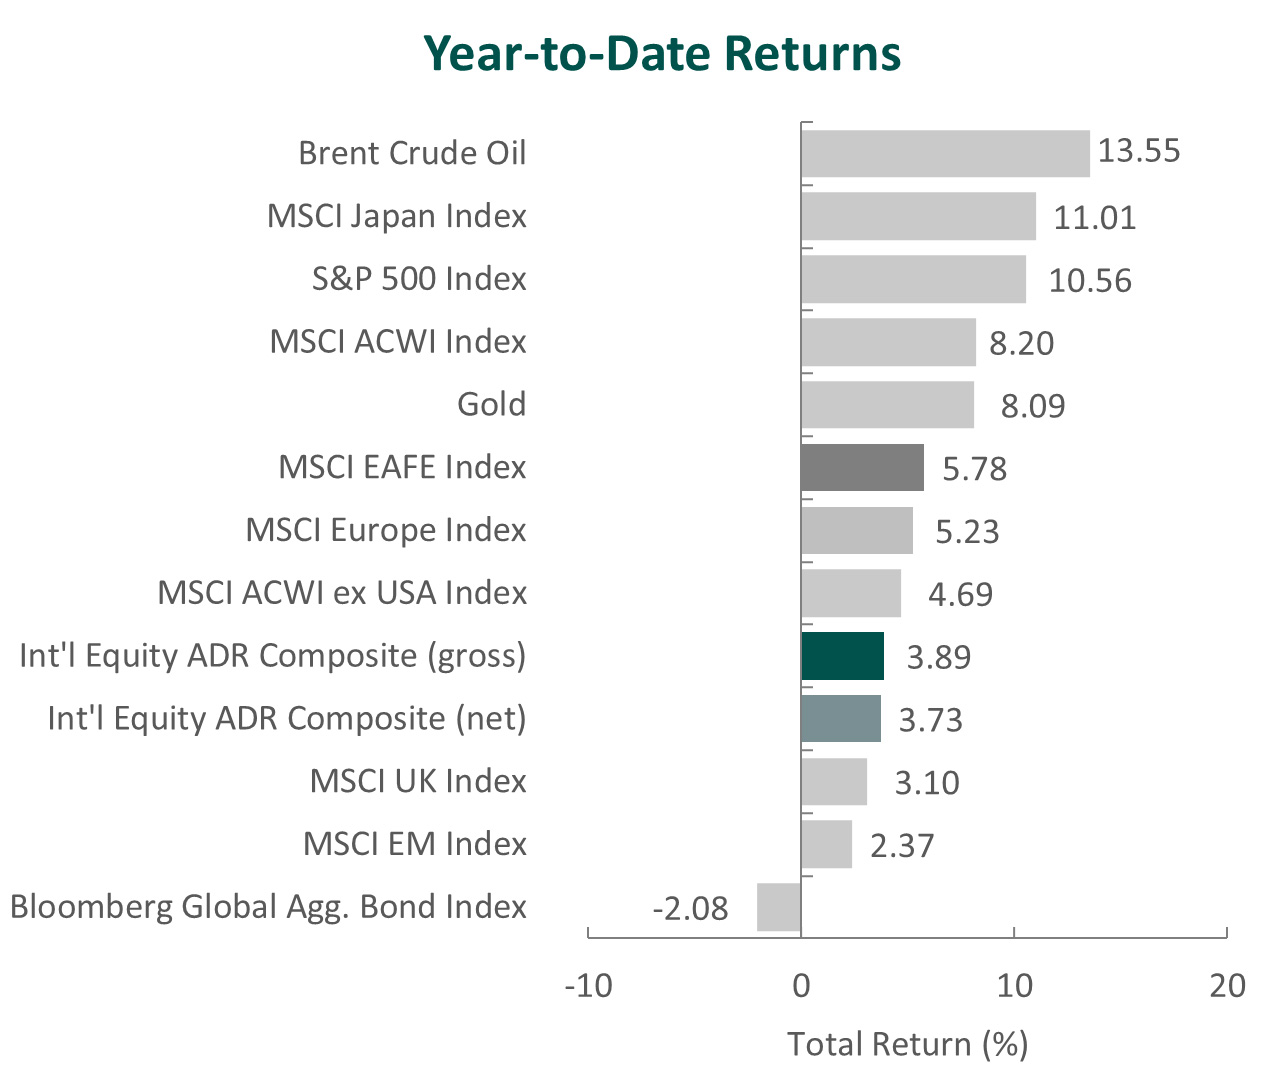
(All MSCI index returns are shown net and in U.S. dollars unless otherwise noted.)

Markets Review

Sources: CAPS CompositeHubTM, Bloomberg
Past performance is not indicative of future results. Aristotle International Equity Composite returns are presented gross and net of investment advisory fees and include the reinvestment of all income. Gross returns will be reduced by fees and other expenses that may be incurred in the management of the account. Net returns are presented net of actual investment advisory fees and after the deduction of all trading expenses. Aristotle Capital Composite returns are preliminary pending final account reconciliation. Please see important disclosures at the end of this document.

Global equity markets rallied in the fourth quarter. Overall, the MSCI ACWI Index rose 11.03% during the period. Concurrently, the Bloomberg Global Aggregate Bond Index increased 8.10%. In terms of style, value stocks underperformed their growth counterparts during the quarter, with the MSCI ACWI Value Index trailing the MSCI ACWI Growth Index by 3.57%.

The MSCI EAFE Index climbed 10.42% during the fourth quarter, while the MSCI ACWI ex USA Index increased 9.75%. Within the MSCI EAFE Index, Europe & Middle East and Asia were the strongest performers, while the U.K., though posting strong absolute results, gained the least. On a sector basis, all eleven sectors within the MSCI EAFE Index posted positive returns, with Information Technology, Materials and Real Estate generating the largest gains. Conversely, Energy, Health Care and Consumer Staples gained the least.

Despite posting overall gains, global equity markets were shocked with another war and humanitarian crisis as tensions between Israel and Hamas reached a watershed during the quarter. In response to the deadly terrorist attack on civilians by Hamas, Israel commenced a military campaign in the Gaza Strip. While concerns that the war might spread throughout the entire Middle East abated during the period, the complex religious, ethnic and political makeup of the region could complicate diplomatic relationships in the future.

Meanwhile, in Europe, Ukraine’s 2023 counteroffensive against Russia was confirmed as a failure, and Western support for the beleaguered nation seems to be waning. President Putin has stated that Russia’s war goals have not changed, but reports indicate that he may be open to a cease-fire. In Asia, President Xi Jinping claimed that reunification is inevitable, adding to the mounting Chinese pressure on Taiwan ahead of Taiwan’s 2024 election.

On the economic front, global labor markets remained tight, and most countries and regions continued to make inroads in the battle against inflation, as the U.S., U.K., eurozone and Japan all reported slowing annual inflation in November; 3.1%, 3.9%, 2.4% and 2.8%, respectively. In response to the improving conditions, both major western and eastern nations largely kept interest rate policy steady during the quarter. However, future policy direction looks to be divided heading into the new year, as the U.S. signaled potential rate cuts, the U.K. and eurozone rebuffed premature discussions of cuts, and Japan looks to end its policy of negative rates in 2024. Nevertheless, the International Monetary Fund expects global inflation to continue to steadily decline due to overall tighter monetary policy and lower commodity prices, which have been further suppressed by the bursting of China’s property bubble.

Annual Markets Review

After a tumultuous year in 2022, global equity markets rebounded in 2023, as the MSCI ACWI posted a full-year return of 22.20%. Additionally, after underperforming value in 2022 by the largest amount since 2000, growth recovered, as the MSCI ACWI Growth Index outperformed the MSCI ACWI Value Index by 21.41% in 2023. Meanwhile, fixed income markets also rose, as the Bloomberg Global Aggregate Bond Index increased 5.72%.

Though markets trended in a positive direction, 2023 still had its share of twists and turns in the form of a banking crisis and geopolitical conflicts in Europe, the Middle East and Asia. Furthermore, inflation, corresponding central bank policies, and economic recovery in areas like Europe and Asia generated significant headlines and proved to be key macroeconomic factors.

Given the multitude of headlines in a year and their fickle nature, short-term returns are often volatile and inconsistent. Therefore, we instead choose to focus on business fundamentals over the long term. By finding great businesses that are undervalued with actionable catalysts within our investment time horizon, we believe we can provide consistent and lasting value to our clients.

Performance and Attribution Summary

For the fourth quarter of 2023, Aristotle Capital’s International Equity ADR Composite posted a total return of 9.53% gross of fees (9.42% net of fees), underperforming the MSCI EAFE Index, which returned 10.42%, and the MSCI ACWI ex USA Index, which returned 9.75%. Please refer to the table below for detailed performance.

Performance (%) 4Q231 Year3 Years5 Years10 Years Since Inception*
International Equity ADR Composite (gross)9.5318.184.208.915.436.17
International Equity ADR Composite (net)9.4217.623.678.414.935.66
MSCI EAFE Index (net)10.4218.244.028.164.285.31
MSCI ACWI ex USA Index (net)9.7515.621.557.083.834.58
*The inception date for the International Equity ADR Composite is June 1, 2013. Past performance is not indicative of future results. Aristotle International Equity ADR Composite returns are presented gross and net of investment advisory fees and include the reinvestment of all income. Gross returns will be reduced by fees and other expenses that may be incurred in the management of the account. Net returns are presented net of actual investment advisory fees and after the deduction of all trading expenses. Aristotle Capital Composite returns are preliminary pending final account reconciliation. Please see important disclosures at the end of this document

Source: FactSet
Past performance is not indicative of future results. Attribution results are based on sector returns which are gross of investment advisory fees. Attribution is based on performance that is gross of investment advisory fees and includes the reinvestment of income.

From a sector perspective in the fourth quarter, the portfolio’s underperformance relative to the MSCI EAFE Index can be primarily attributed to allocation effects, while security selection also had a negative impact. Security selection in Industrials and Information Technology and an underweight in Information Technology detracted the most from relative performance. Conversely, security selection in Consumer Discretionary, Financials and Energy contributed to relative return.

Regionally, security selection was responsible for the portfolio’s underperformance, while allocation effects had a slightly positive impact. Security selection in the U.K. and Asia detracted, while exposure to Canada and Emerging Markets contributed.

Contributors and Detractors for 4Q 2023

Relative ContributorsRelative Detractors
BrookfieldRentokil Initial
Assa Abloy Nidec
Experian Haleon
AccentureAlcon
CreditcorpKubota

Rentokil Initial, the U.K.-based pest control and hygiene services company, was the largest detractor for the quarter. The company’s pest control segment (which accounts for 94% of total operating profit) reported a slowdown in organic revenue growth from 5.6% in the first half of 2023 to 2.3% in the third quarter. As these results are short term in nature, we will continue to closely monitor the company’s progress on both integration of Terminix and further improvement of its marketing strategy. This includes the recent appointment of Brad Paulsen as CEO of the North America Region and his impact on the company’s most important geography (accounting for ~75% of pest control sales). Over the long term, we remain confident that the Terminix acquisition will create scale efficiencies and in-market densification (with a targeted $200 million in cost synergies by 2025), as well as accelerate the consolidation of the U.S. pest control market. Short-term impacts on the company’s stock price, in our opinion, are overdone given these fundamental improvements coupled with the resilient nature of the pest control business.

Japan-based Nidec, the global supplier of brushless motors, was one of the largest detractors for the quarter. The company’s electric vehicle (EV) traction motor business has disappointed, with shipment assumptions dropping to 350,000 from 949,000 at the start of the fiscal year. Management also withdrew its ambitious target for the EV business to turn profitable this fiscal year, now projecting an operating loss of ¥15 billion, as it noted all motor suppliers to Chinese EV manufacturers are currently experiencing losses due to intensifying price competition. In response, Nidec has announced a shift in its strategy to both increase R&D spending to accelerate product development and shore up profitability with more selective order placement. While we continue to believe Nidec’s expertise in power efficiency provides it with a unique advantage to supply industrial motors across markets (not only for EVs, but also robots, appliances and industrial applications), we are carefully reviewing whether recent setbacks are cyclical issues or more permanent in nature, and we also continue to monitor changes in leadership, including those set to take place in April 2024.

Door and locks manufacturer Assa Abloy was a leading contributor for the period. Despite a softer residential construction market, the company has shown resiliency as it continues to optimize operating leverage through lower material costs, improved cost structures, price realizations and its strong aftermarket business. As a result, Assa Abloy posted a record adjusted operating margin during the period, which adjusts for the impacts of the 2023 acquisition of Spectrum Brands’ Hardware and Home Improvement. Though the transaction is expected to impact short-term results, management has reported that synergies are already starting to be realized, and we believe that, on a normalized basis, unadjusted operating margins will prove higher than current levels. Moreover, we view this acquisition, along with the other 21 companies acquired in 2023, as demonstrative of the company’s dedication to further investing in its business and cements Assa Abloy’s position as a market leader.

Experian, one of the largest credit bureau companies in the world, was a primary contributor during the quarter. Amidtighter lending conditions, the company continues to show its strength. This includes recent product launches and innovation within the company’s Ascend platform, which leverages deeper analytics so that lenders can automate processes and target audiences more effectively. The credit bureau also expanded its position in employer services and verifications and has seen further digital penetration in areas like Auto and Health. During our well over a decade-long ownership of Experian, the company has increasingly found ways to monetize existing data sets and serve new types of customers. We believe Experian’s unique industry structure and massive data library (with data on ~1.5 billion consumers and ~200 million businesses) not only creates an exceptionally scalable business with high barriers to entry, but also makes it uniquely positioned to benefit from the increased need for big data across many industries.

Recent Portfolio Activity

BuysSells
Daikin IndustriesDassault Systèmes
Sandoz

During the quarter, we sold our positions in Dassault Systèmes and Sandoz and invested in a new position in Daikin Industries.

We first invested in Dassault in the first quarter of 2015. During our more than eight-year holding period, the company executed on a number of catalysts, including a profitable transition to a new software platform (i.e., 3DExperience) and successful entry into new verticals such as life sciences via the 2019 acquisition of Medidata. While we continue to view Dassault as a high-quality company, we decided to exit our investment in favor of what we view as a more optimal opportunity in Daikin Industries, which is discussed in detail below.

We have been Novartis shareholders for over a decade. In October of 2023, the company completed the spinoff of Sandoz, its generics and biosimilars business. This divestiture furthers Novartis’s ongoing transition to a focus on branded prescription drugs, having over the last several years also exited its eye care, vaccine, animal health and consumer healthcare businesses. Upon further analysis, we decided to sell the shares received in the Sandoz spinoff and use the proceeds for what we consider to be a more optimal investment.

Daikin Industries, Ltd.

Founded in 1924 and headquartered in Japan, Daikin Industries is the world’s largest commercial and residential air conditioner company. Daikin primarily manufactures and sells air conditioning systems, heat pumps, air purifiers and refrigeration equipment (which accounts for over 90% of revenue). Daikin has long been an industry leader in developing energy-efficient products, which was molded by its roots in Japan, a region with limited natural resources and high energy costs. The company’s R&D consists of a global Technology Innovation Center and 39 other regional development facilities in charge of tailoring offerings to their local markets. Today Daikin’s products are sold in over 170 countries, and the company boasts leading market positions in Japan and China, as well as in the U.S. residential market.

Distribution is particularly important since air conditioning systems are difficult to install. Daikin’s 2012 acquisition of Goodman in the U.S. added hundreds of distribution points across the country, providing Daikin with a leading national market position and platform from which to expand. In China, specialty retail stores (ProShops) sell directly to homeowners, focusing on high-end, multi-unit products at much higher margins than if they were selling to a developer or contractor.

Some of the quality characteristics we have identified for Daikin include:

  • Strong brand recognition and a large global distribution network are, in our opinion, strong competitive advantages and serve as high barriers to entry;
  • History of technological innovation, particularly in energy-saving inverters and variable refrigerant flow systems; and
  • Ability to tailor products to different local preferences across geographies and varied levels of HVAC regulations, thanks to Daikin’s network of global production bases and development facilities.

Based on our estimates, shares of the company are attractively valued. We believe greater global adoption of air conditioning, as well as higher priced and more profitable technologies (i.e., heat pumps and inverters), will lead to higher normalized FREE cash flow than currently appreciated by the market.

Catalysts we have identified for Daikin, which we believe will cause its stock price to appreciate over our three- to five-year investment horizon, include:

  • As the largest global supplier and a leader in energy efficiency, Daikin is uniquely positioned to benefit from the increase in worldwide air conditioning adoption rates (projected to triple by 2050) while leveraging its intellectual property in inverters and heat pumps;
  • Market share gains in the U.S. as Daikin further leverages its technology in premium residential air conditioning supported by Goodman’s distribution network; and
  • Execution of its Fusion 25 strategic plan that includes making improvements in technological development, strengthening sales and service networks, promoting digital transformation, and more.

Conclusion

With volatile economic data points, changing central bank policies, shocks to the banking system and various geopolitical conflicts, 2023 was full of headline-worthy news. However, as the market’s attention quickly shifted from one macro event to the next, we remained true to our bottom up, fundamental investment philosophy.

As such, instead of chasing the next headline or “placing bets” on short-term predictions, our focus remains on business fundamentals and what is analyzable in the long run. For over the past quarter century, we have dedicated ourselves to a “bottom-up” process of identifying high-quality businesses trading at meaningful discounts to intrinsic value, that possess catalysts which are underway and within management’s control. By doing so, we believe we can find long-term success regardless of the macroeconomic environment or news of the day.

Disclosures

The opinions expressed herein are those of Aristotle Capital Management, LLC (Aristotle Capital) and are subject to change without notice. Past performance is not a guarantee or indicator of future results. This material is not financial advice or an offer to buy or sell any product. You should not assume that any of the securities transactions, sectors or holdings discussed in this report were or will be profitable, or that recommendations Aristotle Capital makes in the future will be profitable or equal the performance of the securities listed in this report. The portfolio characteristics shown relate to the Aristotle International Equity ADR strategy. Not every client’s account will have these characteristics. Aristotle Capital reserves the right to modify its current investment strategies and techniques based on changing market dynamics or client needs. There is no assurance that any securities discussed herein will remain in an account’s portfolio at the time you receive this report or that securities sold have not been repurchased. The securities discussed may not represent an account’s entire portfolio and, in the aggregate, may represent only a small percentage of an account’s portfolio holdings. The performance attribution presented is of a representative account from Aristotle Capital’s International Equity ADR Composite. The representative account is a discretionary client account which was chosen to most closely reflect the investment style of the strategy. The criteria used for representative account selection is based on the account’s period of time under management and its similarity of holdings in relation to the strategy. Recommendations made in the last 12 months are available upon request.

Returns are presented gross and net of investment advisory fees and include the reinvestment of all income. Gross returns will be reduced by fees and other expenses that may be incurred in the management of the account. Net returns are presented net of actual investment advisory fees and after the deduction of all trading expenses.

All investments carry a certain degree of risk, including the possible loss of principal. Investments are also subject to political, market, currency and regulatory risks or economic developments. International investments involve special risks that may in particular cause a loss in principal, including currency fluctuation, lower liquidity, different accounting methods and economic and political systems, and higher transaction costs. These risks typically are greater in emerging markets. Securities of small‐ and medium‐sized companies tend to have a shorter history of operations, be more volatile and less liquid. Value stocks can perform differently from the market as a whole and other types of stocks.

The material is provided for informational and/or educational purposes only and is not intended to be and should not be construed as investment, legal or tax advice and/or a legal opinion. Investors should consult their financial and tax adviser before making investments. The opinions referenced are as of the date of publication, may be modified due to changes in the market or economic conditions, and may not necessarily come to pass. Information and data presented has been developed internally and/or obtained from sources believed to be reliable. Aristotle Capital does not guarantee the accuracy, adequacy or completeness of such information.

Aristotle Cpital Management, LLC is an independent registered investment adviser under the Advisers Act of 1940, as amended. Registration does not imply a certain level of skill or training. More information about Aristotle Capital, including our investment strategies, fees and objectives, can be found in our Form ADV Part 2, which is available upon request. ACM-2401-149

Performance Disclosures

Sources: CAPS CompositeHubTM, MSCI

Composite returns for all periods ended December 31, 2023 are preliminary pending final account reconciliation.

Past performance is not indicative of future results. The information provided should not be considered financial advice or a recommendation to purchase or sell any particular security or product.  Performance results for periods greater than one year have been annualized.

Returns are presented gross and net of investment advisory fees and include the reinvestment of all income. Gross returns will be reduced by fees and other expenses that may be incurred in the management of the account. Net returns are presented net of actual investment advisory fees and after the deduction of all trading expenses.

Index Disclosures

The MSCI EAFE Index (Europe, Australasia, Far East) is a free float-adjusted market capitalization-weighted index that is designed to measure the equity market performance of developed markets, excluding the United States and Canada. The MSCI EAFE Index consists of the following 21 developed market country indexes: Australia, Austria, Belgium, Denmark, Finland, France, Germany, Hong Kong, Ireland, Israel, Italy, Japan, the Netherlands, New Zealand, Norway, Portugal, Singapore, Spain, Sweden, Switzerland and the United Kingdom. The MSCI ACWI captures large and mid-cap representation across 23 developed market countries and 24 emerging markets countries. With approximately 3,000 constituents, the Index covers approximately 85% of the global investable equity opportunity set. The MSCI ACWI Growth Index captures large and mid-cap securities exhibiting overall growth style characteristics across 23 developed markets countries and 24 emerging markets countries. The MSCI ACWI Value Index captures large and mid-cap securities exhibiting overall value style characteristics across 23 developed markets countries and 24 emerging markets countries. The MSCI ACWI ex USA Index captures large and mid-cap representation across 22 of 23 developed markets countries (excluding the United States) and 24 emerging markets countries. With approximately 2,300 constituents, the Index covers approximately 85% of the global equity opportunity set outside the United States. The MSCI Emerging Markets Index is a free float-adjusted market capitalization-weighted index that is designed to measure the equity market performance of emerging markets. The MSCI Emerging Markets Index consists of the following 24 emerging market country indexes: Brazil, Chile, China, Colombia, Czech Republic, Egypt, Greece, Hungary, India, Indonesia, Korea, Kuwait, Malaysia, Mexico, Peru, Philippines, Poland, Qatar, Saudi Arabia, South Africa, Taiwan, Thailand, Turkey and United Arab Emirates. The S&P 500® Index is the Standard & Poor’s Composite Index of 500 stocks and is a widely recognized, unmanaged index of common stock prices. The Brent Crude Oil Index is a major trading classification of sweet light crude oil that serves as a major benchmark price for purchases of oil worldwide. The MSCI Japan Index is designed to measure the performance of the large and mid-cap segments of the Japanese market. With approximately 250 constituents, the Index covers approximately 85% of the free float-adjusted market capitalization in Japan. The Bloomberg Global Aggregate Bond Index is a flagship measure of global investment grade debt from 28 local currency markets. This multi-currency benchmark includes treasury, government-related, corporate and securitized fixed-rate bonds from both developed and emerging markets issuers. The MSCI United Kingdom Index is designed to measure the performance of the large and mid-cap segments of the U.K. market. With nearly 100 constituents, the Index covers approximately 85% of the free float-adjusted market capitalization in the United Kingdom. The MSCI Europe Index captures large and mid-cap representation across 15 developed markets countries in Europe. With approximately 430 constituents, the Index covers approximately 85% of the free float-adjusted market capitalization across the European developed markets equity universe. These indexes have been selected as the benchmarks and are used for comparison purposes only. The volatility (beta) of the Composite may be greater or less than the respective benchmarks. It is not possible to invest directly in these indexes.

For more on International Equity, access the latest resources.

(All MSCI index returns are shown net and in U.S. dollars unless otherwise noted.)

Markets Review

Sources: CAPS CompositeHubTM, Bloomberg
Past performance is not indicative of future results. Aristotle International Equity Composite returns are presented gross and net of investment advisory fees and include the reinvestment of all income. Gross returns will be reduced by fees and other expenses that may be incurred in the management of the account. Net returns are presented net of actual investment advisory fees and after the deduction of all trading expenses. Aristotle Capital Composite returns are preliminary pending final account reconciliation. Please see important disclosures at the end of this document.

After three consecutive positive quarters, global equity markets reversed, as the MSCI ACWI Index fell  3.40% during the period. Concurrently, the Bloomberg Global Aggregate Bond Index decreased 3.59%. In terms of style, value stocks outperformed their growth counterparts during the quarter, with the MSCI ACWI Value Index beating the MSCI ACWI Growth Index by 3.13%.

The MSCI EAFE Index declined  4.11% during the third quarter, while the MSCI ACWI ex USA Index dropped  3.77%. Within the MSCI EAFE Index, Europe & Middle East and Asia were the worst-performing regions, while the U.K. declined the least. On a sector basis, nine out of the eleven sectors within the MSCI EAFE Index posted negative returns, with Information Technology, Utilities and Consumer Discretionary as the worst performers. Conversely, Energy and Financials posted positive returns, while Real Estate declined the least.
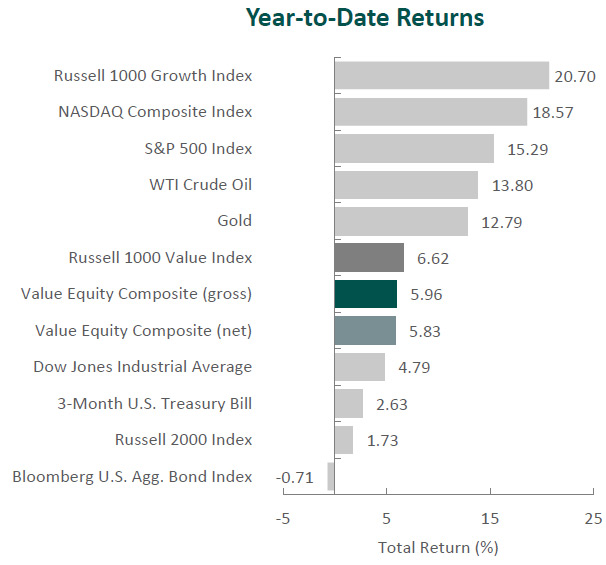
Although global financial markets experienced less turmoil than they did earlier this year, inflation remains elevated and economic data remains weak. In fact, the IMF forecast global GDP growth to decline to 3.0% in 2023.

China’s recovery remained sluggish amid an ongoing property slump and lackluster consumer spending. Meanwhile, high levels of inflation persisted across many regions of the world, although inflation in the U.S., eurozone and the U.K. eased significantly from levels seen earlier in the year.  Consistent with the progress, the IMF trimmed its global inflation projection to 6.8% from its prior estimate of 7.0% in April but warned inflation could remain high or reaccelerate due to factors such as geopolitics and weather-related events.

By contrast, in Asia, Japanese inflation edged down to 3.2% in August, and the Bank of Japan diverged from its Western counterparts by keeping short-term interest rates steady. China also took an easier approach to its monetary policy, cutting both short- and medium-term lending rates, as the country has struggled to recover following the pandemic. The People’s Bank of China hopes to combat weak consumer spending, falling exports and the country’s real estate crisis. Chinese property developers have come under increased scrutiny, as Evergrande filed for bankruptcy protection in the U.S. while Country Garden warned investors of significant losses.

On the geopolitical front, Ukraine continues to push its counteroffensive in the eastern and southern portions of the country. Western nations have largely remained dedicated to their support of Ukraine, as countries such as the U.S., Canada and the U.K. have all pledged to provide additional aid. In Taiwan, China carried out military exercises in the Taiwan Strait following the Taiwanese vice president’s visit to New York and San Francisco. Despite tense relations between the U.S. and China, the Biden Administration announced $345 million in military aid for Taiwan.

Performance and Attribution Summary

For the third quarter of 2023, Aristotle Capital’s International Equity ADR Composite posted a total return of -3.79% gross of fees (-3.91% net of fees), outperforming the MSCI EAFE Index, which returned -4.11%, and underperforming the MSCI ACWI ex USA Index, which returned -3.77%. Please refer to the table below for detailed performance.

Performance (%) 3Q23YTD1 Year3 Years5 Years10 Years Since Inception*
International Equity ADR Composite (gross)-3.797.9123.317.194.004.945.39
International Equity ADR Composite (net)-3.917.5022.736.653.534.444.89
MSCI EAFE Index (net)-4.117.0825.655.753.243.824.43
MSCI ACWI ex USA Index (net)-3.775.3420.393.742.583.353.75
*The inception date for the International Equity ADR Composite is June 1, 2013. Past performance is not indicative of future results. Aristotle International Equity ADR Composite returns are presented gross and net of investment advisory fees and include the reinvestment of all income. Gross returns will be reduced by fees and other expenses that may be incurred in the management of the account. Net returns are presented net of actual investment advisory fees and after the deduction of all trading expenses. Aristotle Capital Composite returns are preliminary pending final account reconciliation. Please see important disclosures at the end of this document

Source: FactSet

Past performance is not indicative of future results. Attribution results are based on sector returns which are gross of investment advisory fees. Attribution is based on performance that is gross of investment advisory fees and includes the reinvestment of income.

From a sector perspective in the third quarter, the portfolio’s outperformance relative to the MSCI EAFE Index can be attributed to both security selection and allocation effects. Security selection in Consumer Discretionary, Energy and Information Technology contributed the most to the portfolio’s relative performance. Conversely, security selection in Financials, Industrials and Materials detracted from relative return.

Regionally, allocation effects were responsible for the portfolio’s outperformance, while security selection had a negative impact. Exposure to Canada and security selection in Europe & Middle East contributed to relative performance, while security selection in the U.K. and Asia detracted.

Contributors and Detractors for 3Q 2023

Relative ContributorsRelative Detractors
CamecoFANUC
Pan Pacific InternationalDassault Systèmes
TotalEnergiesLVMH
Munich ReinsuranceCredicorp
DBS GroupAshtead Group

Pan Pacific International, the Japanese discount and general merchandise retailer, was a top contributor for the period. After being closed for over two and a half years, Japan’s reopening has led to a sharp recovery in retail traffic. In response, Pan Pacific has implemented an aggressive strategy of increasing the number of cash registers and strengthening staffing to boost sales while also focusing on improving procurement capabilities, expanding its private label strategy and improving its inventory turnover. As a result of these actions, along with favorable weather and a strong holiday season, the company’s sales exceeded pre-pandemic levels, and operating margin eclipsed 5% for the first time in five years. Furthermore, we are encouraged by Pan Pacific’s announcement that it will accelerate the opening of new stores with 25 openings in Japan and 12 stores overseas this year. We believe Pan Pacific is well positioned to continue gaining market share in Japan, further penetrate the overseas market and maintain strong levels of profitability.

TotalEnergies, one of the world’s largest energy companies, was also a primary contributor for the quarter. The company continues to execute on its strategic plan to reach net-zero emissions by 2050 which, in contrast to many European energy providers, it looks to achieve through expanding ownership of renewable power and low-carbon assets rather than purely divestment. The company expects to more than double its gross renewable generation capacity by 2025 (primarily in solar) and invest over 30% of its total spending in low-carbon businesses through 2030. As such, we believe TotalEnergies is uniquely positioned to benefit from the increase in global demand for clean energy. In recent years, TotalEnergies’ reduction in capex and operating expenses has improved its FREE cash flow generation, now further aided by the favorable energy environment. This has supported its continued ability to return cash to shareholders, one of our catalysts, as demonstrated by the $3.8 billion returned through share buybacks and dividends during the second quarter.

Japan-based FANUC, the global manufacturer of industrial robots as well as control systems for machine tools, was the largest detractor for the period. During the June quarter, orders for the company’s robots fell 23% year-on-year following ten consecutive quarters of annual increases. This abrupt decline may have been due to inventory adjustments in China and the Americas as many manufacturers became more cautious over capital investments. Looking past the short-term headwinds, we will continue to monitor the company’s progress shifting its revenue mix toward higher-margin service and IoT capabilities, which should improve profitability. This includes its FIELD platform, which offers predictive maintenance, optimization and self-learning that customers can utilize to reduce production downtime and energy costs. Moreover, we believe long-term prospects for the company are underappreciated since FANUC, as the industrial robot market leader, is uniquely positioned to benefit from further penetration of factory automation and robot usage across geographies.

LVMH Moët Hennessy Louis Vuitton, the luxury goods company, was a primary detractor for the quarter. After doubling sales over the past three years, LVMH is experiencing a slowdown, with organic growth in the recent semi-annual period of only 17%. Regionally, the luxury retail environment is mixed, as strong performance in Asia contrasts with softer demand in the U.S. and a lack of tourist activity from Chinese nationals. Additionally, the company maintained its long-term investment philosophy with increased advertising and promotional spending, which has pressured margins. Despite these near-term challenges, we believe LVMH’s actions will enhance profitability and expand market share in the long run. This includes the company’s continued shift toward Jewelry, which is now the business’s second-largest segment by profit, market share gains in the Selective Retailing segment due to strong performance from Sephora and DFS (Duty Free Shoppers), the successful integration of brands such as Christian Dior Couture, and ongoing integration of Tiffany & Co., which reopened its New York City flagship store “The Landmark” earlier this year.

Recent Portfolio Activity

BuysSells
NoneNone

Consistent with our long-term horizon and low turnover, there were no new purchases or sales completed during the quarter.

Conclusion

Rather than attempting to predict short-term market dynamics, at Aristotle Capital, we stay focused on understanding company fundamentals while carefully monitoring the long-term evolution of our portfolio of holdings. Our approach to understanding individual businesses reveals more insightful conclusions than would undue time spent concentrating on ever-changing and often unclear macroeconomic signals. While we strive to remain macro aware, our goal instead is to invest in businesses which are run by what we believe are capable and proven management teams that have the skill to navigate changing factors such as inflation, interest rates and government policy. We also analyze how such factors could alter the fundamentals of a business and whether those impacts are long term in nature.

We aim to find companies with high-quality characteristics that can succeed over full market cycles. It is our belief that a disciplined, research-oriented approach to finding great companies, as well as a consistent, well-executed portfolio management process, is how we can add the most value for our clients.

Disclosures

The opinions expressed herein are those of Aristotle Capital Management, LLC (Aristotle Capital) and are subject to change without notice. Past performance is not a guarantee or indicator of future results. This material is not financial advice or an offer to buy or sell any product. You should not assume that any of the securities transactions, sectors or holdings discussed in this report were or will be profitable, or that recommendations Aristotle Capital makes in the future will be profitable or equal the performance of the securities listed in this report. The portfolio characteristics shown relate to the Aristotle International Equity ADR strategy. Not every client’s account will have these characteristics. Aristotle Capital reserves the right to modify its current investment strategies and techniques based on changing market dynamics or client needs. There is no assurance that any securities discussed herein will remain in an account’s portfolio at the time you receive this report or that securities sold have not been repurchased. The securities discussed may not represent an account’s entire portfolio and, in the aggregate, may represent only a small percentage of an account’s portfolio holdings. The performance attribution presented is of a representative account from Aristotle Capital’s International Equity ADR Composite. The representative account is a discretionary client account which was chosen to most closely reflect the investment style of the strategy. The criteria used for representative account selection is based on the account’s period of time under management and its similarity of holdings in relation to the strategy. Recommendations made in the last 12 months are available upon request.

Returns are presented gross and net of investment advisory fees and include the reinvestment of all income. Gross returns will be reduced by fees and other expenses that may be incurred in the management of the account. Net returns are presented net of actual investment advisory fees and after the deduction of all trading expenses.

All investments carry a certain degree of risk, including the possible loss of principal. Investments are also subject to political, market, currency and regulatory risks or economic developments. International investments involve special risks that may in particular cause a loss in principal, including currency fluctuation, lower liquidity, different accounting methods and economic and political systems, and higher transaction costs. These risks typically are greater in emerging markets. Securities of small‐ and medium‐sized companies tend to have a shorter history of operations, be more volatile and less liquid. Value stocks can perform differently from the market as a whole and other types of stocks.

The material is provided for informational and/or educational purposes only and is not intended to be and should not be construed as investment, legal or tax advice and/or a legal opinion. Investors should consult their financial and tax adviser before making investments. The opinions referenced are as of the date of publication, may be modified due to changes in the market or economic conditions, and may not necessarily come to pass. Information and data presented has been developed internally and/or obtained from sources believed to be reliable. Aristotle Capital does not guarantee the accuracy, adequacy or completeness of such information.

Aristotle Capital Management, LLC is an independent registered investment adviser under the Advisers Act of 1940, as amended. Registration does not imply a certain level of skill or training. More information about Aristotle Capital, including our investment strategies, fees and objectives, can be found in our Form ADV Part 2, which is available upon request. ACM-2310-114

Performance Disclosures

Sources: CAPS CompositeHubTM, MSCI

Composite returns for all periods ended September 30, 2023 are preliminary pending final account reconciliation.

Past performance is not indicative of future results. The information provided should not be considered financial advice or a recommendation to purchase or sell any particular security or product.  Performance results for periods greater than one year have been annualized.

Returns are presented gross and net of investment advisory fees and include the reinvestment of all income. Gross returns will be reduced by fees and other expenses that may be incurred in the management of the account. Net returns are presented net of actual investment advisory fees and after the deduction of all trading expenses.

Index Disclosures

The MSCI EAFE Index (Europe, Australasia, Far East) is a free float-adjusted market capitalization-weighted index that is designed to measure the equity market performance of developed markets, excluding the United States and Canada. The MSCI EAFE Index consists of the following 21 developed market country indexes: Australia, Austria, Belgium, Denmark, Finland, France, Germany, Hong Kong, Ireland, Israel, Italy, Japan, the Netherlands, New Zealand, Norway, Portugal, Singapore, Spain, Sweden, Switzerland and the United Kingdom. The MSCI ACWI captures large and mid-cap representation across 23 developed market countries and 24 emerging markets countries. With approximately 3,000 constituents, the Index covers approximately 85% of the global investable equity opportunity set. The MSCI ACWI Growth Index captures large and mid-cap securities exhibiting overall growth style characteristics across 23 developed markets countries and 24 emerging markets countries. The MSCI ACWI Value Index captures large and mid-cap securities exhibiting overall value style characteristics across 23 developed markets countries and 24 emerging markets countries. The MSCI ACWI ex USA Index captures large and mid-cap representation across 22 of 23 developed markets countries (excluding the United States) and 24 emerging markets countries. With approximately 2,300 constituents, the Index covers approximately 85% of the global equity opportunity set outside the United States. The MSCI Emerging Markets Index is a free float-adjusted market capitalization-weighted index that is designed to measure the equity market performance of emerging markets. The MSCI Emerging Markets Index consists of the following 24 emerging market country indexes: Brazil, Chile, China, Colombia, Czech Republic, Egypt, Greece, Hungary, India, Indonesia, Korea, Kuwait, Malaysia, Mexico, Peru, Philippines, Poland, Qatar, Saudi Arabia, South Africa, Taiwan, Thailand, Turkey and United Arab Emirates. The S&P 500® Index is the Standard & Poor’s Composite Index of 500 stocks and is a widely recognized, unmanaged index of common stock prices. The Brent Crude Oil Index is a major trading classification of sweet light crude oil that serves as a major benchmark price for purchases of oil worldwide. The MSCI Japan Index is designed to measure the performance of the large and mid-cap segments of the Japanese market. With approximately 250 constituents, the Index covers approximately 85% of the free float-adjusted market capitalization in Japan. The Bloomberg Global Aggregate Bond Index is a flagship measure of global investment grade debt from 28 local currency markets. This multi-currency benchmark includes treasury, government-related, corporate and securitized fixed-rate bonds from both developed and emerging markets issuers. The MSCI United Kingdom Index is designed to measure the performance of the large and mid-cap segments of the U.K. market. With nearly 100 constituents, the Index covers approximately 85% of the free float-adjusted market capitalization in the United Kingdom. The MSCI Europe Index captures large and mid-cap representation across 15 developed markets countries in Europe. With approximately 430 constituents, the Index covers approximately 85% of the free float-adjusted market capitalization across the European developed markets equity universe. These indexes have been selected as the benchmarks and are used for comparison purposes only. The volatility (beta) of the Composite may be greater or less than the respective benchmarks. It is not possible to invest directly in these indexes.

For more on International Equity, access the latest resources.

ARISTOTLE CAPITAL BOSTON, LLC

Markets Review

The Russell 2000 reversed course after rising over 6% in the month of July, falling -10.6% in August and September, and closing out the quarter with a return of -5.13%. Performance was weaker down the cap spectrum with the Russell 2000 trailing the Russell 1000 for the fourth consecutive quarter, bringing the year-to-date gap between the two indices to 10.47% in favor of large caps. In spite of large caps recent streak of outperformance, many have noted the narrowness of the large cap market rally this year, with a select group of mega cap stocks coined the ‘Magnificent 7’ having driven the vast majority of large cap index gains so far this year. Surging oil prices and treasury yields, a broader and more protracted United Auto Workers strike, and the resumption of student loan payments all contributed to subdued market sentiment into quarter end. On the policy front, even as decades-high inflation showed meaningful signs of slowing, the Fed disappointed some investors’ expectations of a quick pivot to cutting rates. Instead, the central bank indicated its resolve to keep interest rates higher for longer in mid-June, deciding to hold off on raising interest rates as it takes stock of how its prior rate hikes are impacting the real economy.

Stylistically, value stocks proved relatively resilient versus their more expensive growth counterparts during the quarter as evidenced by the Russell 2000 Value Index returning -2.96% compared to -7.32% for the Russell 2000 Growth Index. The gap between the two styles remains wide on a year-to-date basis, however, with the Russell 2000 Growth Index having outperformed its value counterpart by more than 5% so far in 2023.

At the sector level, nine of the eleven sectors in the Russell 2000 Index generated negative returns during the third quarter and only three sectors generated returns ahead of the broader index, representing a second consecutive quarter of narrow sector leadership for the Index. Energy and Financials were the only sectors to deliver gains during the period with returns of 18.62% and 1.21%, respectively. Energy is also the only sector to be up in each of the last two quarters and now leads all sectors on a year-to-date basis after lagging through the first half of the year. Health Care (-15.14%) and Utilities (-11.75%) both ended the quarter with double digit declines and are lagging the Index on a year-to-date basis.

Sources: CAPS Composite Hub, Russell Investments

Past performance is not indicative of future results. Returns are presented gross and net of investment advisory fees and include the reinvestment of all income. Gross returns will be reduced by fees and other expenses that may be incurred in the management of the account. Net returns are presented net of actual investment advisory fees and after the deduction of all trading expenses. Aristotle Small Cap Equity Composite returns are preliminary pending final account reconciliation. Please see important disclosures at the end of this document.

Performance Review

For the third quarter of 2023, the Aristotle Small Cap Equity Composite posted a total return of -5.77% net of fees (-5.57% gross of fees), trailing the -5.13% total return of the Russell 2000 Index. Underperformance was driven by a combination of security selection and allocation effects. Overall, security selection was weakest within the Consumer Staples, Financials and Consumer Discretionary sectors and strongest in Health Care, Information Technology and Utilities. From an allocation perspective, the portfolio benefited from underweights in Health Care and Consumer Discretionary, however, this was offset by underweights in Energy and Financials.

Relative ContributorsRelative Detractors
Huron Consulting GroupEuronet Worldwide
MACOM Technology SolutionsDycom
Oceaneering InternationalMerit Medical Systems
HealthEquityMonro
PetIQNu Skin Enterprises

CONTRIBUTORS

Huron Consulting Group (HURN), a specialty consulting company that provides financial, operational, and digital consulting services to health care, education and commercial clients, appreciated after delivering strong results highlighted by continued momentum within the company’s health care and education segments. We maintain our investment, as we believe the company remains well-positioned to capitalize on a demand backdrop aided by financial and operational pressures in its largest end-markets, along with secular tailwinds supporting digital transformation, analytics and cloud consulting.

MACOM Technology Solutions (MTSI), a designer and manufacturer of high-performance semiconductor products, appreciated amid strength within its Industrial and Defense segment along with positive commentary around future AI data center demand. We maintain our position, as we believe the company’s meaningful exposure to growing demand from Data Center and 5G end market applications along with the integration of recent acquisitions should drive additional shareholder value in periods to come.

DETRACTORS

Euronet Worldwide (EEFT), a provider of electronic payment and financial transaction solutions, declined during the period amid inflationary pressures and rising travel costs, leaving consumers with fewer funds for discretionary tourism spending and ultimately resulting in a negative impact on its Electronic Funds Transfer segment. We maintain our investment, as we believe the company’s expansion into mobile and digital payments combined with a continued recovery in international travel can benefit shareholders in the periods to come.

Dycom (DY), a provider of engineering and construction services to the telecommunications and cable television industries, declined amid uncertainty regarding near term customer capital spending initiatives and their ensuing impact on fiber capex plans. We maintain a position as we believe the company remains well positioned for longer term growth alongside secular trends for expanding fiber deployments to support faster broadband connectivity speeds and opportunities to deploy fiber to rural or underserved areas across the country.

Recent Portfolio Activity

Buys/AcquisitionsSells/Liquidations
Patterson-UTI EnergyCalAmp
TKO Group HoldingsNexTier Oilfield Solutions
U.S. Xpress Enterprises
World Wrestling Entertainment

BUYS/ACQUISITIONS

Patterson-UTI Energy (PTEN), an oilfield services company focused on drilling and pressure pumping solutions was added to the portfolio following its merger with NexTier Oilfield Solutions. Overall, we maintain a positive view on the business combination as the merging of the two entities creates a comprehensive drilling and completions franchise with leadership positions in contract drilling, pressure pumping and directional drilling. Furthermore, we believe the company will benefit from greater size and scale, synergistic cost savings initiatives, and a more diversified suite of offerings to serve its customers.

TKO Group Holdings (TKO), a global sports and entertainment company formed through the merger of UFC and WWE, was added to the portfolio during the quarter. With assets spanning media & content, live events, sponsorship and licensing, we believe the company should be able to continue to capitalize on the booming global sports and entertainment ecosystem. Additionally, we believe the company’s diverse global fan base and strategic international expansion plans position the company well amidst favorable industry growth trends and an ever-evolving media rights landscape.

SELLS/LIQUIDATIONS

CalAmp (CAMP), a supplier of Mobile Resource Management solutions that allow for the remote collection of data from vehicles and other assets was removed from the portfolio during the quarter. In spite of the company’s efforts to convert its customer base from a hardware to a subscription model, redesign its customer support systems, and introduce new products in recent years, a variety of factors contributed to the harvesting of these efforts being pushed out, unfavorably impacting the risk-reward profile of the business. Therefore, we decided to eliminate the position.

NexTier Oilfield Solutions (NEX), a provider of hydraulic fracturing and other completion-oriented oilfield services to exploration and production companies in the U.S. was removed from the portfolio by virtue of its merger with Patterson-UTI Energy.

U.S. Xpress Enterprises (USX), a Tennessee-based trucking company was removed from the portfolio after being acquired by Knight-Swift Transportation.

World Wrestling Entertainment (WWE), an integrated media and entertainment company, was removed from the portfolio following its merger with Endeavor Group-owned UFC. The new publicly listed company that will combine the two entities will operate under the name TKO Group Holdings.

Outlook

Outside of a few major surprises, including the regional banking situation and an overly optimistic period of AI euphoria, it is perhaps surprising how little market risks and narratives have shifted over the last nine months. The two big uncertainties that many investors highlighted at the start of the year (i) whether inflation would persist and, (ii) whether there would be a recession, remain largely unresolved. While it is clear in the hard data that inflation has dropped over the course of the year, recent readings remain uncomfortably above the Federal Reserve’s target levels. Rapid increases in food and energy prices also persisted throughout the quarter fueling further uncertainty in the outlook. On the economy, the consensus view at the start of 2023 was that we were heading into a recession, with the only questions being when it would kick in, and how deep it would be. To this point, those questions still remain. One reason for market resiliency this year has been the performance of the economy, which has managed to not only avoid a recession to this point but also deliver strong employment numbers. Against this uncertain backdrop, the market may continue swinging between wild optimism, where inflation is no longer viewed as a threat and the economy has a soft landing, and extreme pessimism, where inflation comes roaring back, and the economy falls into a recession. Because of the difficulty in forecasting these macroeconomic outcomes, we have always strived to avoid making such predictions. Instead, we will – as always – stay focused on forecasting the underlying fundamentals of the companies in which we invest rather than making top-down investment or portfolio decisions. We do, however, believe that a normalization of financial conditions through higher rates (nominal and real) and QT should result in a more favorable market environment for quality companies with strong fundamentals better than it had been in the years leading up to, and through the pandemic/2021 period during which “Easy Money Policy” distorted market and style dynamics. Thus far in 2023, including the third quarter, we have seen short-term periods where more reasonably valued companies have recovered on a relative basis, but this has not been a linear shift in the market as much of the first half rally was more sentiment-driven than fundamentally supported, in our view. Ultimately, we believe business fundamentals and valuations are the key determinants of investment returns over extended periods and that remains our focus.

From an asset class perspective, valuations of small versus large continue to remain near multi-decade lows, which we believe suggests a more favorable setup for small caps relative to large caps in the periods to come (12.3x P/E for the Russell 2000 Index vs. 21.2x P/E for the Russell 1000 Index). Based upon relative P/E alone, there has been no other time in the Russell 2000’s history that has been as attractive relative to large cap as in recent times. Additionally, earnings and sales growth are expected to improve for small caps in 2024 and outpace that of large caps, which we believe provides further fundamental support and potential upside for the asset class. A peak in US large cap market concentration has also historically been followed by sustained small cap outperformance. Small caps are less vulnerable to a top-heavy market, helping reduce the index’s sensitivity to individual company performance. Moreover, small caps tend to outperform large caps when inflation falls from high levels as well as during recovery periods coming out of economic downturns. Investors thinking of positioning around these trends may benefit from moving down in market capitalization, in our opinion.

Positioning

As always, we remain focused on long-term business fundamentals, even in the face of elevated short-term volatility. Our current positioning is a function of our bottom-up security selection process and our ability to identify what we view as attractive investment candidates, regardless of economic sector definitions. Overweights in Industrials and Information Technology are mostly a function of recent portfolio activity and the relative performance of our holdings in these sectors over the past few periods. Conversely, we continue to be underweight in Consumer Discretionary, as we have been unable to identify what we consider to be compelling long-term opportunities that fit our discipline given the rising risk profiles of many retail businesses and a potential deceleration in goods spending following a period of strength fueled in part by government backed stimulus payments. While the portfolio’s allocation to Health Care is modestly below that of the benchmark’s, we continue to remain underweight the Biotechnology industry as many companies within that group do not fit our discipline due to their elevated levels of binary risk. Given the rising levels of volatility and the apparent short-term disconnect between certain areas of the market and business fundamentals, we believe it is important to remain patient in identifying investment opportunities to ensure they offer a compelling risk-reward trade-off and a sufficient margin of safety. Furthermore, we remain focused on trying to understand the risks associated with each investment position within the context of our fundamentally oriented research process and managing those risks through a disciplined approach to portfolio construction and management.

Disclosures

The opinions expressed herein are those of Aristotle Capital Boston, LLC (Aristotle Boston) and are subject to change without notice.

Past performance is not indicative of future results. The information provided in this report should not be considered financial advice or a recommendation to purchase or sell any particular security. There is no assurance that any securities discussed herein will remain in an account’s portfolio at the time you receive this report or that securities sold have not been repurchased. The securities discussed may not represent an account’s entire portfolio and, in the aggregate, may represent only a small percentage of an account’s portfolio holdings. The performance attribution presented is of a representative account from Aristotle Boston’s Small Cap Equity Composite. The representative account is a discretionary client account which was chosen to most closely reflect the investment style of the strategy. The criteria used for representative account selection is based on the account’s period of time under management and its similarity of holdings in relation to the strategy. It should not be assumed that any of the securities transactions, holdings or sectors discussed were or will be profitable, or that the investment recommendations or decisions Aristotle Boston makes in the future will be profitable or equal the performance of the securities discussed herein. Aristotle Boston reserves the right to modify its current investment strategies and techniques based on changing market dynamics or client needs. Recommendations made in the last 12 months are available upon request.

Returns are presented gross and net of investment advisory fees and include the reinvestment of all income. Gross returns will be reduced by fees and other expenses that may be incurred in the management of the account. Net returns are presented net of actual investment advisory fees and after the deduction of all trading expenses.

Effective January 1, 2022, the Aristotle Small Cap Equity Composite has been redefined to exclude accounts with meaningful industry-specific restrictions or substantial values-based screens hampering implementation of the small cap strategy.

Effective January 1, 2022, the Russell 2000 Value Index was removed as the secondary benchmark for the Aristotle Capital Boston Small Cap Equity strategy.

All investments carry a certain degree of risk, including the possible loss of principal. Investments are also subject to political, market, currency and regulatory risks or economic developments. International investments involve special risks that may in particular cause a loss in principal, including currency fluctuation, lower liquidity, different accounting methods and economic and political systems, and higher transaction costs.

These risks typically are greater in emerging markets. Securities of small‐ and medium‐sized companies tend to have a shorter history of operations, be more volatile and less liquid. Value stocks can perform differently from the market as a whole and other types of stocks. The material is provided for informational and/or educational purposes only and is not intended to be and should not be construed as investment, legal or tax advice and/or a legal opinion. Investors should consult their financial and tax adviser before making investments.

The opinions referenced are as of the date of publication, may be modified due to changes in the market or economic conditions, and may not necessarily come to pass.

The firm’s coverage of Signature Bank includes time at a predecessor firm.

Aristotle Capital Boston, LLC is an independent investment adviser registered under the Investment Advisers Act of 1940, as amended. Registration does not imply a certain level of skill or training. More information about Aristotle Boston, including our investment strategies, fees and objectives, can be found in our Form ADV Part 2, which is available upon request. ACB-2310-17

Performance Disclosures

Sources: CAPS Composite Hub, Russell Investments

Composite returns for periods ended September 30, 2023 are preliminary pending final account reconciliation.

*The Aristotle Small Cap Equity Composite has an inception date of November 1, 2006 at a predecessor firm. During this time, Jack McPherson and Dave Adams had primary responsibility for managing the strategy. Performance starting January 1, 2015 was achieved at Aristotle Boston.

**For the period November 2006 through December 2006.

Past performance is not indicative of future results. Performance results for periods greater than one year have been annualized.

Effective January 1, 2022, the Aristotle Small Cap Equity Composite has been redefined to exclude accounts with meaningful industry-specific restrictions or substantial values-based screens hampering implementation of the small cap strategy.

Effective January 1, 2022, the Russell 2000 Value was removed as the secondary benchmark for the Aristotle Capital Boston Small Cap Equity strategy.

Returns are presented gross and net of investment advisory fees and include the reinvestment of all income. Gross returns will be reduced by fees and other expenses that may be incurred in the management of the account. Net returns are presented net of actual investment advisory fees and after the deduction of all trading expenses. Please see important disclosures enclosed within this document.

Index Disclosures

The Russell 2000® Index measures the performance of the small cap segment of the U.S. equity universe. The Russell 2000 Index is a subset of the Russell 3000® Index representing approximately 10% of the total market capitalization of that index. It includes approximately 2000 of the smallest securities based on a combination of their market cap and current index membership. The Russell 2000 Growth® Index measures the performance of the small cap companies located in the United States that also exhibit a growth probability. The Russell 2000 Value® Index measures the performance of the small cap companies located in the United States that also exhibit a value probability. The Russell 1000® Index measures the performance of the large cap segment of the U.S. equity universe. The Russell 1000 Index is a subset of the Russell 3000® Index, representing approximately 90% of the total market capitalization of that index. It includes approximately 1,000 of the largest securities based on a combination of their market capitalization and current index membership. The volatility (beta) of the composite may be greater or less than the benchmarks. It is not possible to invest directly in these indices.

For more on Small Cap Equity, access the latest resources.

ARISTOTLE CAPITAL BOSTON, LLC

Markets Review

The Russell 2500 reversed course after rising 4.97% in the month of July, falling -9.29% in August and September, and closing out the quarter with a return of -4.78%. Performance was weaker down the cap spectrum with the Russell 2500 trailing the Russell 1000 for the third consecutive quarter, bringing the year-to-date gap between the two indices to 9.42% in favor of large caps. In spite of large caps recent streak of outperformance, many have noted the narrowness of the large cap market rally this year, with a select group of mega cap stocks coined the ‘Magnificent 7’ having driven the vast majority of large cap index gains so far this year. Surging oil prices and treasury yields, a broader and more protracted United Auto Workers strike, and the resumption of student loan payments all contributed to  subdued market sentiment into quarter end. On the policy front, even as decades-high inflation showed meaningful signs of slowing, the Fed disappointed some investors’ expectations of a quick pivot to cutting rates. Instead, the central bank indicated its resolve to keep interest rates higher for longer in mid-June, deciding to hold off on raising interest rates as it takes stock of how its prior rate hikes are impacting the real economy.

Stylistically, value stocks proved relatively resilient versus their more expensive growth counterparts during the quarter as evidenced by the Russell 2500 Value Index returning -3.66% compared to –6.84% for the Russell 2500 Growth Index. The gap between the two styles remains elevated on a year-to-date basis, however, with the Russell 2500 Growth Index having outperformed its value counterpart by 3.68% so far in 2023.

At the sector level, nine of the eleven sectors in the Russell 2500 Index generated negative returns during the third quarter and only four sectors generated returns ahead of the broader index, representing a second consecutive quarter of narrow sector leadership for the Index. Energy and Financials were the only sectors to deliver positive returns during the period with returns of 17.18% and 1.31%, respectively. Health Care (-14.22%) and Communication Services (-11.18%) both ended the quarter with double digit declines and are lagging the Index on a year-to-date basis.

Sources: CAPS Composite Hub, Russell Investments

Past performance is not indicative of future results. Returns are presented gross and net of investment advisory fees and include the reinvestment of all income. Gross returns will be reduced by fees and other expenses that may be incurred in the management of the account. Net returns are presented net of actual investment advisory fees and after the deduction of all trading expenses. Aristotle Small Cap Equity Composite returns are preliminary pending final account reconciliation. Please see important disclosures at the end of this document.

Performance Review

For the third quarter of 2023, the Aristotle Small/Mid Cap Equity Composite generated a total return of -3.54% net of fees (-3.40% gross of fees), outperforming the -4.78% total return of the Russell 2500 Index. Outperformance was driven by a combination of security selection and allocation effects. Overall, security selection was strongest within the Health Care, Information Technology, and Industrials sectors and weakest in Financials, Consumer Discretionary and Consumer Staples. From an allocation perspective, underweights in Consumer Discretionary and Real Estate contributed to relative returns but were modestly offset by an overweight in Health Care and an underweight in Financials.

Relative ContributorsRelative Detractors
MACOM Technology SolutionsDycom
Huron Consulting GroupEuronet Worldwide
OceaneeringWolverine World Wide
Diamondback EnergyMerit Medical Systems
Range ResourcesMonro

CONTRIBUTORS

MACOM Technology Solutions (MTSI), a designer and manufacturer of high-performance semiconductor products, appreciated amid strength within its Industrial and Defense segment along with positive commentary around future AI data center demand.  We maintain our position, as we believe the company’s meaningful exposure to growing demand from Data Center and 5G end market applications along with the integration of recent acquisitions should drive additional shareholder value in periods to come.

Huron Consulting Group (HURN), a specialty consulting company that provides financial, operational, and digital consulting services to health care, education and commercial clients, appreciated after delivering strong results highlighted by continued momentum within the company’s health care and education segments. We maintain our investment, as we believe the company remains well-positioned to capitalize on a demand backdrop aided by financial and operational pressures in its largest end-markets, along with secular tailwinds supporting digital transformation, analytics and cloud consulting.

DETRACTORS

Dycom (DY), a provider of engineering and construction services to the telecommunications and cable television industries, declined amid uncertainty regarding near term customer capital spending initiatives and their ensuing impact on fiber capex plans. We maintain a position as we believe the company remains well positioned for longer term growth alongside secular trends for expanding fiber deployments to support faster broadband connectivity speeds and opportunities to deploy fiber to rural or underserved areas across the country.

Euronet Worldwide (EEFT), a provider of electronic payment and financial transaction solutions, declined during the period amid inflationary pressures and rising travel costs, leaving consumers with fewer funds for discretionary tourism spending and ultimately resulting in a negative impact on its Electronic Funds Transfer segment. We maintain our investment, as we believe the company’s expansion into mobile and digital payments combined with a continued recovery in international travel can benefit shareholders in the periods to come.

Recent Portfolio Activity

Buys/AcquisitionsSells/Liquidations
Patterson-UTI EnergyCalAmp
TKO Group HoldingsNexTier Oilfield Solutions
World Wrestling Entertainment

BUYS/ACQUISITIONS

Patterson-UTI Energy (PTEN), an oilfield services company focused on drilling and pressure pumping solutions was added to the portfolio following its merger with NexTier Oilfield Solutions. Overall, we maintain a positive view on the business combination as the merging of the two entities creates a comprehensive drilling and completions franchise with leadership positions in contract drilling, pressure pumping and directional drilling. Furthermore, we believe the company will benefit from greater size and scale, synergistic cost savings initiatives, and a more diversified suite of offerings to serve its customers.

TKO Group Holdings (TKO), a global sports and entertainment company formed through the merger of UFC and WWE, was added to the portfolio during the quarter. With assets spanning media & content, live events, sponsorship and licensing, we believe the company should be able to continue to capitalize on the booming global sports and entertainment ecosystem. Additionally, we believe the company’s diverse global fan base and strategic international expansion plans position the company well amidst favorable industry growth trends and an ever-evolving media rights landscape.

SELLS/LIQUIDATIONS

CalAmp (CAMP), a supplier of Mobile Resource Management solutions that allow for the remote collection of data from vehicles and other assets was removed from the portfolio during the quarter. In spite of the company’s efforts to convert its customer base from a hardware to subscription model, redesign its customer support systems, and introduce new products in recent years, a variety of factors contributed to the harvesting of these efforts being pushed out, unfavorably impacting the risk-reward profile of the business. Therefore, we decided to eliminate the position.

NexTier Oilfield Solutions (NEX), a provider of hydraulic fracturing and other completion-oriented oilfield services to exploration and production companies in the U.S. was removed from the portfolio by virtue of its merger with Patterson-UTI Energy.

World Wrestling Entertainment (WWE), an integrated media and entertainment company, was removed from the portfolio following its merger with Endeavor Group-owned UFC. The new publicly listed company that will combine the two entities will operate under the name TKO Group Holdings.

Outlook

Outside of a few major surprises, including the regional banking situation and an overly optimistic period of AI euphoria, it is perhaps surprising how little market risks and narratives have shifted over the last nine months. The two big uncertainties that many investors highlighted at the start of the year (i) whether inflation would persist and, (ii) whether there would be a recession, remain largely unresolved. While it is clear in the hard data that inflation has dropped over the course of the year, recent readings remain uncomfortably above the Federal Reserve’s target levels. Rapid increases in food and energy prices also persisted throughout the quarter fueling further uncertainty in the outlook. On the economy, the consensus view at the start of 2023 was that we were heading into a recession, with the only questions being when it would kick in, and how deep it would be. To this point, those questions still remain. One reason for market resiliency this year has been the performance of the economy, which has managed to not only avoid a recession to this point but also deliver strong employment numbers. Against this uncertain backdrop, the market may continue swinging between wild optimism, where inflation is no longer viewed as a threat and the economy has a soft landing, and extreme pessimism, where inflation comes roaring back, and the economy falls into a recession. Because of the difficulty in forecasting these macroeconomic outcomes, we have always strived to avoid making such predictions. Instead, we will – as always – stay focused on forecasting the underlying fundamentals of the companies in which we invest rather than making top-down investment or portfolio decisions. We do, however, believe that a normalization of financial conditions through higher rates (nominal and real) and QT should result in a more favorable market environment for quality companies with strong fundamentals better than it had been in the years leading up to, and through the pandemic/2021 period during which “Easy Money Policy” distorted market and style dynamics. Thus far in 2023, including the third quarter, we have seen short-term periods where more reasonably valued companies have recovered on a relative basis, but this has not been a linear shift in the market as much of the first half rally was more sentiment-driven than fundamentally supported, in our view. Ultimately, we believe business fundamentals and valuations are the key determinants of investment returns over extended periods and that remains our focus.

From an asset class perspective, valuations of small versus large continue to remain near multi-decade lows, which we believe suggests a more favorable setup for small caps relative to large caps in the periods to come (13.2x P/E for the Russell 2500 Index vs. 21.2x P/E for the Russell 1000 Index). Based upon relative P/E alone, there has been no other time in the Russell 2500’s history that has been as attractive relative to large cap as in recent times. Additionally, earnings and sales growth are expected to improve for small & mid caps in 2024 and outpace that of large caps, which we believe provides further fundamental support and potential upside for the asset class. A peak in US large-cap market concentration has also historically been followed by sustained small & mid cap outperformance. Small & mid caps are less vulnerable to a top-heavy market, helping reduce the index’s sensitivity to individual company performance. Moreover, small & mid caps tend to outperform large caps when inflation falls from high levels as well as during recovery periods coming out of economic downturns. Investors thinking of positioning around these trends may benefit from moving down in market capitalization, in our opinion.

Positioning

As always, we remain focused on long-term business fundamentals, even in the face of elevated short-term volatility. Our current positioning is a function of our bottom-up security selection process and our ability to identify what we view as attractive investment candidates, regardless of economic sector definitions. Overweights in Industrials and Information Technology are mostly a function of recent portfolio activity and the relative performance of our holdings in these sectors over the past few periods. Conversely, we continue to be underweight in Consumer Discretionary, as we have been unable to identify what we consider to be compelling long-term opportunities that fit our discipline given the rising risk profiles of many retail businesses and a potential deceleration in goods spending following a period of strength fueled in part by government backed stimulus payments. We also continue to be underweight in Real Estate as a result of structural challenges for various end markets within the sector. Given our focus on long-term business fundamentals, patient investment approach and low portfolio turnover, the strategy’s sector positioning generally does not change significantly from quarter to quarter. However, we may take advantage of periods of volatility by adding selectively to certain companies when appropriate.

Disclosures

The opinions expressed herein are those of Aristotle Capital Boston, LLC (Aristotle Boston) and are subject to change without notice.

Past performance is not indicative of future results. The information provided in this report should not be considered financial advice or a recommendation to purchase or sell any particular security. There is no assurance that any securities discussed herein will remain in an account’s portfolio at the time you receive this report or that securities sold have not been repurchased. The securities discussed may not represent an account’s entire portfolio and, in the aggregate, may represent only a small percentage of an account’s portfolio holdings. The performance attribution presented is of a representative account from Aristotle Boston’s Small/Mid Cap Equity Composite. The representative account is a discretionary client account which was chosen to most closely reflect the investment style of the strategy. The criteria used for representative account selection is based on the account’s period of time under management and its similarity of holdings in relation to the strategy. It should not be assumed that any of the securities transactions, holdings or sectors discussed were or will be profitable, or that the investment recommendations or decisions Aristotle Boston makes in the future will be profitable or equal the performance of the securities discussed herein. Aristotle Boston reserves the right to modify its current investment strategies and techniques based on changing market dynamics or client needs. Recommendations made in the last 12 months are available upon request.

Returns are presented gross and net of investment advisory fees and include the reinvestment of all income. Gross returns will be reduced by fees and other expenses that may be incurred in the management of the account. Net returns are presented net of actual investment advisory fees and after the deduction of all trading expenses.

Effective January 1, 2022, the Russell 2500 Value Index was removed as the secondary benchmark for the Aristotle Boston Small/Mid Cap Equity strategy.

Non-fee-paying accounts represented less than 5% of the SMID Cap Composite assets from December 31, 2010 to December 31, 2013. As of December 31, 2014, there were no non-fee-paying accounts in the Composite. In instances where non-fee paying accounts were included in the SMID Cap Composite, the highest model fee was applied to recalculate the net returns for composite purposes and the impact on the since inception return of the composite was deemed immaterial.

All investments carry a certain degree of risk, including the possible loss of principal. Investments are also subject to political, market, currency and regulatory risks or economic developments. International investments involve special risks that may in particular cause a loss in principal, including currency fluctuation, lower liquidity, different accounting methods and economic and political systems, and higher transaction costs.

These risks typically are greater in emerging markets. Securities of small‐ and medium‐sized companies tend to have a shorter history of operations, be more volatile and less liquid. Value stocks can perform differently from the market as a whole and other types of stocks.

The material is provided for informational and/or educational purposes only and is not intended to be and should not be construed as investment, legal or tax advice and/or a legal opinion. Investors should consult their financial and tax adviser before making investments.

The opinions referenced are as of the date of publication, may be modified due to changes in the market or economic conditions, and may not necessarily come to pass.

The firm’s coverage of Signature Bank includes time at a predecessor firm.

Aristotle Capital Boston, LLC is an independent investment adviser registered under the Investment Advisers Act of 1940, as amended. Registration does not imply a certain level of skill or training. More information about Aristotle Boston, including our investment strategies, fees and objectives, can be found in our Form ADV Part 2, which is available upon request. ACB-2310-18

Performance Disclosures

Sources: CAPS Composite Hub, Russell Investments

Composite returns for periods ended September 30, 2023 are preliminary pending final account reconciliation.

*The Aristotle Small/Mid Cap Equity Composite has an inception date of January 1, 2008 at a predecessor firm. During this time, Jack McPherson and Dave Adams had primary responsibility for managing the strategy. Performance starting January 1, 2015 was achieved at Aristotle Boston.

Effective January 1, 2022, the Russell 2500 Value Index was removed as the secondary benchmark for the Aristotle Boston Small/Mid Cap Equity Strategy.  Non-fee-paying accounts represented less than 5% of the SMID Cap Composite assets from December 31, 2010 to December 31, 2013. As of December 31, 2014, there were no non-fee-paying accounts in the Composite. In instances where non-fee paying accounts were included in the SMID Cap Composite, the highest model fee was applied to recalculate the net returns for composite purposes and the impact on the since inception return of the composite was deemed immaterial. Past performance is not indicative of future results. Performance results for periods greater than one year have been annualized.

Returns are presented gross and net of investment advisory fees and include the reinvestment of all income. Gross returns will be reduced by fees and other expenses that may be incurred in the management of the account. Net returns are presented net of actual investment advisory fees and after the deduction of all trading expenses. Please see important disclosures enclosed within this document.

Index Disclosures

The Russell 2500 Index is a subset of the Russell 3000® Index representing approximately 10% of the total market capitalization of that index. It includes approximately 2000 of the smallest securities based on a combination of their market cap and current index membership. The Russell 2500 Growth® Index measures the performance of the small/mid cap companies located in the United States that also exhibit a growth probability. The Russell 2500 Value® Index measures the performance of the small/mid cap companies located in the United States that also exhibit a value probability. The Russell 1000 Index is a subset of the Russell 3000® Index, representing approximately 90% of the total market capitalization of that index. It includes approximately 1,000 of the largest securities based on a combination of their market capitalization and current index membership. The volatility (beta) of the composite may be greater or less than the benchmarks. It is not possible to invest directly in these indices.

For more on Small Cap Equity, access the latest resources.

(All MSCI index returns are shown net and in U.S. dollars unless otherwise noted.)

Markets Review

Sources: CAPS CompositeHubTM, Bloomberg
Past performance is not indicative of future results. Aristotle International Equity Composite returns are presented gross and net of investment advisory fees and include the reinvestment of all income. Gross returns will be reduced by fees and other expenses that may be incurred in the management of the account. Net returns are presented net of actual investment advisory fees and after the deduction of all trading expenses. Aristotle Capital Composite returns are preliminary pending final account reconciliation. Please see important disclosures at the end of this document.

After three consecutive positive quarters, global equity markets reversed, as the MSCI ACWI Index fell 3.40% during the period. Concurrently, the Bloomberg Global Aggregate Bond Index decreased 3.59%. In terms of style, value stocks outperformed their growth counterparts during the quarter, with the MSCI ACWI Value Index beating the MSCI ACWI Growth Index by 3.13%.

Both regionally and on a sector basis, declines were broad-based. Asia/Pacific ex-Japan and Europe were the worst performers, while Latin America, the only region to post a positive return, and Japan were the best. Meanwhile, nine out of the eleven sectors within the MSCI ACWI Index posted losses, with Utilities, Real Estate and Consumer Staples being the worst performers. Energy and Communication Services finished in the green, while Financials declined the least.

Although global financial markets experienced less turmoil than they did earlier this year, inflation remains elevated and economic data remains weak. In fact, the IMF forecast global GDP growth to decline to 3.0% in 2023.

China’s recovery remained sluggish amid an ongoing property slump and lackluster consumer spending. Meanwhile, high levels of inflation persisted across many regions of the world, although inflation in the U.S., eurozone and the U.K. eased significantly from levels seen earlier in the year. As such, the IMF trimmed its global inflation projection to 6.8% from its prior estimate of 7.0% in April but warned inflation could remain high or reaccelerate due to factors such as geopolitics and weather-related events.

By contrast, in Asia, Japanese inflation edged down to 3.2% in August, and the Bank of Japan diverged from its Western counterparts by keeping short-term interest rates steady. China also took an easier approach to its monetary policy, cutting both short- and medium-term lending rates, as the country has struggled to recover following the pandemic. The People’s Bank of China hopes to combat weak consumer spending, falling exports and the country’s real estate crisis. Chinese property developers have come under increased scrutiny, as Evergrande filed for bankruptcy protection in the U.S. while Country Garden warned investors of significant losses.

On the geopolitical front, Ukraine continues to push its counteroffensive in the eastern and southern portions of the country. Western nations have largely remained dedicated to their support of Ukraine, as countries such as the U.S., Canada and the U.K. have all pledged to provide additional aid. In Taiwan, China carried out military exercises in the Taiwan Strait following the Taiwanese vice president’s visit to New York and San Francisco. Despite tense relations between the U.S. and China, the Biden Administration announced $345 million in military aid for Taiwan.

Performance and Attribution Summary

For the third quarter of 2023, Aristotle Capital’s Global Equity Composite posted a total return of -4.06% gross of fees (-4.13% net of fees), underperforming the MSCI World Index, which returned -3.46%, and the MSCI ACWI Index, which returned -3.40%. Please refer to the table below for detailed performance.

Performance (%) 3Q23YTD1 Year3 Years5 Years10 Years Since Inception*
Global Equity Composite (gross)-4.067.3020.997.797.518.929.26
Global Equity Composite (net)-4.137.0520.627.467.168.548.83
MSCI World Index (net)-3.4611.1021.958.087.258.268.82
MSCI ACWI Index (net)-3.4010.0620.806.896.467.557.92
*The inception date for the Global Equity Composite is November 1, 2010. Past performance is not indicative of future results. Aristotle Global Equity Composite returns are presented gross and net of investment advisory fees and include the reinvestment of all income. Gross returns will be reduced by fees and other expenses that may be incurred in the management of the account. Net returns are presented net of actual investment advisory fees and after the deduction of all trading expenses. Aristotle Capital Composite returns are preliminary pending final account reconciliation. Please see important disclosures at the end of this document.

Source: FactSet

Past performance is not indicative of future results. Attribution results are based on sector returns which are gross of investment advisory fees. Attribution is based on performance that is gross of investment advisory fees and includes the reinvestment of income.

From a sector perspective, the portfolio’s underperformance relative to the MSCI World Index can be attributed to security selection, while allocation effects had a positive impact. Security selection in Materials, Consumer Discretionary and Information Technology detracted the most from the portfolio’s relative performance. Conversely, security selection in Health Care and Energy and a lack of exposure to Utilities contributed to relative return.

Regionally, both allocation effects and security selection were responsible for the portfolio’s underperformance relative to the MSCI World Index. Security selection in Europe and our exposure in Emerging Markets detracted the most from relative performance, while an overweight in Japan contributed.

Contributors and Detractors for 3Q 2023

Relative ContributorsRelative Detractors
CamecoFMC
AmgenLVMH
TotalEnergiesFANUC
FirstCashNemetschek
OshkoshMicrochip Technology

Japan-based FANUC, the global manufacturer of industrial robots as well as control systems for machine tools, was a primary detractor for the period. During the June quarter, orders for the company’s robots fell 23% year-on-year following ten consecutive quarters of annual increases. This abrupt decline may have been due to inventory adjustments in China and the Americas as many manufacturers became more cautious over capital investments. Looking past the short-term headwinds, we will continue to monitor the company’s progress shifting its revenue mix toward higher-margin service and IoT capabilities, which should improve profitability. This includes its FIELD platform, which offers predictive maintenance, optimization and self-learning that customers can utilize to reduce production downtime and energy costs. Moreover, we believe long-term prospects for the company are underappreciated since FANUC, as the industrial robot market leader, is uniquely positioned to benefit from further penetration of factory automation and robot usage across geographies.

Microchip Technology, the microcontroller (MCU) and analog semiconductor producer, was a primary detractor for the period. Despiteposting record levels of sales, margins and gross profit, management indicated it expects a challenging near-term demand environment due to weakness in China, a slowdown in Europe and early signs of weakness in auto. The company has also accommodated some push-out requests from customers, which will translate into lower sales for the coming months. Despite operating in a cyclical industry, Microchip has been able to generate 15+ years of robust FREE cash flow and margins, while lowering its debt (has paid down $6.8 billion of debt over the last 20 quarters, reducing net leverage to 1.29x) and consistently returning money to shareholders. This, we believe, speaks to management’s proven ability to manage the business through economic cycles, while taking advantage of its broad portfolio to continue gaining share in areas including IoT, 5G infrastructure, autonomous driving and data centers.

Amgen, the biopharmaceutical company, was one of the top contributors for the quarter. The company continues to leverage its innovative platform to strengthen its product portfolio, offset maturing products, such as Epogen and Neulasta, and increase market share. Over the past year, Amgen has reported double-digit volume growth, operating margin expansion to over 40% and record levels of sales for cholesterol drug Repatha, bone-strengthening drug Prolia and cancer drug Blincyto. Additionally, the company remains well positioned to benefit from the continued development and commercialization of biosimilars such as Amgevita, the first biosimilar to Humira, and the successful integration of Otezla to bolster its inflammation segment. Lastly, the FTC agreed to allow Amgen to proceed with its $27.8 billion acquisition of Horizon Therapeutics. We note that this is yet another unsuccessful attempt by the FTC to block an M&A transaction of one of our holdings (see below re: Activision Blizzard). The transaction closed on October 6, 2023 and brings expertise in rare disease therapies (including bulging eye-drug Tepezza), as well as adds to Amgen’s immunology portfolio.

TotalEnergies, one of the world’s largest energy companies, was also a primary contributor for the quarter. The company continues to execute on its strategic plan to reach net-zero emissions by 2050 which, in contrast to many European energy providers, it looks to achieve through expanding ownership of renewable power and low-carbon assets rather than purely divestment. The company expects to more than double its gross renewable generation capacity by 2025 (primarily in solar) and invest over 30% of its total spending in low-carbon businesses through 2030. As such, we believe TotalEnergies is uniquely positioned to benefit from the increase in global demand for clean energy. In recent years, TotalEnergies’ reduction in capex and operating expenses has improved its FREE cash flow generation, now further aided by the favorable energy environment. This has supported its continued ability to return cash to shareholders, one of our catalysts, as demonstrated by the $3.8 billion returned through share buybacks and dividends during the second quarter.

Recent Portfolio Activity

BuysSells
Jazz PharmaceuticalsMagna International

During the quarter, we sold our position in Magna International and invested in a new position, Jazz Pharmaceuticals.

We first invested in Magna International, a Canada-based global auto parts, systems and assembly company, in the first quarter of 2020. The company, in our opinion, has a unique capability of supplying parts for an increasingly electrified and autonomous fleet of vehicles. This includes Magna’s specialty in lightweighting vehicles—a necessity for heavy electric cars—as well as its years of investment in self-driving technologies. In addition, with leading market share positions in many of its core markets and products, we believe Magna remains well positioned to benefit as content-per-vehicle increases and automotive parts and systems become more complex. Though the company continues to meet each of our criteria for investment, we decided to exit our position in Magna to fund our purchase of Jazz Pharmaceuticals, which we view as a more optimal investment.

Jazz Pharmaceuticals plc

Founded in 2003, Jazz Pharmaceuticals is a global biopharmaceutical company headquartered in Ireland. The drugmaker’s portfolio of nine approved products focuses on conditions with limited therapeutic treatments in neuroscience (~75% of 2022 revenue) and oncology (~25%).

Jazz’s drug Xyrem was added to its portfolio in 2005 and was approved for use in patients with narcolepsy. The drug’s strong efficacy propelled it to be the standard of care for this incurable sleep condition and has achieved wide adoption for the treatment of excessive daytime sleepiness and cataplexy (episodes of loss of muscle control).

Xyrem’s patent exclusivity ended in January 2023, and authorized generic versions of the product have entered the market. To prepare for the patent cliff, the company developed Xywav, a lower-sodium version of Xyrem, which is touted for its potentially better heart safety. The drug has received FDA approval for the treatment of narcolepsy and idiopathic hypersomnia and has orphan drug exclusivity through 2027.

Jazz has focused on adding new products to its portfolio through both internal innovation and acquisitions. At the end of 2022, 63% of Jazz’s net product sales were generated from products launched or acquired over the past three years, while 75% of net product sales were generated by a single drug—Xyrem—in 2018. Within oncology, Jazz received recent approvals for Zepzelca (for small cell lung cancer) and Rylaze (for acute lymphoblastic leukemia). In addition, through the acquisition of GW Pharmaceuticals in 2021, Jazz added Epidiolex for the treatment of severe (and rare) forms of epilepsy.

High-Quality Business

Some of the quality characteristics we have identified for Jazz Pharmaceuticals include: 

  • Decades of success developing and marketing novel treatments for rare conditions using biopharmaceuticals;
  • Jazz’s extensive network of sleep doctors provides the company with a competitive edge to promote new therapies;
  • History of strong FREE cash flow generation with a track record of accretive acquisitions; and
  • Pricing power, as the company’s key drugs treat rare diseases where alternative options are limited.

Attractive Valuation

Based on our estimates, shares of the company are attractively valued. We believe continued market share gains for several of the company’s therapies will lead to higher levels of normalized FREE cash flow than are currently appreciated by the market. Though not (yet) incorporated into our estimates, we view the company’s strong neuroscience and oncology pipeline assets as “free options.”

Compelling Catalysts

Catalysts we have identified for Jazz Pharmaceuticals, which we believe will cause its stock price to appreciate over our three- to five-year investment horizon, include:

  • Continued market share gains for Xywav, as this recently released drug has already achieved market-leading adoption in narcolepsy and increased patient usage for idiopathic hypersomnia;
  • Increased penetration of Epidiolex, which has demonstrated strong efficacy and where there are limited therapeutic substitutes for the rare forms of epilepsy it treats; and
  • Further uptake of Zepzelca—a well-established, second-line cancer treatment that is also being studied for potential usage as a first-line treatment.

Conclusion

Rather than attempting to predict short-term market dynamics, at Aristotle Capital, we stay focused on understanding company fundamentals while carefully monitoring the long-term evolution of our portfolio of holdings. Our approach to understanding individual businesses reveals more insightful conclusions than would undue time spent concentrating on ever-changing and often unclear macroeconomic signals. While we strive to remain macro aware, our goal instead is to invest in businesses which are run by what we believe are capable and proven management teams that have the skill to navigate changing factors such as inflation, interest rates and government policy. We also analyze how such factors could alter the fundamentals of a business and whether those impacts are long term in nature.

We aim to find companies with high-quality characteristics that can succeed over full market cycles. It is our belief that a disciplined, research-oriented approach to finding great companies, as well as a consistent, well-executed portfolio management process, is how we can add the most value for our clients.

Disclosures

The opinions expressed herein are those of Aristotle Capital Management, LLC (Aristotle Capital) and are subject to change without notice. Past performance is not a guarantee or indicator of future results. This material is not financial advice or an offer to buy or sell any product. You should not assume that any of the securities transactions, sectors or holdings discussed in this report were or will be profitable, or that recommendations Aristotle Capital makes in the future will be profitable or equal the performance of the securities listed in this report. The portfolio characteristics shown relate to the Aristotle Global Equity strategy. Not every client’s account will have these characteristics. Aristotle Capital reserves the right to modify its current investment strategies and techniques based on changing market dynamics or client needs. There is no assurance that any securities discussed herein will remain in an account’s portfolio at the time you receive this report or that securities sold have not been repurchased. The securities discussed may not represent an account’s entire portfolio and, in the aggregate, may represent only a small percentage of an account’s portfolio holdings. The performance attribution presented is of a representative account from Aristotle Capital’s Global Equity Composite. The representative account is a discretionary client account which was chosen to most closely reflect the investment style of the strategy. The criteria used for representative account selection is based on the account’s period of time under management and its similarity of holdings in relation to the strategy. Recommendations made in the last 12 months are available upon request.

Returns are presented gross and net of investment advisory fees and include the reinvestment of all income. Gross returns will be reduced by fees and other expenses that may be incurred in the management of the account. Net returns are presented net of actual investment advisory fees and after the deduction of all trading expenses.

All investments carry a certain degree of risk, including the possible loss of principal. Investments are also subject to political, market, currency and regulatory risks or economic developments. International investments involve special risks that may in particular cause a loss in principal, including currency fluctuation, lower liquidity, different accounting methods and economic and political systems, and higher transaction costs. These risks typically are greater in emerging markets. Securities of small‐ and medium‐sized companies tend to have a shorter history of operations, be more volatile and less liquid. Value stocks can perform differently from the market as a whole and other types of stocks.

The material is provided for informational and/or educational purposes only and is not intended to be and should not be construed as investment, legal or tax advice and/or a legal opinion. Investors should consult their financial and tax adviser before making investments. The opinions referenced are as of the date of publication, may be modified due to changes in the market or economic conditions, and may not necessarily come to pass. Information and data presented has been developed internally and/or obtained from sources believed to be reliable. Aristotle Capital does not guarantee the accuracy, adequacy or completeness of such information.

Aristotle Capital Management, LLC is an independent investment adviser registered under the Investment Advisers Act of 1940, as amended. Registration does not imply a certain level of skill or training. More information about Aristotle Capital, including our investment strategies, fees and objectives, can be found in our Form ADV Part 2, which is available upon request. ACM-2310-34

Performance Disclosures

Composite returns for all periods ended September 30, 2023 are preliminary pending final account reconciliation.

The Aristotle Global Equity Composite has an inception date of November 1, 2010; however, the strategy initially began at Howard Gleicher’s predecessor firm in July 2007. A supplemental performance track record from January 1, 2008 through October 31, 2010 is provided on this page and complements the Global Equity Composite presentation that is located at the end of this presentation. The performance results were achieved while Mr. Gleicher managed the strategy at a prior firm. The returns are those of a publicly available mutual fund from the fund’s inception through Mr. Gleicher’s departure from the firm. During that time, Mr. Gleicher had primary responsibility for managing the fund.

Past performance is not indicative of future results. The information provided should not be considered financial advice or a recommendation to purchase or sell any particular security or product. Performance results for periods greater than one year have been annualized.

Returns are presented gross and net of investment advisory fees and include the reinvestment of all income. Gross returns will be reduced by fees and other expenses that may be incurred in the management of the account. Net returns are presented net of actual investment advisory fees and after the deduction of all trading expenses

Index Disclosures

The MSCI World Index is a free float-adjusted market capitalization weighted index that is designed to measure the equity market performance of developed markets. The MSCI World Index consists of the following 23 developed market country indexes: Australia, Austria, Belgium, Canada, Denmark, Finland, France, Germany, Hong Kong, Ireland, Israel, Italy, Japan, Netherlands, New Zealand, Norway, Portugal, Singapore, Spain, Sweden, Switzerland, the United Kingdom and the United States. The MSCI Emerging Markets Index is a free float-adjusted market capitalization-weighted index that is designed to measure equity market performance of emerging markets. The MSCI Emerging Markets Index consists of the following 24 emerging market country indexes: Brazil, Chile, China, Colombia, Czech Republic, Egypt, Greece, Hungary, India, Indonesia, Korea, Kuwait, Malaysia, Mexico, Peru, Philippines, Poland, Qatar, Saudi Arabia, South Africa, Taiwan, Thailand, Turkey and United Arab Emirates. The MSCI ACWI captures large and mid-cap representation across 23 developed markets and 24 emerging markets countries. With approximately 3,000 constituents, the Index covers approximately 85% of the global investable equity opportunity set. The MSCI ACWI Growth Index captures large and mid-cap securities exhibiting overall growth style characteristics across 23 developed markets countries and 24 emerging markets countries. The MSCI ACWI Value Index captures large and mid-cap securities exhibiting overall value style characteristics across 23 developed markets countries and 24 emerging markets countries. The MSCI Europe Index captures large and mid-cap representation across 15 developed markets countries in Europe. With more than 400 constituents, the Index covers approximately 85% of the free float-adjusted market capitalization across the European developed markets equity universe. The MSCI Japan Index is designed to measure the performance of the large and mid-cap segments of the Japanese market. With approximately 250 constituents, the Index covers approximately 85% of the free float-adjusted market capitalization in Japan. The S&P 500® Index is the Standard & Poor’s Composite Index of 500 stocks and is a widely recognized, unmanaged index of common stock prices. The NYSE FAANG+ Index is an equal-dollar-weighted index designed to represent a segment of the Information Technology and Consumer Discretionary sectors consisting of highly traded growth stocks of technology and tech-enabled companies, such as Meta, Apple, Amazon, Netflix and Alphabet’s Google. The Bloomberg Global Aggregate Bond Index is a flagship measure of global investment grade debt from 28 local currency markets. This multi-currency benchmark includes Treasury, government-related, corporate and securitized fixed rate bonds from both developed and emerging markets issuers. The Brent Crude Oil Index is a major trading classification of sweet light crude oil that serves as a major benchmark price for purchases of oil worldwide. The volatility (beta) of the Composite may be greater or less than the benchmarks. It is not possible to invest directly in these indexes.

(All MSCI index returns are shown net and in U.S. dollars unless otherwise noted.)

Markets Review

Sources: CAPS CompositeHubTM, Bloomberg
Past performance is not indicative of future results. Aristotle International Equity Composite returns are presented gross and net of investment advisory fees and include the reinvestment of all income. Gross returns will be reduced by fees and other expenses that may be incurred in the management of the account. Net returns are presented net of actual investment advisory fees and after the deduction of all trading expenses. Aristotle Capital Composite returns are preliminary pending final account reconciliation. Please see important disclosures at the end of this document.

After three consecutive positive quarters, global equity markets reversed, as the MSCI ACWI Index fell  3.40% during the period. Concurrently, the Bloomberg Global Aggregate Bond Index decreased 3.59%. In terms of style, value stocks outperformed their growth counterparts during the quarter, with the MSCI ACWI Value Index beating the MSCI ACWI Growth Index by 3.13%.

The MSCI EAFE Index declined  4.11% during the third quarter, while the MSCI ACWI ex USA Index dropped  3.77%. Within the MSCI EAFE Index, Europe & Middle East and Asia were the worst-performing regions, while the U.K. declined the least. On a sector basis, nine out of the eleven sectors within the MSCI EAFE Index posted negative returns, with Information Technology, Utilities and Consumer Discretionary as the worst performers. Conversely, Energy and Financials posted positive returns, while Real Estate declined the least.

Although global financial markets experienced less turmoil than they did earlier this year, inflation remains elevated and economic data remains weak. In fact, the IMF forecast global GDP growth to decline to 3.0% in 2023.

China’s recovery remained sluggish amid an ongoing property slump and lackluster consumer spending. Meanwhile, high levels of inflation persisted across many regions of the world, although inflation in the U.S., eurozone and the U.K. eased significantly from levels seen earlier in the year.  Consistent with the progress, the IMF trimmed its global inflation projection to 6.8% from its prior estimate of 7.0% in April but warned inflation could remain high or reaccelerate due to factors such as geopolitics and weather-related events.

By contrast, in Asia, Japanese inflation edged down to 3.2% in August, and the Bank of Japan diverged from its Western counterparts by keeping short-term interest rates steady. China also took an easier approach to its monetary policy, cutting both short- and medium-term lending rates, as the country has struggled to recover following the pandemic. The People’s Bank of China hopes to combat weak consumer spending, falling exports and the country’s real estate crisis. Chinese property developers have come under increased scrutiny, as Evergrande filed for bankruptcy protection in the U.S. while Country Garden warned investors of significant losses.

On the geopolitical front, Ukraine continues to push its counteroffensive in the eastern and southern portions of the country. Western nations have largely remained dedicated to their support of Ukraine, as countries such as the U.S., Canada and the U.K. have all pledged to provide additional aid. In Taiwan, China carried out military exercises in the Taiwan Strait following the Taiwanese vice president’s visit to New York and San Francisco. Despite tense relations between the U.S. and China, the Biden Administration announced $345 million in military aid for Taiwan.

Performance and Attribution Summary

For the third quarter of 2023, Aristotle Capital’s International Equity Composite posted a total return of -4.53% gross of fees (-4.65% net of fees), underperforming the MSCI EAFE Index, which returned -4.11%, and the MSCI ACWI ex USA Index, which returned -3.77%. Please refer to the table below for detailed performance.

Performance (%) 3Q23YTD1 Year3 Years5 Years10 Years Since Inception*
International Equity Composite (gross)-4.537.3622.386.123.414.545.06
International Equity Composite (net)-4.656.9721.805.612.914.034.56
MSCI EAFE Index (net)-4.117.0825.655.753.243.822.16
MSCI ACWI ex USA Index (net)-3.775.3420.393.742.583.351.78
*The inception date for the International Equity Composite is January 1, 2008. Past performance is not indicative of future results. Aristotle International Equity Composite returns are presented gross and net of investment advisory fees and include the reinvestment of all income. Gross returns will be reduced by fees and other expenses that may be incurred in the management of the account. Net returns are presented net of actual investment advisory fees and after the deduction of all trading expenses. Aristotle Capital Composite returns are preliminary pending final account reconciliation. Please see important disclosures at the end of this document.

Source: FactSet

Past performance is not indicative of future results. Attribution results are based on sector returns which are gross of investment advisory fees. Attribution is based on performance that is gross of investment advisory fees and includes the reinvestment of income.

From a sector perspective in the third quarter, the portfolio’s underperformance relative to the MSCI EAFE Index can be attributed to both security selection and allocation effects. Security selection in Financials, Industrials and Materials detracted the most from the portfolio’s relative performance. Conversely, security selection in Consumer Discretionary, Energy and Consumer Staples contributed to relative return.

Regionally, security selection was responsible for the portfolio’s underperformance, while allocation effects had a positive impact. Security selection in the U.K. and exposure to Emerging Markets detracted from relative performance, while exposure to Canada and an underweight in Europe & Middle East contributed.

Contributors and Detractors for 3Q 2023

Relative ContributorsRelative Detractors
CamecoFANUC
Pan Pacific InternationalNemetschek
TotalEnergiesDassault Systèmes
Munich ReinsuranceLVMH
DBS GroupDSM-Firmenich

Japan-based FANUC, the global manufacturer of industrial robots as well as control systems for machine tools, was the largest detractor for the period. During the June quarter, orders for the company’s robots fell 23% year-on-year following ten consecutive quarters of annual increases. This abrupt decline may have been due to inventory adjustments in China and the Americas as many manufacturers became more cautious over capital investments. Looking past the short-term headwinds, we will continue to monitor the company’s progress shifting its revenue mix toward higher-margin service and IoT capabilities, which should improve profitability. This includes its FIELD platform, which offers predictive maintenance, optimization and self-learning that customers can utilize to reduce production downtime and energy costs. Moreover, we believe long-term prospects for the company are underappreciated since FANUC, as the industrial robot market leader, is uniquely positioned to benefit from further penetration of factory automation and robot usage across geographies.

LVMH Moët Hennessy Louis Vuitton, the luxury goods company, was a primary detractor for the quarter. After doubling sales over the past three years, LVMH is experiencing a slowdown, with organic growth in the recent semi-annual period of only 17%. Regionally, the luxury retail environment is mixed, as strong performance in Asia contrasts with softer demand in the U.S. and a lack of tourist activity from Chinese nationals. Additionally, the company maintained its long-term investment philosophy with increased advertising and promotional spending, which has pressured margins. Despite these near-term challenges, we believe LVMH’s actions will enhance profitability and expand market share in the long run. This includes the company’s continued shift toward Jewelry, which is now the business’s second-largest segment by profit, market share gains in the Selective Retailing segment due to strong performance from Sephora and DFS (Duty Free Shoppers), the successful integration of brands such as Christian Dior Couture, and ongoing integration of Tiffany & Co., which reopened its New York City flagship store “The Landmark” earlier this year.

Pan Pacific International, the Japanese discount and general merchandise retailer, was a top contributor for the period. After being closed for over two and a half years, Japan’s reopening has led to a sharp recovery in retail traffic. In response, Pan Pacific has implemented an aggressive strategy of increasing the number of cash registers and strengthening staffing to boost sales while also focusing on improving procurement capabilities, expanding its private label strategy and improving its inventory turnover. As a result of these actions, along with favorable weather and a strong holiday season, the company’s sales exceeded pre-pandemic levels, and operating margin eclipsed 5% for the first time in five years. Furthermore, we are encouraged by Pan Pacific’s announcement that it will accelerate the opening of new stores with 25 openings in Japan and 12 stores overseas this year. We believe Pan Pacific is well positioned to continue gaining market share in Japan, further penetrate the overseas market and maintain strong levels of profitability.

TotalEnergies, one of the world’s largest energy companies, was also a primary contributor for the quarter. The company continues to execute on its strategic plan to reach net-zero emissions by 2050 which, in contrast to many European energy providers, it looks to achieve through expanding ownership of renewable power and low-carbon assets rather than purely divestment. The company expects to more than double its gross renewable generation capacity by 2025 (primarily in solar) and invest over 30% of its total spending in low-carbon businesses through 2030. As such, we believe TotalEnergies is uniquely positioned to benefit from the increase in global demand for clean energy. In recent years, TotalEnergies’ reduction in capex and operating expenses has improved its FREE cash flow generation, now further aided by the favorable energy environment. This has supported its continued ability to return cash to shareholders, one of our catalysts, as demonstrated by the $3.8 billion returned through share buybacks and dividends during the second quarter.

Recent Portfolio Activity

BuysSells
NoneNone

Consistent with our long-term horizon and low turnover, there were no new purchases or sales completed during the quarter.

Conclusion

Rather than attempting to predict short-term market dynamics, at Aristotle Capital, we stay focused on understanding company fundamentals while carefully monitoring the long-term evolution of our portfolio of holdings. Our approach to understanding individual businesses reveals more insightful conclusions than would undue time spent concentrating on ever-changing and often unclear macroeconomic signals. While we strive to remain macro aware, our goal instead is to invest in businesses which are run by what we believe are capable and proven management teams that have the skill to navigate changing factors such as inflation, interest rates and government policy. We also analyze how such factors could alter the fundamentals of a business and whether those impacts are long term in nature.

We aim to find companies with high-quality characteristics that can succeed over full market cycles. It is our belief that a disciplined, research-oriented approach to finding great companies, as well as a consistent, well-executed portfolio management process, is how we can add the most value for our clients.

Disclosures

The opinions expressed herein are those of Aristotle Capital Management, LLC (Aristotle Capital) and are subject to change without notice. Past performance is not a guarantee or indicator of future results. This material is not financial advice or an offer to buy or sell any product. You should not assume that any of the securities transactions, sectors or holdings discussed in this report were or will be profitable, or that recommendations Aristotle Capital makes in the future will be profitable or equal the performance of the securities listed in this report. The portfolio characteristics shown relate to the Aristotle International Equity strategy. Not every client’s account will have these characteristics. Aristotle Capital reserves the right to modify its current investment strategies and techniques based on changing market dynamics or client needs. There is no assurance that any securities discussed herein will remain in an account’s portfolio at the time you receive this report or that securities sold have not been repurchased. The securities discussed may not represent an account’s entire portfolio and, in the aggregate, may represent only a small percentage of an account’s portfolio holdings. The performance attribution presented is of a representative account from Aristotle Capital’s International Equity Composite. The representative account is a discretionary client account which was chosen to most closely reflect the investment style of the strategy. The criteria used for representative account selection is based on the account’s period of time under management and its similarity of holdings in relation to the strategy. Recommendations made in the last 12 months are available upon request.

Returns are presented gross and net of investment advisory fees and include the reinvestment of all income. Gross returns will be reduced by fees and other expenses that may be incurred in the management of the account. Net returns are presented net of actual investment advisory fees and after the deduction of all trading expenses.

All investments carry a certain degree of risk, including the possible loss of principal. Investments are also subject to political, market, currency and regulatory risks or economic developments. International investments involve special risks that may in particular cause a loss in principal, including currency fluctuation, lower liquidity, different accounting methods and economic and political systems, and higher transaction costs. These risks typically are greater in emerging markets. Securities of small‐ and medium‐sized companies tend to have a shorter history of operations, be more volatile and less liquid. Value stocks can perform differently from the market as a whole and other types of stocks.

The material is provided for informational and/or educational purposes only and is not intended to be and should not be construed as investment, legal or tax advice and/or a legal opinion. Investors should consult their financial and tax adviser before making investments. The opinions referenced are as of the date of publication, may be modified due to changes in the market or economic conditions, and may not necessarily come to pass. Information and data presented has been developed internally and/or obtained from sources believed to be reliable. Aristotle Capital does not guarantee the accuracy, adequacy or completeness of such information.

Aristotle Capital Management, LLC is an independent registered investment adviser under the Advisers Act of 1940, as amended. Registration does not imply a certain level of skill or training. More information about Aristotle Capital, including our investment strategies, fees and objectives, can be found in our Form ADV Part 2, which is available upon request. ACM-2310-25

Performance Disclosures

Composite returns for all periods ended September 30, 2023 are preliminary pending final account reconciliation.

Past performance is not indicative of future results. The information provided should not be considered financial advice or a recommendation to purchase or sell any particular security or product. Performance results for periods greater than one year have been annualized.

Returns are presented gross and net of investment advisory fees and include the reinvestment of all income. Gross returns will be reduced by fees and other expenses that may be incurred in the management of the account. Net returns are presented net of actual investment advisory fees and after the deduction of all trading expenses.

Index Disclosures

The MSCI EAFE Index (Europe, Australasia, Far East) is a free float-adjusted market capitalization-weighted index that is designed to measure the equity market performance of developed markets, excluding the United States and Canada. The MSCI EAFE Index consists of the following 21 developed market country indexes: Australia, Austria, Belgium, Denmark, Finland, France, Germany, Hong Kong, Ireland, Israel, Italy, Japan, the Netherlands, New Zealand, Norway, Portugal, Singapore, Spain, Sweden, Switzerland and the United Kingdom. The MSCI ACWI captures large and mid-cap representation across 23 developed market countries and 24 emerging markets countries. With approximately 3,000 constituents, the Index covers approximately 85% of the global investable equity opportunity set. The MSCI ACWI Growth Index captures large and mid-cap securities exhibiting overall growth style characteristics across 23 developed markets countries and 24 emerging markets countries. The MSCI ACWI Value Index captures large and mid-cap securities exhibiting overall value style characteristics across 23 developed markets countries and 24 emerging markets countries. The MSCI ACWI ex USA Index captures large and mid-cap representation across 22 of 23 developed markets countries (excluding the United States) and 24 emerging markets countries. With approximately 2,300 constituents, the Index covers approximately 85% of the global equity opportunity set outside the United States. The MSCI Emerging Markets Index is a free float-adjusted market capitalization-weighted index that is designed to measure the equity market performance of emerging markets. The MSCI Emerging Markets Index consists of the following 24 emerging market country indexes: Brazil, Chile, China, Colombia, Czech Republic, Egypt, Greece, Hungary, India, Indonesia, Korea, Kuwait, Malaysia, Mexico, Peru, Philippines, Poland, Qatar, Saudi Arabia, South Africa, Taiwan, Thailand, Turkey and United Arab Emirates. The S&P 500® Index is the Standard & Poor’s Composite Index of 500 stocks and is a widely recognized, unmanaged index of common stock prices. The Brent Crude Oil Index is a major trading classification of sweet light crude oil that serves as a major benchmark price for purchases of oil worldwide. The MSCI Japan Index is designed to measure the performance of the large and mid-cap segments of the Japanese market. With approximately 250 constituents, the Index covers approximately 85% of the free float-adjusted market capitalization in Japan. The Bloomberg Global Aggregate Bond Index is a flagship measure of global investment grade debt from 28 local currency markets. This multi-currency benchmark includes treasury, government-related, corporate and securitized fixed-rate bonds from both developed and emerging markets issuers. The MSCI United Kingdom Index is designed to measure the performance of the large and mid-cap segments of the U.K. market. With nearly 100 constituents, the Index covers approximately 85% of the free float-adjusted market capitalization in the United Kingdom. The MSCI Europe Index captures large and mid-cap representation across 15 developed markets countries in Europe. With approximately 430 constituents, the Index covers approximately 85% of the free float-adjusted market capitalization across the European developed markets equity universe. These indexes have been selected as the benchmarks and are used for comparison purposes only. The volatility (beta) of the Composite may be greater or less than the respective benchmarks. It is not possible to invest directly in these indexes.

For more on International Equity, access the latest resources.