Commentary
International Equity 3Q 2023
(All MSCI index returns are shown net and in U.S. dollars unless otherwise noted.)
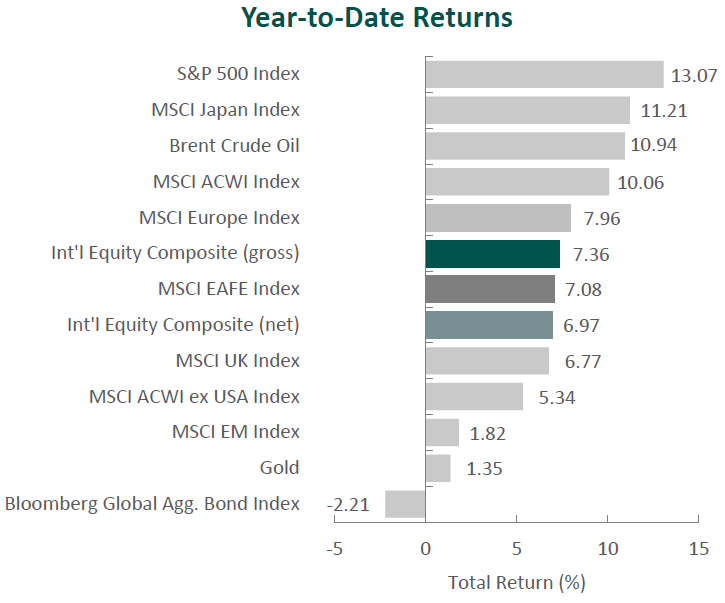
Markets Review

Sources: CAPS CompositeHubTM, Bloomberg
Past performance is not indicative of future results. Aristotle International Equity Composite returns are presented gross and net of investment advisory fees and include the reinvestment of all income. Gross returns will be reduced by fees and other expenses that may be incurred in the management of the account. Net returns are presented net of actual investment advisory fees and after the deduction of all trading expenses. Aristotle Capital Composite returns are preliminary pending final account reconciliation. Please see important disclosures at the end of this document.
After three consecutive positive quarters, global equity markets reversed, as the MSCI ACWI Index fell 3.40% during the period. Concurrently, the Bloomberg Global Aggregate Bond Index decreased 3.59%. In terms of style, value stocks outperformed their growth counterparts during the quarter, with the MSCI ACWI Value Index beating the MSCI ACWI Growth Index by 3.13%.
The MSCI EAFE Index declined 4.11% during the third quarter, while the MSCI ACWI ex USA Index dropped 3.77%. Within the MSCI EAFE Index, Europe & Middle East and Asia were the worst-performing regions, while the U.K. declined the least. On a sector basis, nine out of the eleven sectors within the MSCI EAFE Index posted negative returns, with Information Technology, Utilities and Consumer Discretionary as the worst performers. Conversely, Energy and Financials posted positive returns, while Real Estate declined the least.
Although global financial markets experienced less turmoil than they did earlier this year, inflation remains elevated and economic data remains weak. In fact, the IMF forecast global GDP growth to decline to 3.0% in 2023.
China’s recovery remained sluggish amid an ongoing property slump and lackluster consumer spending. Meanwhile, high levels of inflation persisted across many regions of the world, although inflation in the U.S., eurozone and the U.K. eased significantly from levels seen earlier in the year. Consistent with the progress, the IMF trimmed its global inflation projection to 6.8% from its prior estimate of 7.0% in April but warned inflation could remain high or reaccelerate due to factors such as geopolitics and weather-related events.
By contrast, in Asia, Japanese inflation edged down to 3.2% in August, and the Bank of Japan diverged from its Western counterparts by keeping short-term interest rates steady. China also took an easier approach to its monetary policy, cutting both short- and medium-term lending rates, as the country has struggled to recover following the pandemic. The People’s Bank of China hopes to combat weak consumer spending, falling exports and the country’s real estate crisis. Chinese property developers have come under increased scrutiny, as Evergrande filed for bankruptcy protection in the U.S. while Country Garden warned investors of significant losses.
On the geopolitical front, Ukraine continues to push its counteroffensive in the eastern and southern portions of the country. Western nations have largely remained dedicated to their support of Ukraine, as countries such as the U.S., Canada and the U.K. have all pledged to provide additional aid. In Taiwan, China carried out military exercises in the Taiwan Strait following the Taiwanese vice president’s visit to New York and San Francisco. Despite tense relations between the U.S. and China, the Biden Administration announced $345 million in military aid for Taiwan.
Performance and Attribution Summary
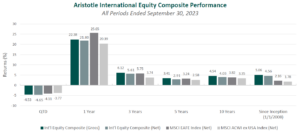
For the third quarter of 2023, Aristotle Capital’s International Equity Composite posted a total return of -4.53% gross of fees (-4.65% net of fees), underperforming the MSCI EAFE Index, which returned -4.11%, and the MSCI ACWI ex USA Index, which returned -3.77%. Please refer to the table below for detailed performance.
| Performance (%) | 3Q23 | YTD | 1 Year | 3 Years | 5 Years | 10 Years | Since Inception* |
|---|---|---|---|---|---|---|---|
| International Equity Composite (gross) | -4.53 | 7.36 | 22.38 | 6.12 | 3.41 | 4.54 | 5.06 |
| International Equity Composite (net) | -4.65 | 6.97 | 21.80 | 5.61 | 2.91 | 4.03 | 4.56 |
| MSCI EAFE Index (net) | -4.11 | 7.08 | 25.65 | 5.75 | 3.24 | 3.82 | 2.16 |
| MSCI ACWI ex USA Index (net) | -3.77 | 5.34 | 20.39 | 3.74 | 2.58 | 3.35 | 1.78 |

Source: FactSet
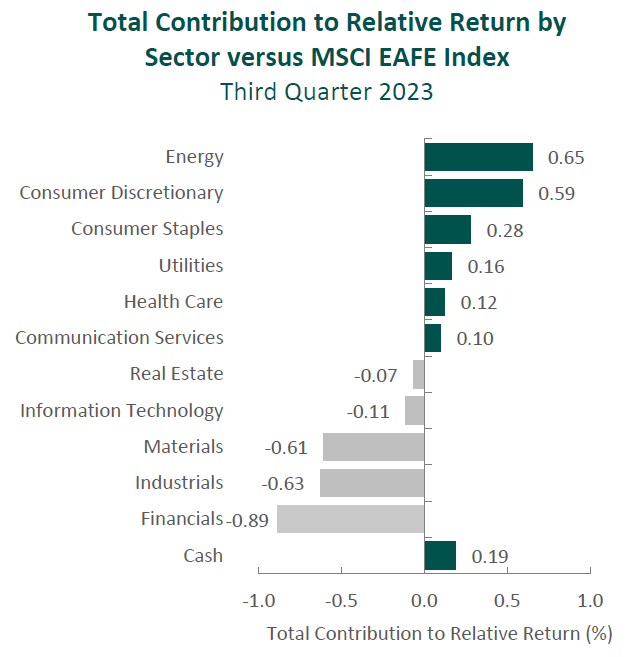
Past performance is not indicative of future results. Attribution results are based on sector returns which are gross of investment advisory fees. Attribution is based on performance that is gross of investment advisory fees and includes the reinvestment of income.
From a sector perspective in the third quarter, the portfolio’s underperformance relative to the MSCI EAFE Index can be attributed to both security selection and allocation effects. Security selection in Financials, Industrials and Materials detracted the most from the portfolio’s relative performance. Conversely, security selection in Consumer Discretionary, Energy and Consumer Staples contributed to relative return.
Regionally, security selection was responsible for the portfolio’s underperformance, while allocation effects had a positive impact. Security selection in the U.K. and exposure to Emerging Markets detracted from relative performance, while exposure to Canada and an underweight in Europe & Middle East contributed.
Contributors and Detractors for 3Q 2023
| Relative Contributors | Relative Detractors |
|---|---|
| Cameco | FANUC |
| Pan Pacific International | Nemetschek |
| TotalEnergies | Dassault Systèmes |
| Munich Reinsurance | LVMH |
| DBS Group | DSM-Firmenich |
Japan-based FANUC, the global manufacturer of industrial robots as well as control systems for machine tools, was the largest detractor for the period. During the June quarter, orders for the company’s robots fell 23% year-on-year following ten consecutive quarters of annual increases. This abrupt decline may have been due to inventory adjustments in China and the Americas as many manufacturers became more cautious over capital investments. Looking past the short-term headwinds, we will continue to monitor the company’s progress shifting its revenue mix toward higher-margin service and IoT capabilities, which should improve profitability. This includes its FIELD platform, which offers predictive maintenance, optimization and self-learning that customers can utilize to reduce production downtime and energy costs. Moreover, we believe long-term prospects for the company are underappreciated since FANUC, as the industrial robot market leader, is uniquely positioned to benefit from further penetration of factory automation and robot usage across geographies.
LVMH Moët Hennessy Louis Vuitton, the luxury goods company, was a primary detractor for the quarter. After doubling sales over the past three years, LVMH is experiencing a slowdown, with organic growth in the recent semi-annual period of only 17%. Regionally, the luxury retail environment is mixed, as strong performance in Asia contrasts with softer demand in the U.S. and a lack of tourist activity from Chinese nationals. Additionally, the company maintained its long-term investment philosophy with increased advertising and promotional spending, which has pressured margins. Despite these near-term challenges, we believe LVMH’s actions will enhance profitability and expand market share in the long run. This includes the company’s continued shift toward Jewelry, which is now the business’s second-largest segment by profit, market share gains in the Selective Retailing segment due to strong performance from Sephora and DFS (Duty Free Shoppers), the successful integration of brands such as Christian Dior Couture, and ongoing integration of Tiffany & Co., which reopened its New York City flagship store “The Landmark” earlier this year.
Pan Pacific International, the Japanese discount and general merchandise retailer, was a top contributor for the period. After being closed for over two and a half years, Japan’s reopening has led to a sharp recovery in retail traffic. In response, Pan Pacific has implemented an aggressive strategy of increasing the number of cash registers and strengthening staffing to boost sales while also focusing on improving procurement capabilities, expanding its private label strategy and improving its inventory turnover. As a result of these actions, along with favorable weather and a strong holiday season, the company’s sales exceeded pre-pandemic levels, and operating margin eclipsed 5% for the first time in five years. Furthermore, we are encouraged by Pan Pacific’s announcement that it will accelerate the opening of new stores with 25 openings in Japan and 12 stores overseas this year. We believe Pan Pacific is well positioned to continue gaining market share in Japan, further penetrate the overseas market and maintain strong levels of profitability.
TotalEnergies, one of the world’s largest energy companies, was also a primary contributor for the quarter. The company continues to execute on its strategic plan to reach net-zero emissions by 2050 which, in contrast to many European energy providers, it looks to achieve through expanding ownership of renewable power and low-carbon assets rather than purely divestment. The company expects to more than double its gross renewable generation capacity by 2025 (primarily in solar) and invest over 30% of its total spending in low-carbon businesses through 2030. As such, we believe TotalEnergies is uniquely positioned to benefit from the increase in global demand for clean energy. In recent years, TotalEnergies’ reduction in capex and operating expenses has improved its FREE cash flow generation, now further aided by the favorable energy environment. This has supported its continued ability to return cash to shareholders, one of our catalysts, as demonstrated by the $3.8 billion returned through share buybacks and dividends during the second quarter.
Recent Portfolio Activity
| Buys | Sells |
|---|---|
| None | None |
Consistent with our long-term horizon and low turnover, there were no new purchases or sales completed during the quarter.
Conclusion
Rather than attempting to predict short-term market dynamics, at Aristotle Capital, we stay focused on understanding company fundamentals while carefully monitoring the long-term evolution of our portfolio of holdings. Our approach to understanding individual businesses reveals more insightful conclusions than would undue time spent concentrating on ever-changing and often unclear macroeconomic signals. While we strive to remain macro aware, our goal instead is to invest in businesses which are run by what we believe are capable and proven management teams that have the skill to navigate changing factors such as inflation, interest rates and government policy. We also analyze how such factors could alter the fundamentals of a business and whether those impacts are long term in nature.
We aim to find companies with high-quality characteristics that can succeed over full market cycles. It is our belief that a disciplined, research-oriented approach to finding great companies, as well as a consistent, well-executed portfolio management process, is how we can add the most value for our clients.
The opinions expressed herein are those of Aristotle Capital Management, LLC (Aristotle Capital) and are subject to change without notice. Past performance is not a guarantee or indicator of future results. This material is not financial advice or an offer to buy or sell any product. You should not assume that any of the securities transactions, sectors or holdings discussed in this report were or will be profitable, or that recommendations Aristotle Capital makes in the future will be profitable or equal the performance of the securities listed in this report. The portfolio characteristics shown relate to the Aristotle International Equity strategy. Not every client’s account will have these characteristics. Aristotle Capital reserves the right to modify its current investment strategies and techniques based on changing market dynamics or client needs. There is no assurance that any securities discussed herein will remain in an account’s portfolio at the time you receive this report or that securities sold have not been repurchased. The securities discussed may not represent an account’s entire portfolio and, in the aggregate, may represent only a small percentage of an account’s portfolio holdings. The performance attribution presented is of a representative account from Aristotle Capital’s International Equity Composite. The representative account is a discretionary client account which was chosen to most closely reflect the investment style of the strategy. The criteria used for representative account selection is based on the account’s period of time under management and its similarity of holdings in relation to the strategy. Recommendations made in the last 12 months are available upon request.
Returns are presented gross and net of investment advisory fees and include the reinvestment of all income. Gross returns will be reduced by fees and other expenses that may be incurred in the management of the account. Net returns are presented net of actual investment advisory fees and after the deduction of all trading expenses.
All investments carry a certain degree of risk, including the possible loss of principal. Investments are also subject to political, market, currency and regulatory risks or economic developments. International investments involve special risks that may in particular cause a loss in principal, including currency fluctuation, lower liquidity, different accounting methods and economic and political systems, and higher transaction costs. These risks typically are greater in emerging markets. Securities of small‐ and medium‐sized companies tend to have a shorter history of operations, be more volatile and less liquid. Value stocks can perform differently from the market as a whole and other types of stocks.
The material is provided for informational and/or educational purposes only and is not intended to be and should not be construed as investment, legal or tax advice and/or a legal opinion. Investors should consult their financial and tax adviser before making investments. The opinions referenced are as of the date of publication, may be modified due to changes in the market or economic conditions, and may not necessarily come to pass. Information and data presented has been developed internally and/or obtained from sources believed to be reliable. Aristotle Capital does not guarantee the accuracy, adequacy or completeness of such information.
Aristotle Capital Management, LLC is an independent registered investment adviser under the Advisers Act of 1940, as amended. Registration does not imply a certain level of skill or training. More information about Aristotle Capital, including our investment strategies, fees and objectives, can be found in our Form ADV Part 2, which is available upon request. ACM-2310-25


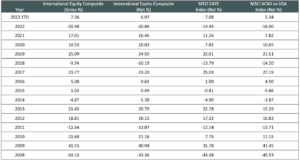
Composite returns for all periods ended September 30, 2023 are preliminary pending final account reconciliation.
Past performance is not indicative of future results. The information provided should not be considered financial advice or a recommendation to purchase or sell any particular security or product. Performance results for periods greater than one year have been annualized.
Returns are presented gross and net of investment advisory fees and include the reinvestment of all income. Gross returns will be reduced by fees and other expenses that may be incurred in the management of the account. Net returns are presented net of actual investment advisory fees and after the deduction of all trading expenses.
The MSCI EAFE Index (Europe, Australasia, Far East) is a free float-adjusted market capitalization-weighted index that is designed to measure the equity market performance of developed markets, excluding the United States and Canada. The MSCI EAFE Index consists of the following 21 developed market country indexes: Australia, Austria, Belgium, Denmark, Finland, France, Germany, Hong Kong, Ireland, Israel, Italy, Japan, the Netherlands, New Zealand, Norway, Portugal, Singapore, Spain, Sweden, Switzerland and the United Kingdom. The MSCI ACWI captures large and mid-cap representation across 23 developed market countries and 24 emerging markets countries. With approximately 3,000 constituents, the Index covers approximately 85% of the global investable equity opportunity set. The MSCI ACWI Growth Index captures large and mid-cap securities exhibiting overall growth style characteristics across 23 developed markets countries and 24 emerging markets countries. The MSCI ACWI Value Index captures large and mid-cap securities exhibiting overall value style characteristics across 23 developed markets countries and 24 emerging markets countries. The MSCI ACWI ex USA Index captures large and mid-cap representation across 22 of 23 developed markets countries (excluding the United States) and 24 emerging markets countries. With approximately 2,300 constituents, the Index covers approximately 85% of the global equity opportunity set outside the United States. The MSCI Emerging Markets Index is a free float-adjusted market capitalization-weighted index that is designed to measure the equity market performance of emerging markets. The MSCI Emerging Markets Index consists of the following 24 emerging market country indexes: Brazil, Chile, China, Colombia, Czech Republic, Egypt, Greece, Hungary, India, Indonesia, Korea, Kuwait, Malaysia, Mexico, Peru, Philippines, Poland, Qatar, Saudi Arabia, South Africa, Taiwan, Thailand, Turkey and United Arab Emirates. The S&P 500® Index is the Standard & Poor’s Composite Index of 500 stocks and is a widely recognized, unmanaged index of common stock prices. The Brent Crude Oil Index is a major trading classification of sweet light crude oil that serves as a major benchmark price for purchases of oil worldwide. The MSCI Japan Index is designed to measure the performance of the large and mid-cap segments of the Japanese market. With approximately 250 constituents, the Index covers approximately 85% of the free float-adjusted market capitalization in Japan. The Bloomberg Global Aggregate Bond Index is a flagship measure of global investment grade debt from 28 local currency markets. This multi-currency benchmark includes treasury, government-related, corporate and securitized fixed-rate bonds from both developed and emerging markets issuers. The MSCI United Kingdom Index is designed to measure the performance of the large and mid-cap segments of the U.K. market. With nearly 100 constituents, the Index covers approximately 85% of the free float-adjusted market capitalization in the United Kingdom. The MSCI Europe Index captures large and mid-cap representation across 15 developed markets countries in Europe. With approximately 430 constituents, the Index covers approximately 85% of the free float-adjusted market capitalization across the European developed markets equity universe. These indexes have been selected as the benchmarks and are used for comparison purposes only. The volatility (beta) of the Composite may be greater or less than the respective benchmarks. It is not possible to invest directly in these indexes.


