ARISTOTLE CAPITAL BOSTON, LLC
Markets Review
U.S. small/mid cap equities delivered robust performance in the third quarter of 2025, with the Russell 2500 Index reaching its first all-time high since November 2024. The rally was driven by a generally favorable macroeconomic backdrop, including a 25 basis point rate cut by the Federal Reserve in September, which marked a shift toward more accommodative policy amid signs of labor market softening. U.S. GDP growth remained strong at 3.8% in Q2, supported by resilient consumer spending and the easing of trade tensions following tariff rollbacks. Inflation edged higher to 2.9%, driven in part by energy costs and tariff passthroughs, but remained within a manageable range for businesses and consumers. Sentiment was risk-on, fueled by Artificial Intelligence driven optimism as companies with AI exposure or disruptive potential saw disproportionate gains, as investors chased momentum and future earnings potential over traditional valuation metrics. Small/mid-caps benefited from dovish Fed rhetoric, attractive relative valuations, broadening of market breadth, earnings recovery and a rotation away from mega cap stocks.
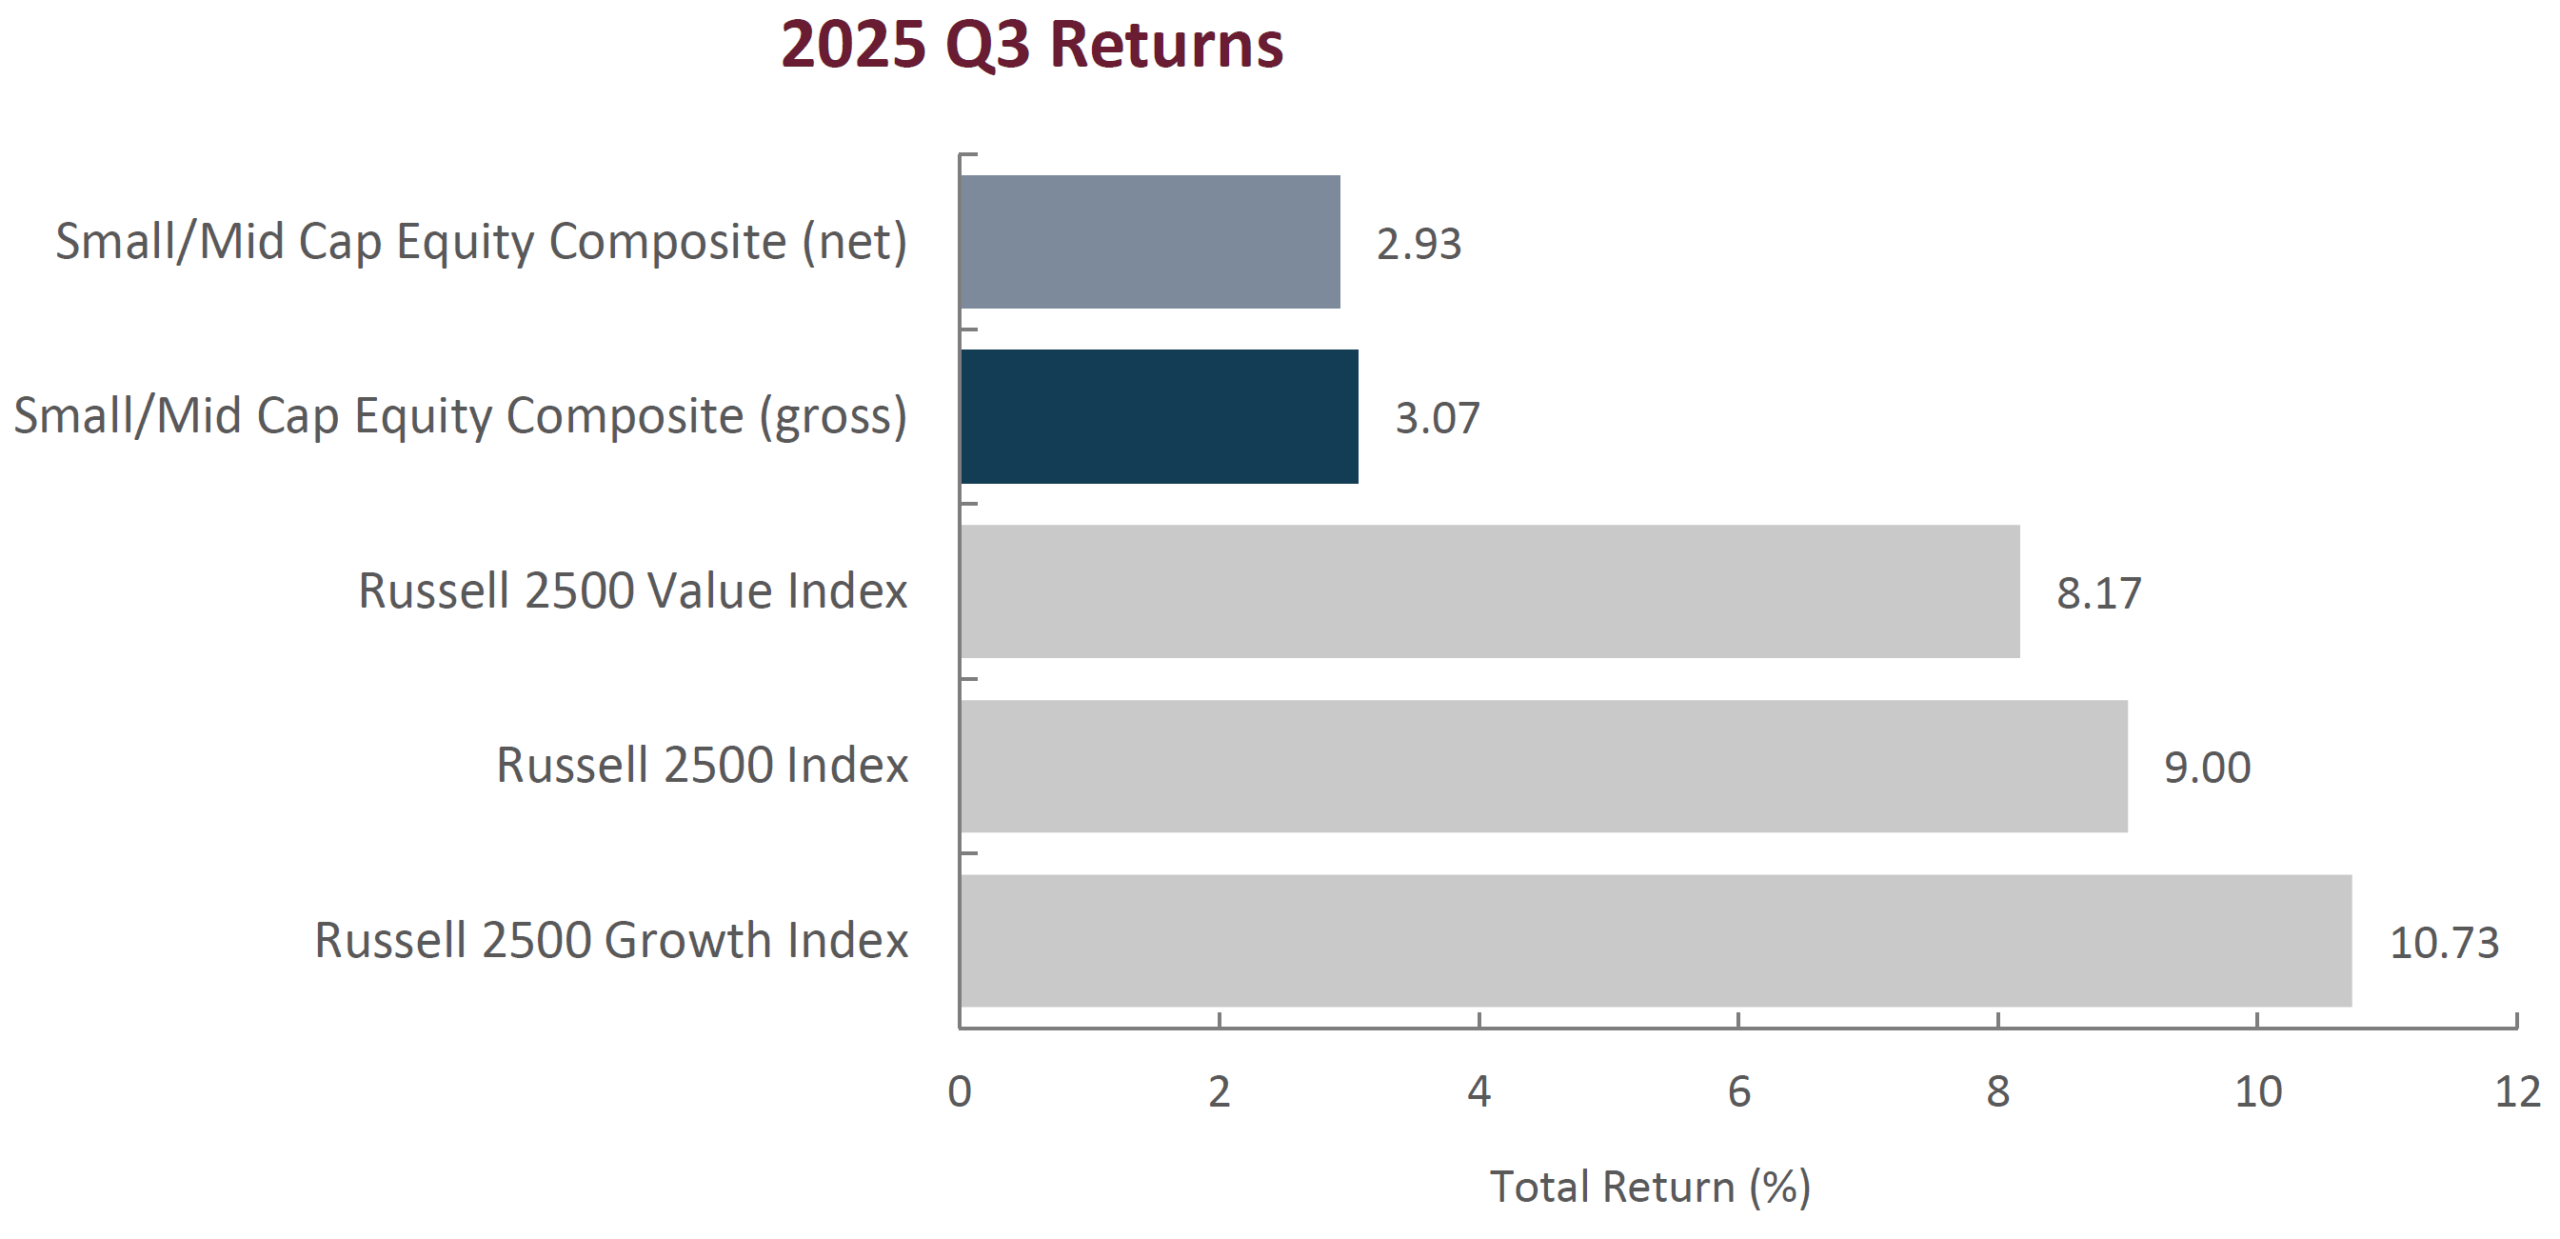
Stylistically, growth stocks outperformed their value counterparts during the quarter as the Russell 2500 Growth Index returned 10.73% compared to the 8.17% return of the Russell 2500 Value index. This continues the 2024 trend where growth significantly outperformed value.
From a factor perspective, lower quality companies significantly outperformed higher quality companies during the quarter. Factors that had the strongest payoffs were high beta, momentum, higher volatility, non-earners, high sales growth, micro caps, cyclical, and highly shorted stocks.
The best performing sectors were Information Technology (+14.47%), Health Care (+12.37%), and Utilities (+12.30%), while the worst performing sectors were Consumer Staples (-3.77%), Financials (+4.02%), and Real Estate (+5.79%).

Sources: CAPS Composite Hub, Russell Investments
Past performance is not indicative of future results. Composite returns are presented pure gross and net of the maximum wrap fee and include the reinvestment of all income. Pure gross returns do not reflect the deduction of any trading costs or other fees and are supplemental to the net returns. Net returns are calculated by subtracting the highest applicable wrap/SMA fee, which includes trading costs and custodial fees, from the pure gross monthly composite return (2.00% on an annual basis, or 0.17% monthly). Composite returns are preliminary pending final account reconciliation. Please see important disclosures at the end of this document.
Performance Review
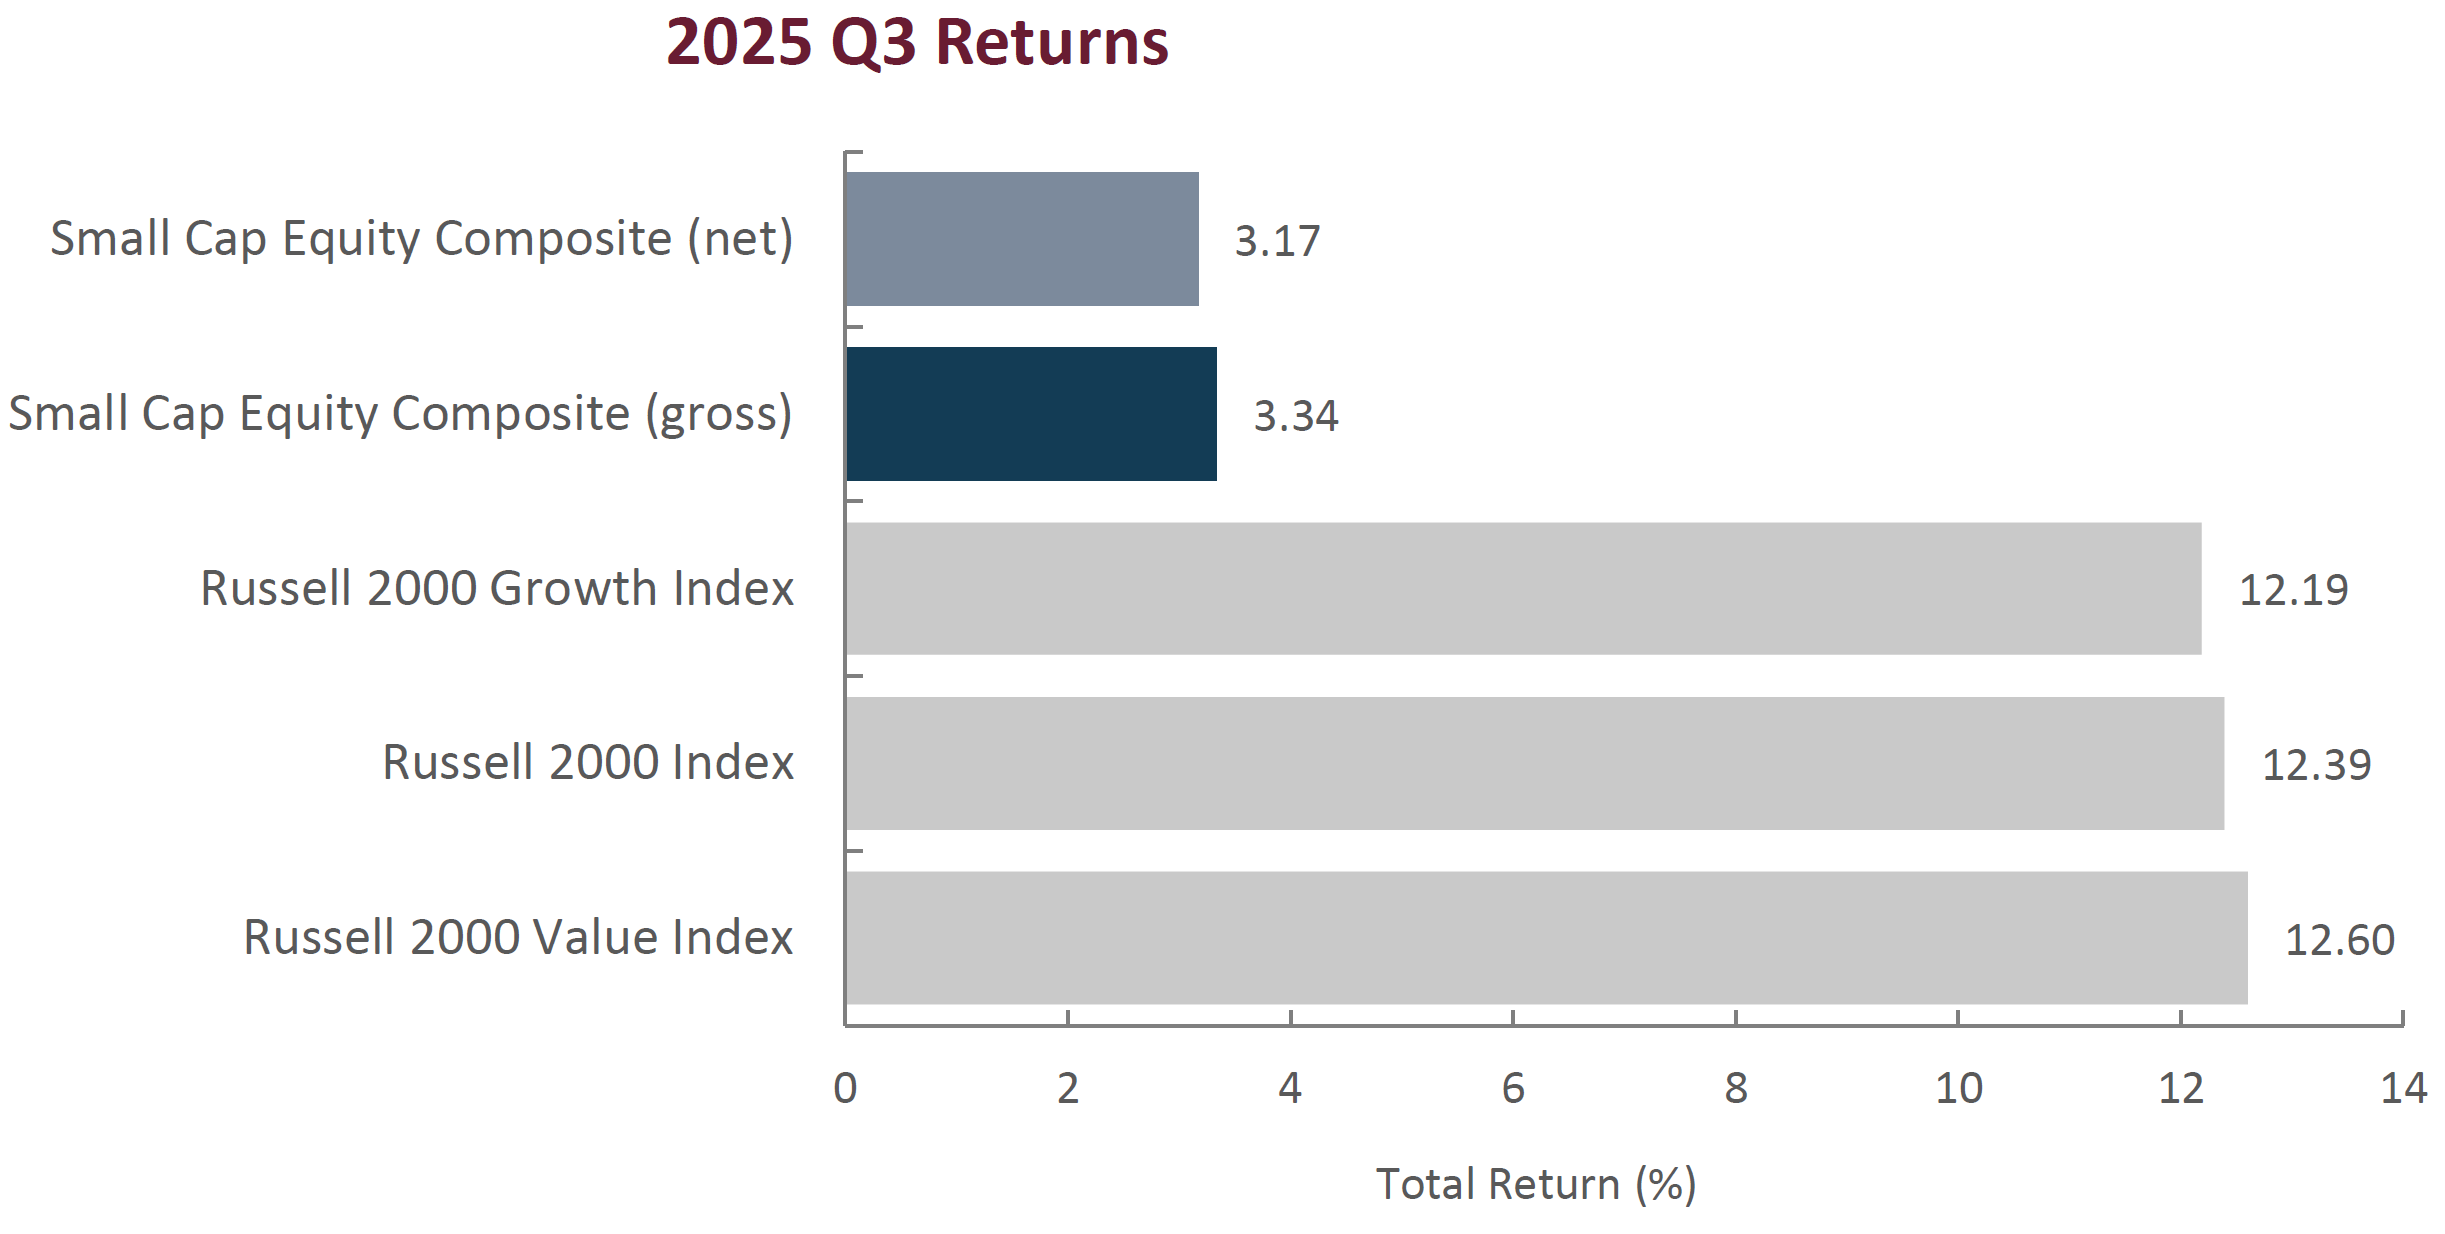
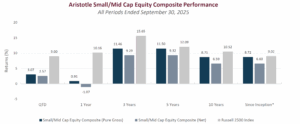
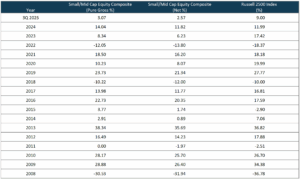
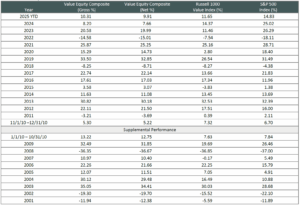
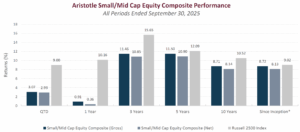
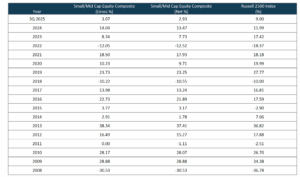
For the third quarter of 2025, the Aristotle Small/Mid Cap Equity Composite generated a total return of 2.57% net of fees (3.07% pure gross of fees), underperforming the 9.00% total return of the Russell 2500 Index. The largest detractor from relative performance was security selection in Health Care (a combination of stocks we owned coupled with not owning biotechnology), Industrials and Materials. This was partially offset by strong security selection in Consumer Discretionary coupled with an overweight allocation to Information Technology and an underweight allocation to Financials.
| Relative Contributors | Relative Detractors |
|---|---|
| Ciena | Haemonetics |
| Alamos Gold | MACOM Technology Solutions |
| Supernus Pharmaceuticals | Gartner |
| Wolverine World Wide | Baldwin Insurance Group |
| Advanced Energy Industries | James Hardie Industries |
CONTRIBUTORS
Ciena (CIEN), is an optical networking equipment manufacturer for telecommunications and web scale network operators. The stock was bolstered due to strong earnings results and optimistic forward guidance driven by AI-related demand and technological innovation. We believe the company is well-positioned to benefit from strong demand for bandwidth given its differentiated product portfolio and history of technological innovation, which should lead to strong operating results and shareholder value creation.
Alamos Gold (AGI-CA), engages in the exploration, development, mining and extraction of precious metals. The company benefited from rising gold prices as investors purchased the commodity as an inflation hedge. We maintain our investment as we believe in the company’s lower geopolitical risk profile, solid production growth plan from 600k oz to 1M oz per year over the next five years, and strong operational track record.
DETRACTORS
Haemonetics (HAE), is a global provider of hematology and blood management products and solutions. The company delivered mixed results during the quarter, beating analyst earnings estimates but posting weaker than expected revenue results. We believe that the company’s strong competitive position within the plasmapheresis market along with increased investment in research and development should create value for shareholders over a multi-year period.
MACOM Technology Solutions (MTSI), is a designer and manufacturer of high-performance semiconductor products. Despite reporting strong Q3 earnings, the stock declined as investors reacted to a slight margin impact from a recent acquisition and a slower-than-expected recovery in the industrial market—both short-term deviations from analyst forecasts. We maintain our position, as we believe the company’s meaningful exposure to growing demand from Data Center and 5G end market applications along with the integration of recent acquisitions and domestic manufacturing footprint should drive additional shareholder value in periods to come.
Recent Portfolio Activity
| Buys/Acquisitions | Sells/Liquidations |
|---|---|
| Columbia Banking System | 1-800-FLOWERS.COM |
| Essential Utilities | ALLETE |
| Hilton Grand Vacations | AZEK |
| James Hardie Industries | Carter’s |
| Pinnacle West Capital | Pacific Premier Bancorp |
| Primo Brands | NCR Voyix |
| Service Corporation International |
BUYS/ACQUISITIONS
Columbia Banking System (COLB), is a Washington state based commercial bank that is in the early stages of winding down a large portfolio of low-yielding loans with organically driven higher yielding relationship loans and lower cost core deposit funding. A combination of operational cost savings associated with the Pacific Premier Bancorp merger and an increased focus on increasing fee-based income should allow for higher than historical profit margins and an attractive EPS growth outlook, ultimately allowing for incremental share buybacks or dividend increases.
Essential Utilities (WTRG), is a Pennsylvania-based utility providing water, wastewater, and natural gas services across nine states through its Aqua and Peoples Gas subsidiaries. Rate base expansion should continue to be driven by ongoing infrastructure investments and municipal water system acquisitions. A favorable regulatory landscape in the company’s core markets, including Pennsylvania and Texas, supports operational stability and consistent dividend growth. The company is a designated “Dividend Aristocrat”, having raised its dividend for 34 straight years.
Hilton Grand Vacations (HGV), isa leading global timeshare company that develops, markets and operates a system of brand-name, high-quality vacation ownership resorts in select vacation destinations, under the brand names: Hilton Vacation Club, Hilton Grand Vacation Club, Hilton Club. HGV’s proprietary relationship with Hilton Worldwide Holdings (HLT) allows it to market exclusively to HLT’s 180 mil Hilton Honors members to capitalize on growing demand for travel. Recent acquisitions broadened the company resort base to include properties appealing to higher income consumers.
James Hardie Industries (JHX), manufactures Fiber Cement and Fiber Gypsum products (siding, backerboard, etc.) used primarily in residential construction (newbuild and repair/remodel). JHX acquired the existing portfolio company, The AZEK Company (AZEK), which provides JHX with a broader product offering for distributors, contractors and homeowners, positioning the company for market share gains in an expanded addressable market. Operating synergies, merger cost synergies and enhanced scale efficiencies should further enhance the shareholder value creation potential.
Pinnacle West Capital (PNW), isan Arizona-based, vertically integrated electric utility company serving central Arizona. Population migration and the expansion of industrial manufacturing within the Phoenix metropolitan area is driving increased energy demand and capital investment opportunities for the company. An improving regulatory backdrop in Arizona should also allow for reduced earnings volatility and accelerated cost recovery moving forward.
Primo Brands (PRMB), is a branded beverage company focused on healthy hydration. The company is the top player in U.S. bottled water with approximately 19% market share. The portfolio of brands is well diversified across distribution channels, product format, sizes and price points that allow the company to cost efficiently reach 90% of the U.S. population. Increasing consumption of bottled water should be supported by concerns about municipal tap water quality, the wellness movement leading to lower consumption of soda, juice, and alcoholic beverages, and innovation in water flavors and premium products attracting consumers toward the category.
Service Corporation International (SCI), is North America’s largest provider of deathcare products and services. The company is strategically positioned to benefit from long-term demographic tailwinds driven by the aging Baby Boomer population. Given the high fixed-cost nature of the business, rising volumes are expected to deliver operating leverage, driving margin expansion and increased cash generation. Total shareholder value is further enhanced by a balanced capital allocation strategy, featuring dividends, share repurchases, and accretive acquisitions that strengthen the company’s market leadership.
SELLS/LIQUIDATIONS
1-800-FLOWERS.COM (FLWS), is an e-commerce provider of floral and gift products. The position was liquidated due to an increasingly uncertain fundamental outlook.
ALLETE (ALE), is a Minnesota based electric utility company. The position was liquidated ahead of its pending acquisition by a private equity consortium.
AZEK (AZEK), is a manufacturer of composite decking products for primarily residential applications. The company was acquired by James Hardie Industries plc (JHX).
Carter’s (CRI), is a manufacturer, distributor and retailer of infant and young children’s apparel. The position was liquidated due to deteriorated fundamental performance and an uncertain strategic outlook.
Pacific Premier Bancorp (PPBI), a California based bank holding company, was acquired by Columbia Banking System (COLB).
NCR Voyix (VYX), is a provider of digital commerce solutions to the retail, restaurants, and digital banking industries. The position was liquidated due to deteriorating fundamental performance following the spin out from NCR Corporation.
Outlook
We remain optimistic about the long-term potential for the small/mid-cap segment of the U.S. market. Valuations remain compelling relative to large caps, with the Russell 2500 Index trading near the lower end of its historical range. Potential tailwinds, including deregulation, lower corporate tax rates, increased M&A activity, continued reshoring of U.S. manufacturing, and infrastructure-related spending, could provide additional support for small/mid-cap stocks. Volatility remains elevated over concerns around inflationary risks, geopolitical tensions, and potential U.S. economic and labor weakness.
Positioning
Our current positioning is a function of our bottom-up security selection process and our ability to identify what we view as attractive investment candidates, regardless of economic sector definitions. Overweights in Information Technology and Materials are mostly a function of our underlying company specific views rather than any top-down predictions for each sector. Conversely, we continue to be underweight in Consumer Discretionary, as we have been unable to identify what we consider to be compelling long-term opportunities that fit our discipline given the rising risk profiles of many retail businesses and a potential deceleration in goods spending following a period of strength. We are also underweight in Financials as the sector has experienced strong returns, leading us to harvest gains and redeploy the proceeds to what we consider to be more attractive reward to risk opportunities. Given our focus on long-term business fundamentals, our patient investment approach and low portfolio turnover, the strategy’s sector positioning generally does not change significantly from quarter to quarter. However, we may take advantage of periods of volatility by adding selectively to certain companies when appropriate.
The opinions expressed herein are those of Aristotle Capital Boston, LLC (Aristotle Boston) and are subject to change without notice.
Past performance is not indicative of future results. The information provided in this report should not be considered financial advice or a recommendation to purchase or sell any particular security. There is no assurance that any securities discussed herein will remain in an account’s portfolio at the time you receive this report or that securities sold have not been repurchased. The securities discussed may not represent an account’s entire portfolio and, in the aggregate, may represent only a small percentage of an account’s portfolio holdings. The performance attribution presented is of a representative account from Aristotle Boston’s Small/Mid Cap Equity Composite. The representative account is a discretionary client account which was chosen to most closely reflect the investment style of the strategy. The criteria used for representative account selection is based on the account’s period of time under management and its similarity of holdings in relation to the strategy. It should not be assumed that any of the securities transactions, holdings or sectors discussed were or will be profitable, or that the investment recommendations or decisions Aristotle Boston makes in the future will be profitable or equal the performance of the securities discussed herein. Aristotle Boston reserves the right to modify its current investment strategies and techniques based on changing market dynamics or client needs. Recommendations made in the last 12 months are available upon request.
Composite returns are presented pure gross and net of the maximum wrap fee and include the reinvestment of all income. Pure gross returns do not reflect the deduction of any trading costs or other fees and are supplemental to the net returns. Net returns are calculated by subtracting the highest applicable wrap/SMA fee, which includes trading costs and custodial fees, from the pure gross monthly composite return (2.00% on an annual basis, or 0.17% monthly).
All investments carry a certain degree of risk, including the possible loss of principal. Investments are also subject to political, market, currency and regulatory risks or economic developments. International investments involve special risks that may in particular cause a loss in principal, including currency fluctuation, lower liquidity, different accounting methods and economic and political systems, and higher transaction costs. These risks typically are greater in emerging markets. While Large-capitalization companies may have more stable prices than smaller, less established companies, they are still subject to equity securities risk. In addition, large-capitalization equity security prices may not rise as much as prices of equity securities of small-capitalization companies. Securities of small- and medium-sized companies tend to have a shorter history of operations, be more volatile and less liquid. Value stocks can perform differently from the market as a whole and other types of stocks. The material is provided for informational and/or educational purposes only and is not intended to be and should not be construed as investment, legal or tax advice and/or a legal opinion. Investors should consult their financial and tax adviser before making investments. The opinions referenced are as of the date of publication, may be modified due to changes in the market or economic conditions, and may not necessarily come to pass. Information and data presented has been developed internally and/or obtained from sources believed to be reliable. Aristotle Boston does not guarantee the accuracy, adequacy or completeness of such information.
Aristotle Capital Boston, LLC is an independent investment adviser registered under the Investment Advisers Act of 1940, as amended. Registration does not imply a certain level of skill or training. More information about Aristotle Boston, including our investment strategies, fees and objectives, can be found in our Form ADV Part 2, which is available upon request. ACB-2510-21
Sources: CAPS Composite Hub, Russell Investments
Composite returns for periods ended September 30, 2025, are preliminary pending final account reconciliation.
*The Aristotle Small/Mid Cap Equity Composite has an inception date of January 1, 2008, at a predecessor firm. During this time, Jack McPherson and Dave Adams had primary responsibility for managing the strategy. Performance starting January 1, 2015, was achieved at Aristotle Boston.
Past performance is not indicative of future results. Performance results for periods greater than one year have been annualized. Composite returns are presented pure gross and net of the maximum wrap fee and include the reinvestment of all income. Pure gross returns do not reflect the deduction of any trading costs or other fees and are supplemental to the net returns. Net returns are calculated by subtracting the highest applicable wrap/SMA fee, which includes trading costs and custodial fees, from the pure gross monthly composite return (2.00% on an annual basis, or 0.17% monthly). Please see important disclosures enclosed within this document.
The Russell 2500® Index measures the performance of the small to mid cap segment of the U.S. equity universe. The Russell 2500 Index is a subset of the Russell 3000® Index. It includes approximately 2500 of the smallest securities based on a combination of their market cap and current index membership. The Russell 2500 Growth® Index measures the performance of the small/mid cap companies located in the United States that also exhibit a growth probability. The Russell 2500 Value® Index measures the performance of the small/mid cap companies located in the United States that also exhibit a value probability. The volatility (beta) of the composite may be greater or less than the benchmarks. It is not possible to invest directly in these indices.


 Sources: CAPS Composite Hub, Russell Investments