Markets Review
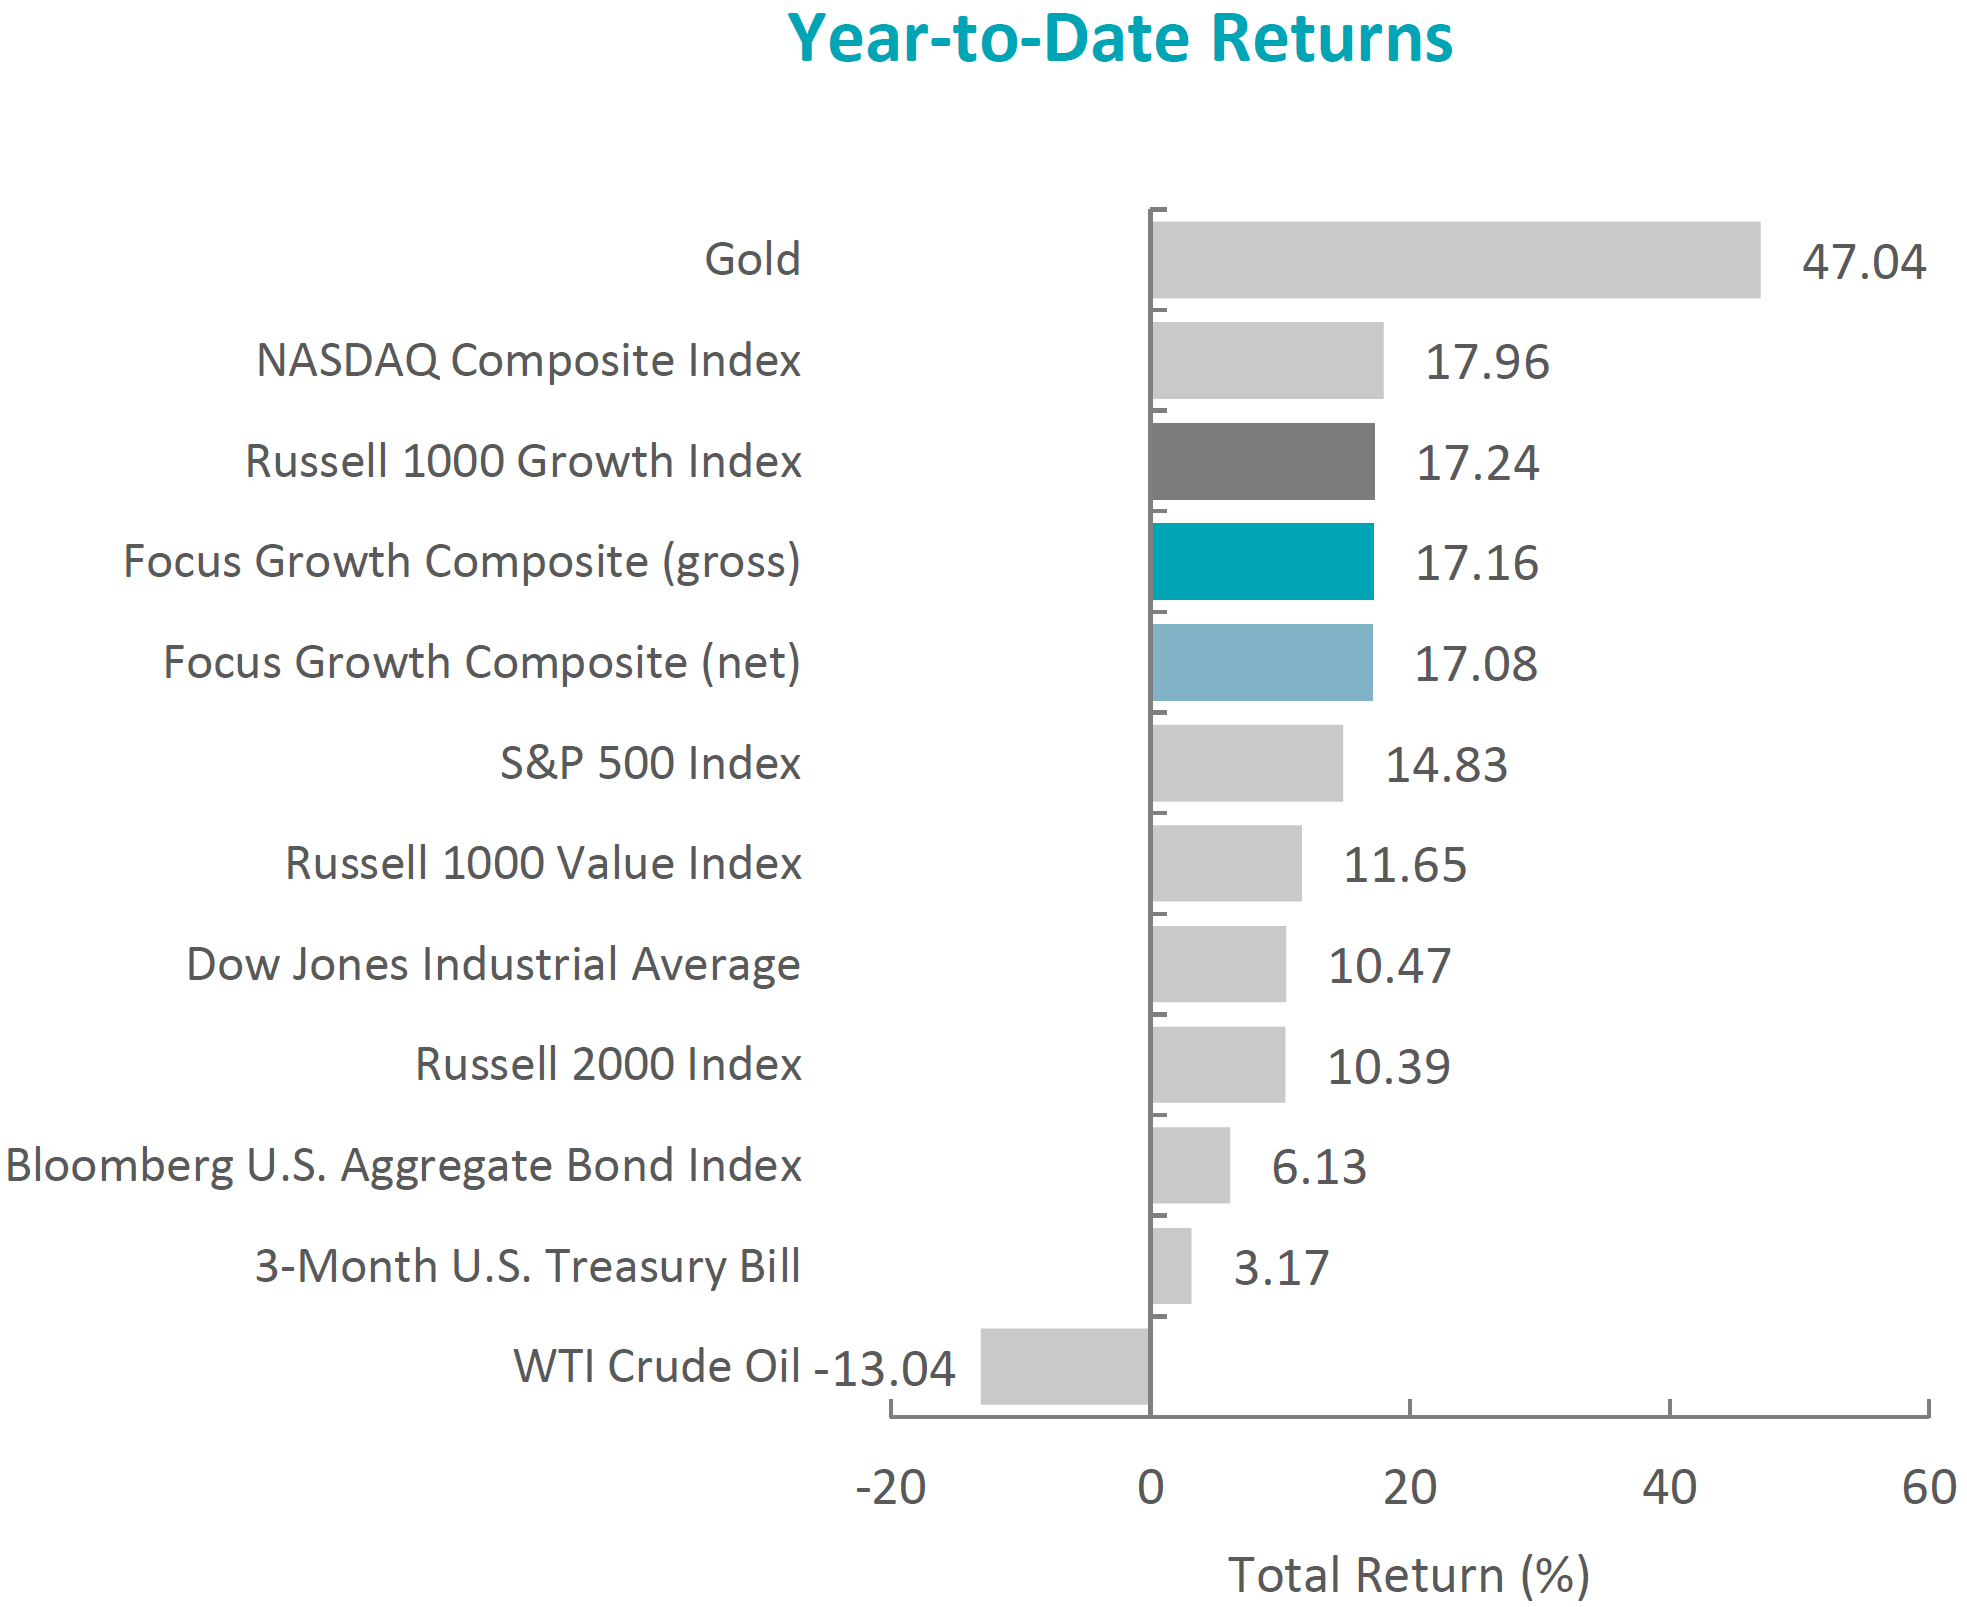
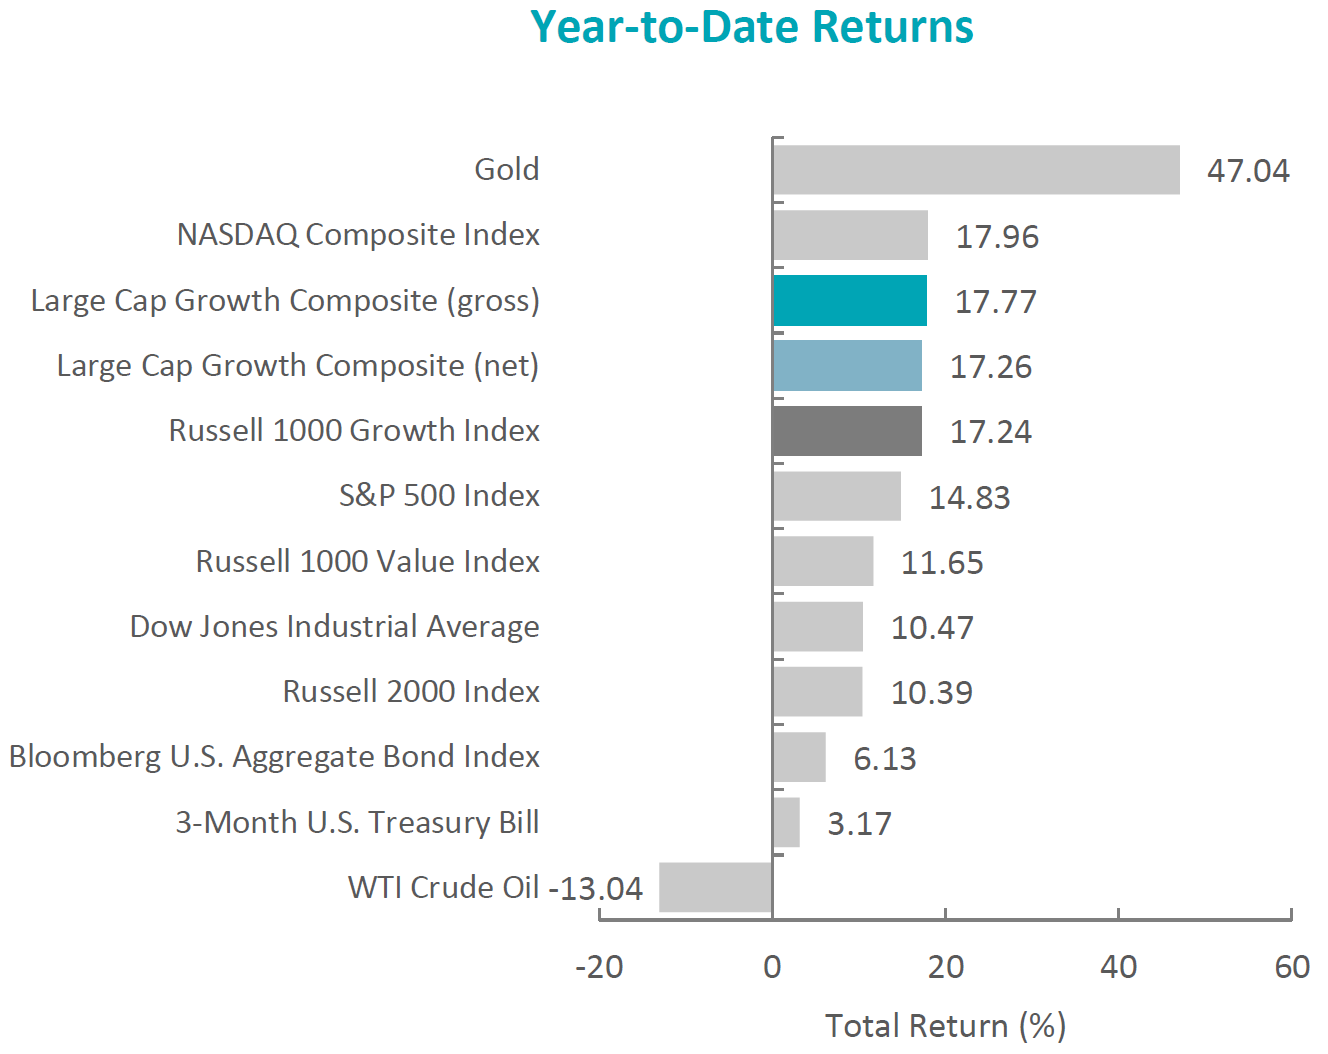
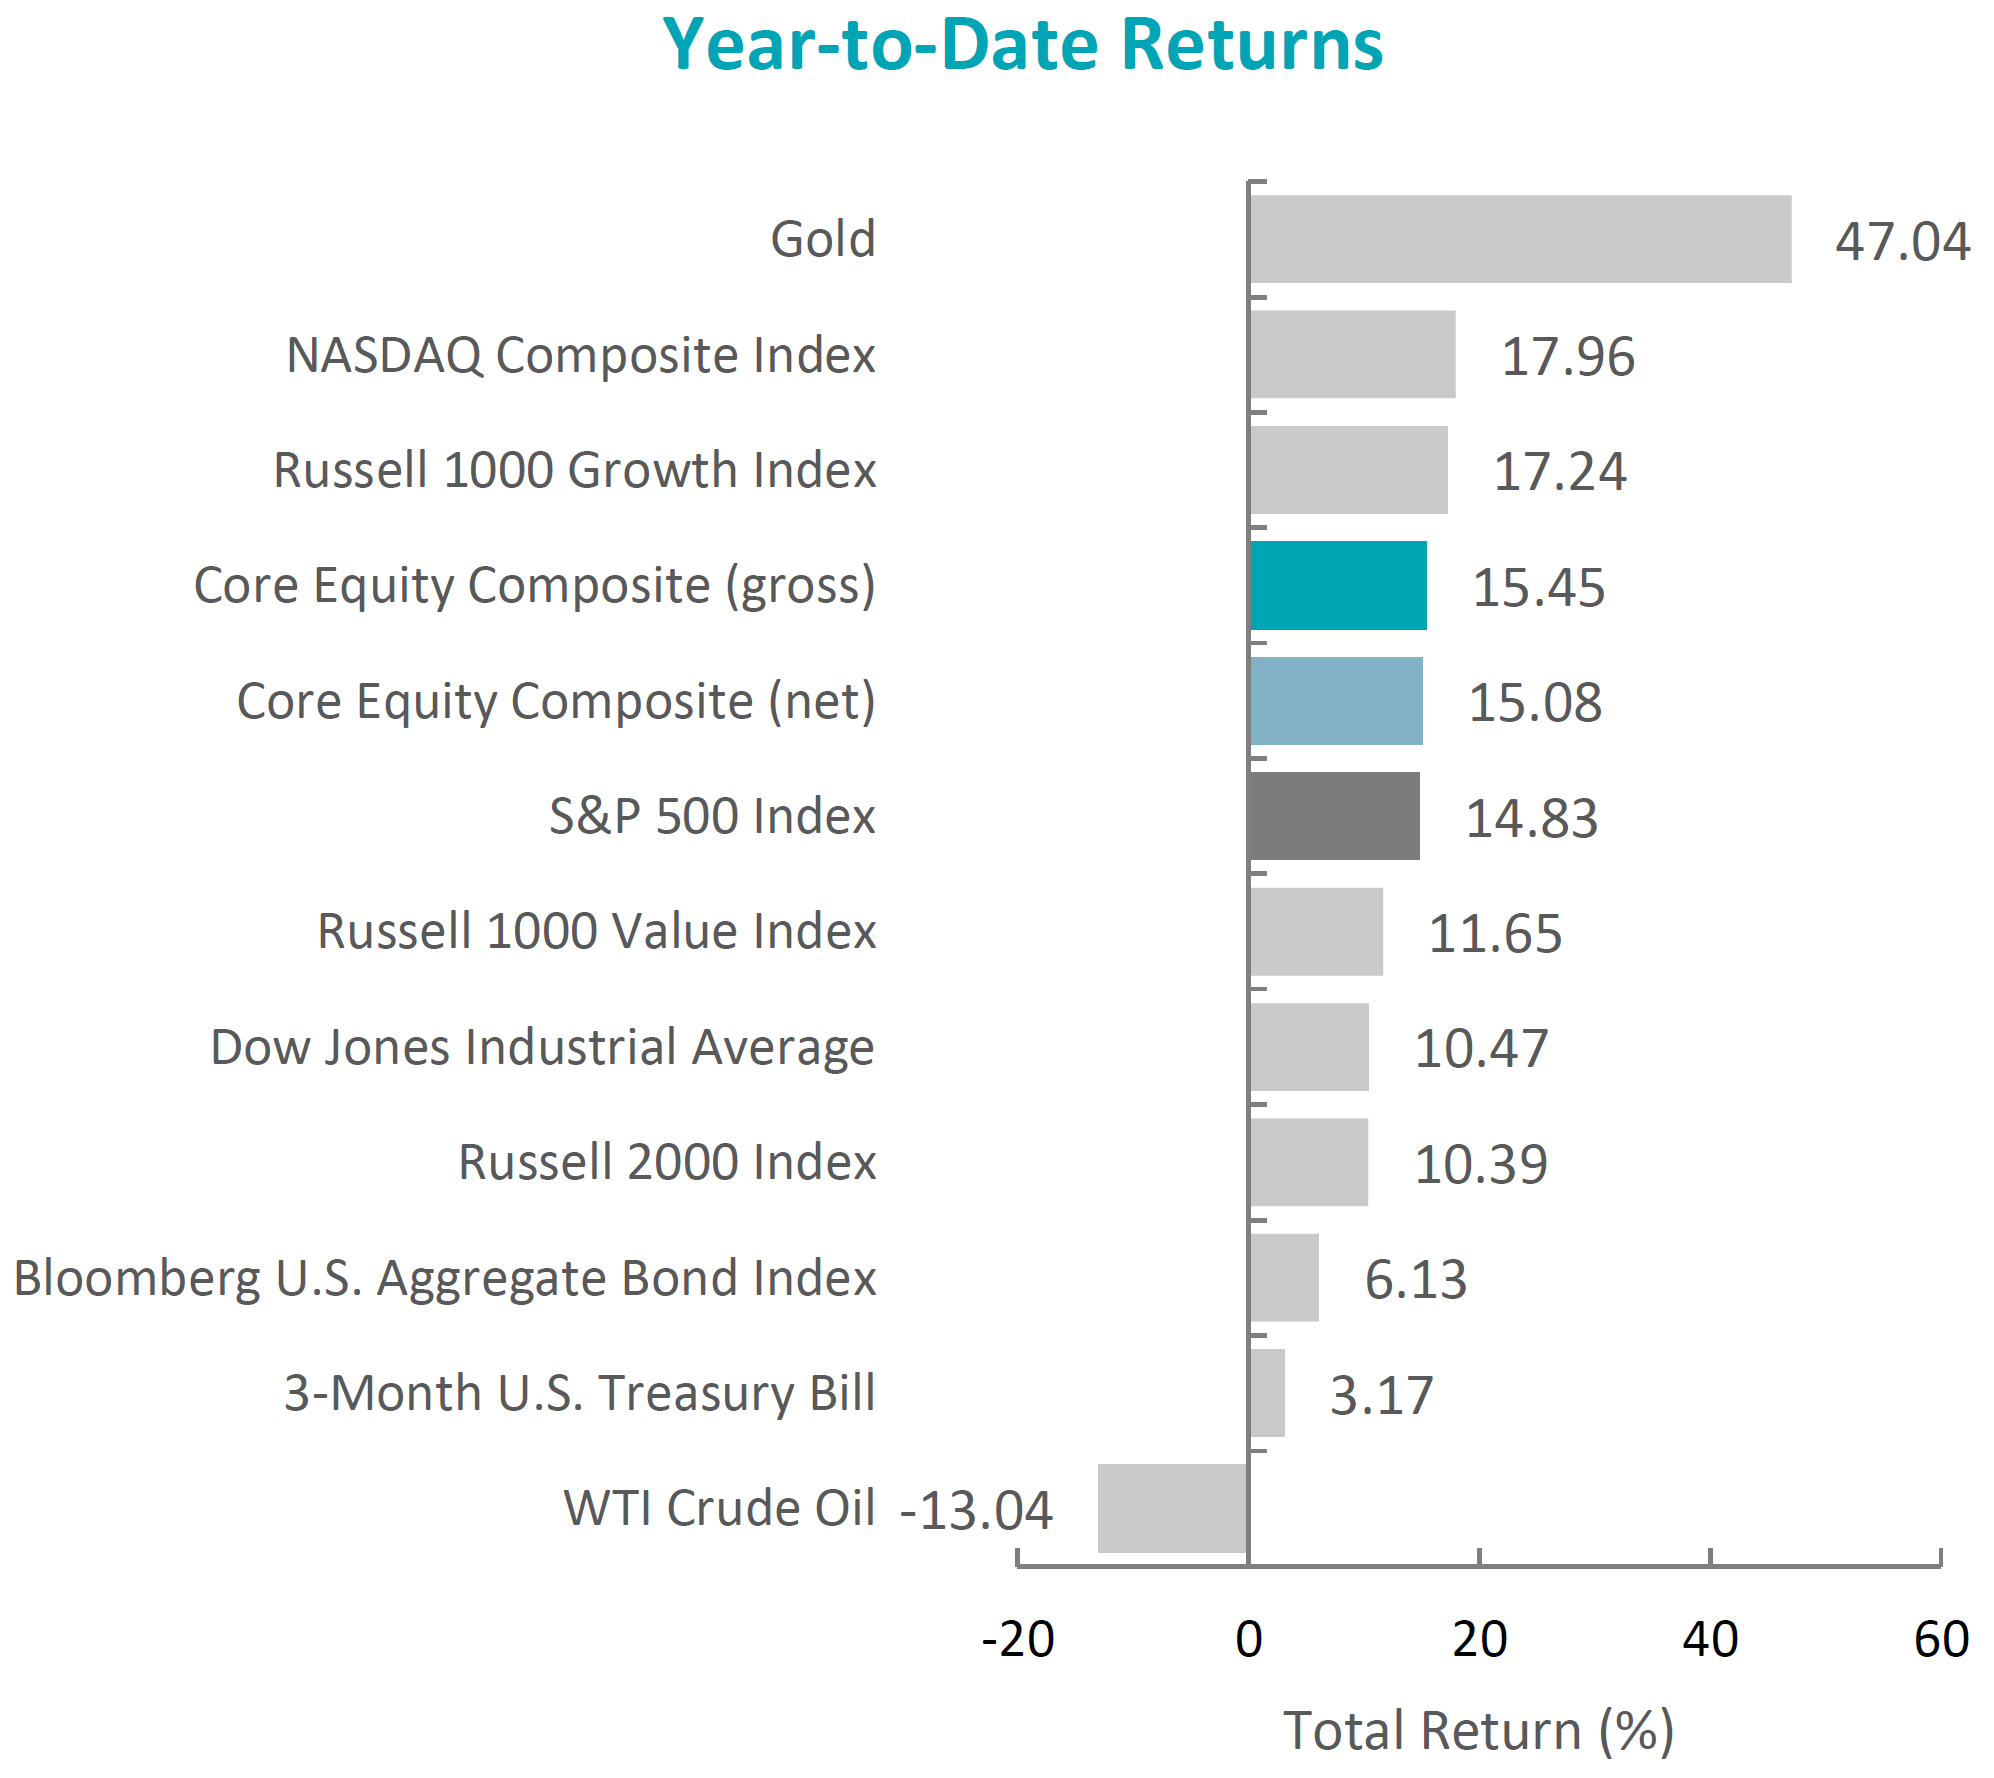
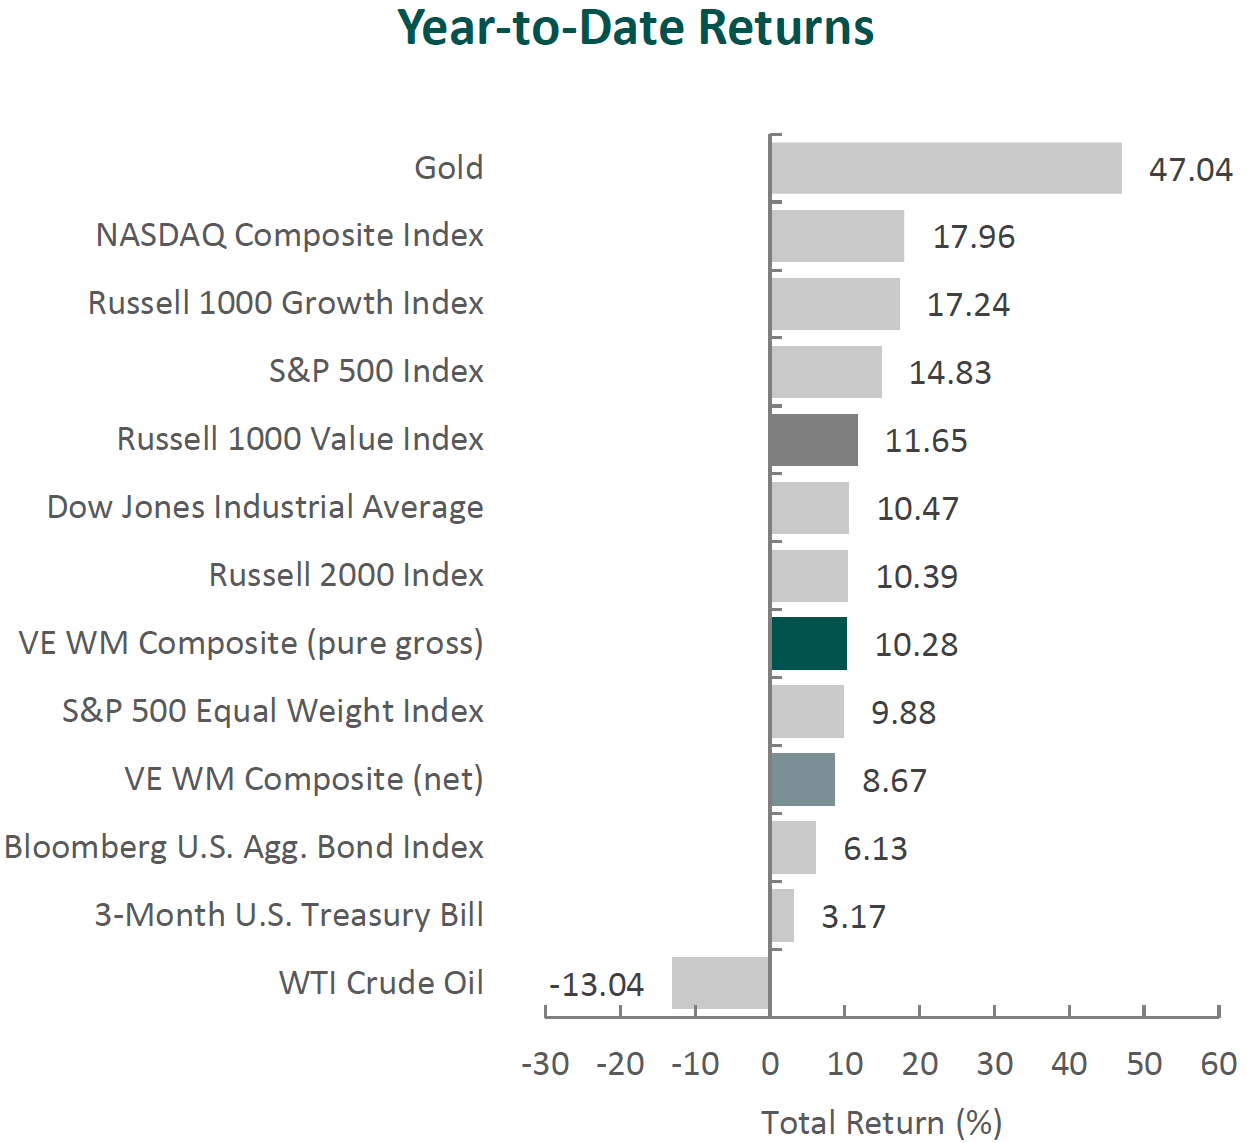
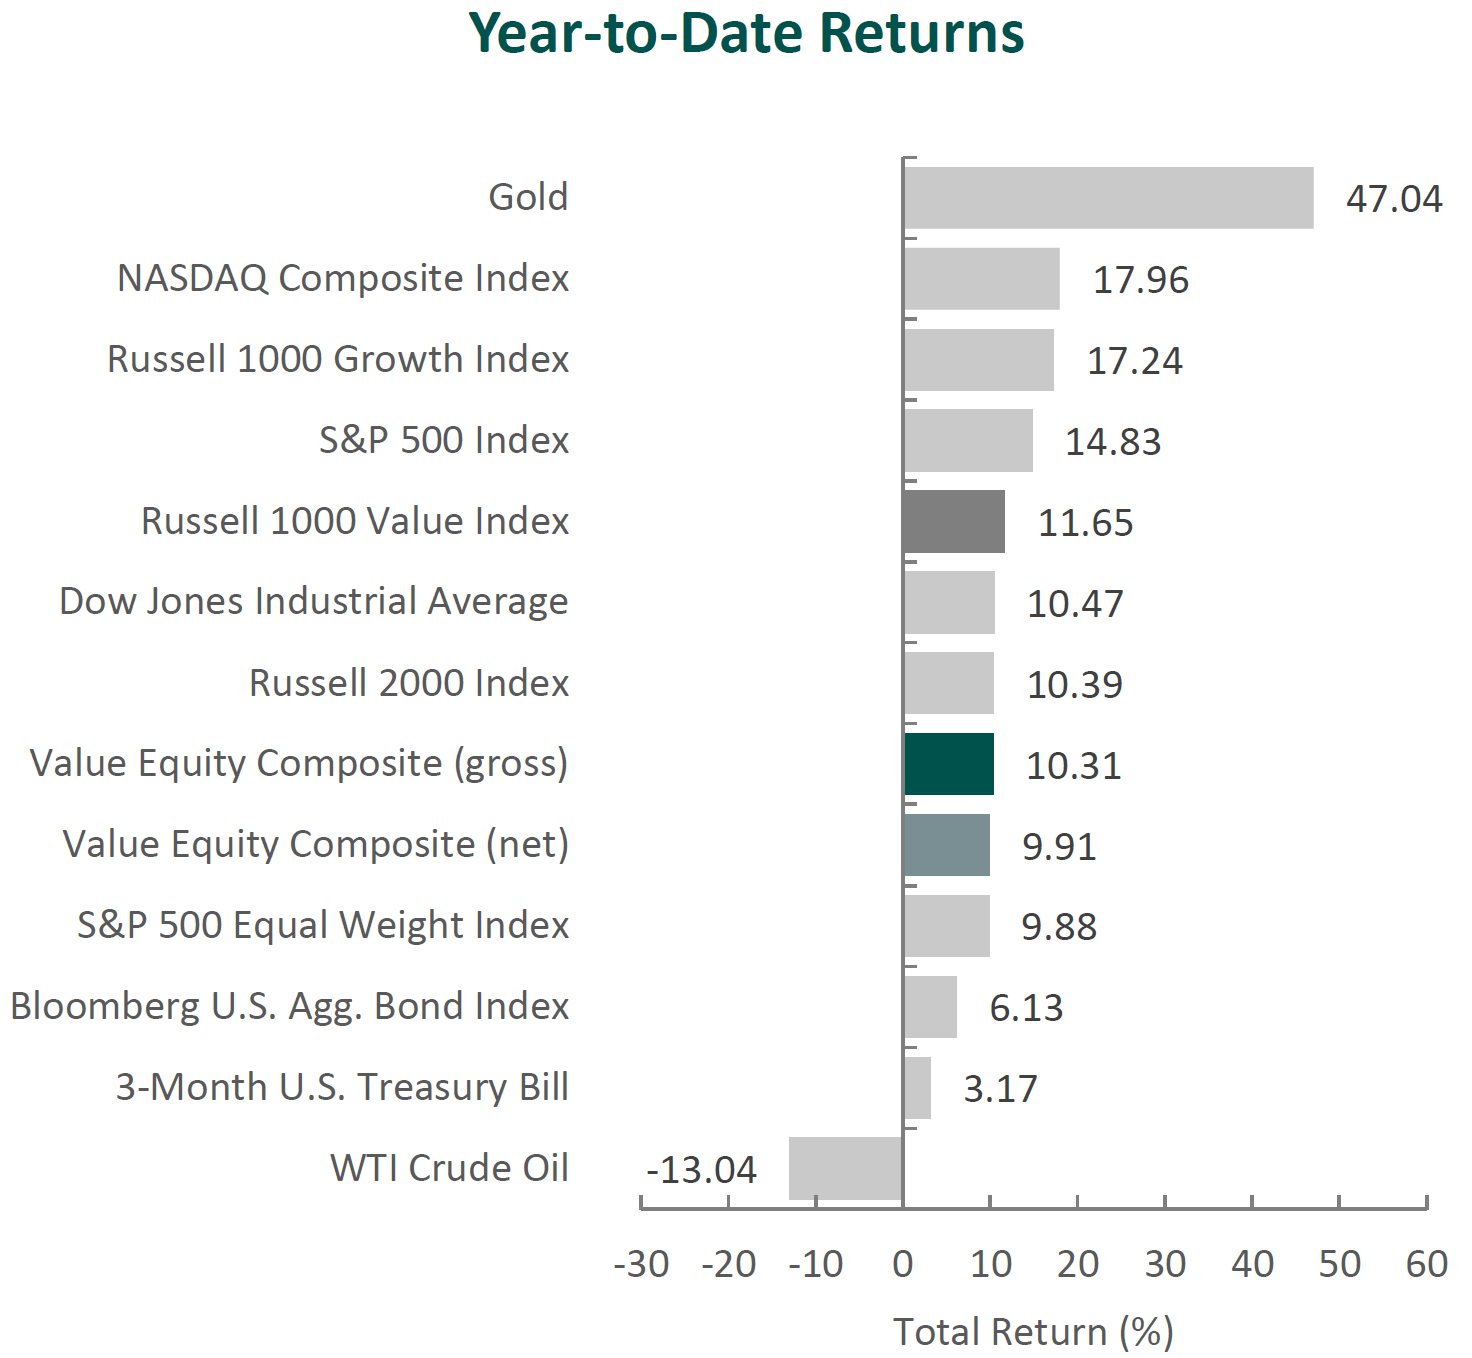
The U.S. equity market continued to climb in the third quarter, with the S&P 500 Index rising 8.12% during the period. Concurrently, bonds also finished higher, as the Bloomberg U.S. Aggregate Bond Index increased 2.03%.
Sources: CAPS CompositeHubTM, Bloomberg
Past performance is not indicative of future results. Aristotle Atlantic Focus Growth Composite returns are presented gross and net of investment advisory fees and include the reinvestment of all income. Gross returns will be reduced by fees and other expenses that may be incurred in the management of the account. Net returns are presented net of actual investment advisory fees and after the deduction of all trading expenses. Aristotle Atlantic Composite returns are preliminary pending final account reconciliation. Please see important disclosures at the end of this document.
On a sector basis, positive returns were led by seven of the eleven sectors within the Russell 1000 Growth Index in the third quarter of 2025. The strongest sectors were Information Technology and Communication Services. The weakest sectors were Real Estate and Consumer Staples.
The U.S. economy rebounded, as real GDP increased by an annual rate of 3.8% in the second quarter, reversing the contraction in the prior quarter—the first in three years. While the headline growth was encouraging, economists caution that the underlying picture may be less robust than it appears. Much of the rebound stemmed from a decline in imports, which the U.S. Bureau of Economic Analysis attributes to the unwinding of a tariff-driven import surge earlier in the year. In effect, lower imports mechanically boosted net exports, temporarily inflating growth figures.
Beyond trade distortions, domestic demand remained steady, supported by consumer spending. However, the labor market showed signs of cooling: job gains slowed in August, and the unemployment rate—while remaining historically low—increased slightly to 4.3%. Consumer confidence weakened sequentially and year-over-year, yet spending resilience suggests households continue to lean on wage growth and accumulated savings.
Inflation data added to the complexity. The Consumer Price Index (CPI) edged higher, keeping inflation above the Federal Reserve’s 2% target. With a combination of still-elevated inflation, softer employment data and rising macroeconomic uncertainty, the FOMC reduced the federal funds rate by 0.25%, bringing the range to 4.00%-4.25%. Policymakers emphasized flexibility, underscoring their “data-dependent” approach amid competing signals.
While uncertainty remained a theme in the Fed’s recent statements, trade-related concerns eased somewhat as the White House announced progress on multiple agreements. In Europe, the U.S. and EU reached a deal under which the EU agreed to pay the U.S. a 15% tariff rate, committed to purchase $750 billion in U.S. energy and pledged $600 billion in new U.S. investments by 2028. Japan also agreed to a baseline 15% tariff on nearly all Japanese imports and committed to purchasing $8 billion annually in U.S. agricultural goods. Even relations with China steadied as President Trump extended the suspension of higher tariffs until November, while U.S. lawmakers visited the country for the first time since 2019.
However, some trade tensions persisted. The Trump Administration announced an additional 25% tariff on Indian imports in response to continued Russian oil purchases, a move that brought Russia, China and India into closer alignment. President Trump also imposed an additional 40% tariff on Brazil as he accused the country of coercing U.S companies to censor speech and turn over sensitive U.S. user data. Meanwhile, in a divided ruling, a U.S. appeals court raised questions about the legal basis for certain tariffs but stayed its order, keeping the measures in effect through mid-October while appeals proceed. The Supreme Court will hear the case on November 5, with the outcome potentially clarifying the scope of executive authority on trade policy.e 2019.
Corporate America, however, showed resilience. S&P 500 companies reported earnings growth of 11.7% year-over-year, marking the third straight quarter of double-digit expansion. Importantly, over 80% of companies exceeded EPS estimates, despite more than 340 firms citing tariff-related headwinds in their commentary. Earnings strength was broad-based, led by Communication Services, Information Technology and Financials, highlighting the adaptability of U.S. firms even in a volatile trade and policy environment.
Performance and Attribution Summary
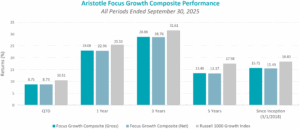
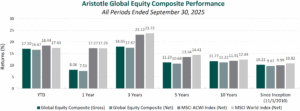
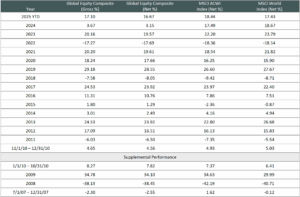
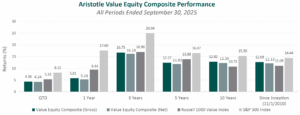
For the third quarter of 2025, Aristotle Atlantic’s Focus Growth Composite posted a total return of 8.75% gross of fees (8.73% net of fees), underperforming the 10.51% total return of the Russell 1000 Growth Index.
| Performance (%) | QTD | YTD | 1 Year | 3 Years | 5 Years | Since Inception* |
|---|---|---|---|---|---|---|
| Focus Growth Composite (gross) | 8.75 | 17.16 | 23.08 | 28.88 | 13.48 | 15.71 |
| Focus Growth Composite (net) | 8.73 | 17.08 | 22.96 | 28.76 | 13.37 | 15.49 |
| Russell 1000 Growth Index | 10.51 | 17.24 | 25.53 | 31.61 | 17.58 | 18.40 |
Sources: FactSet
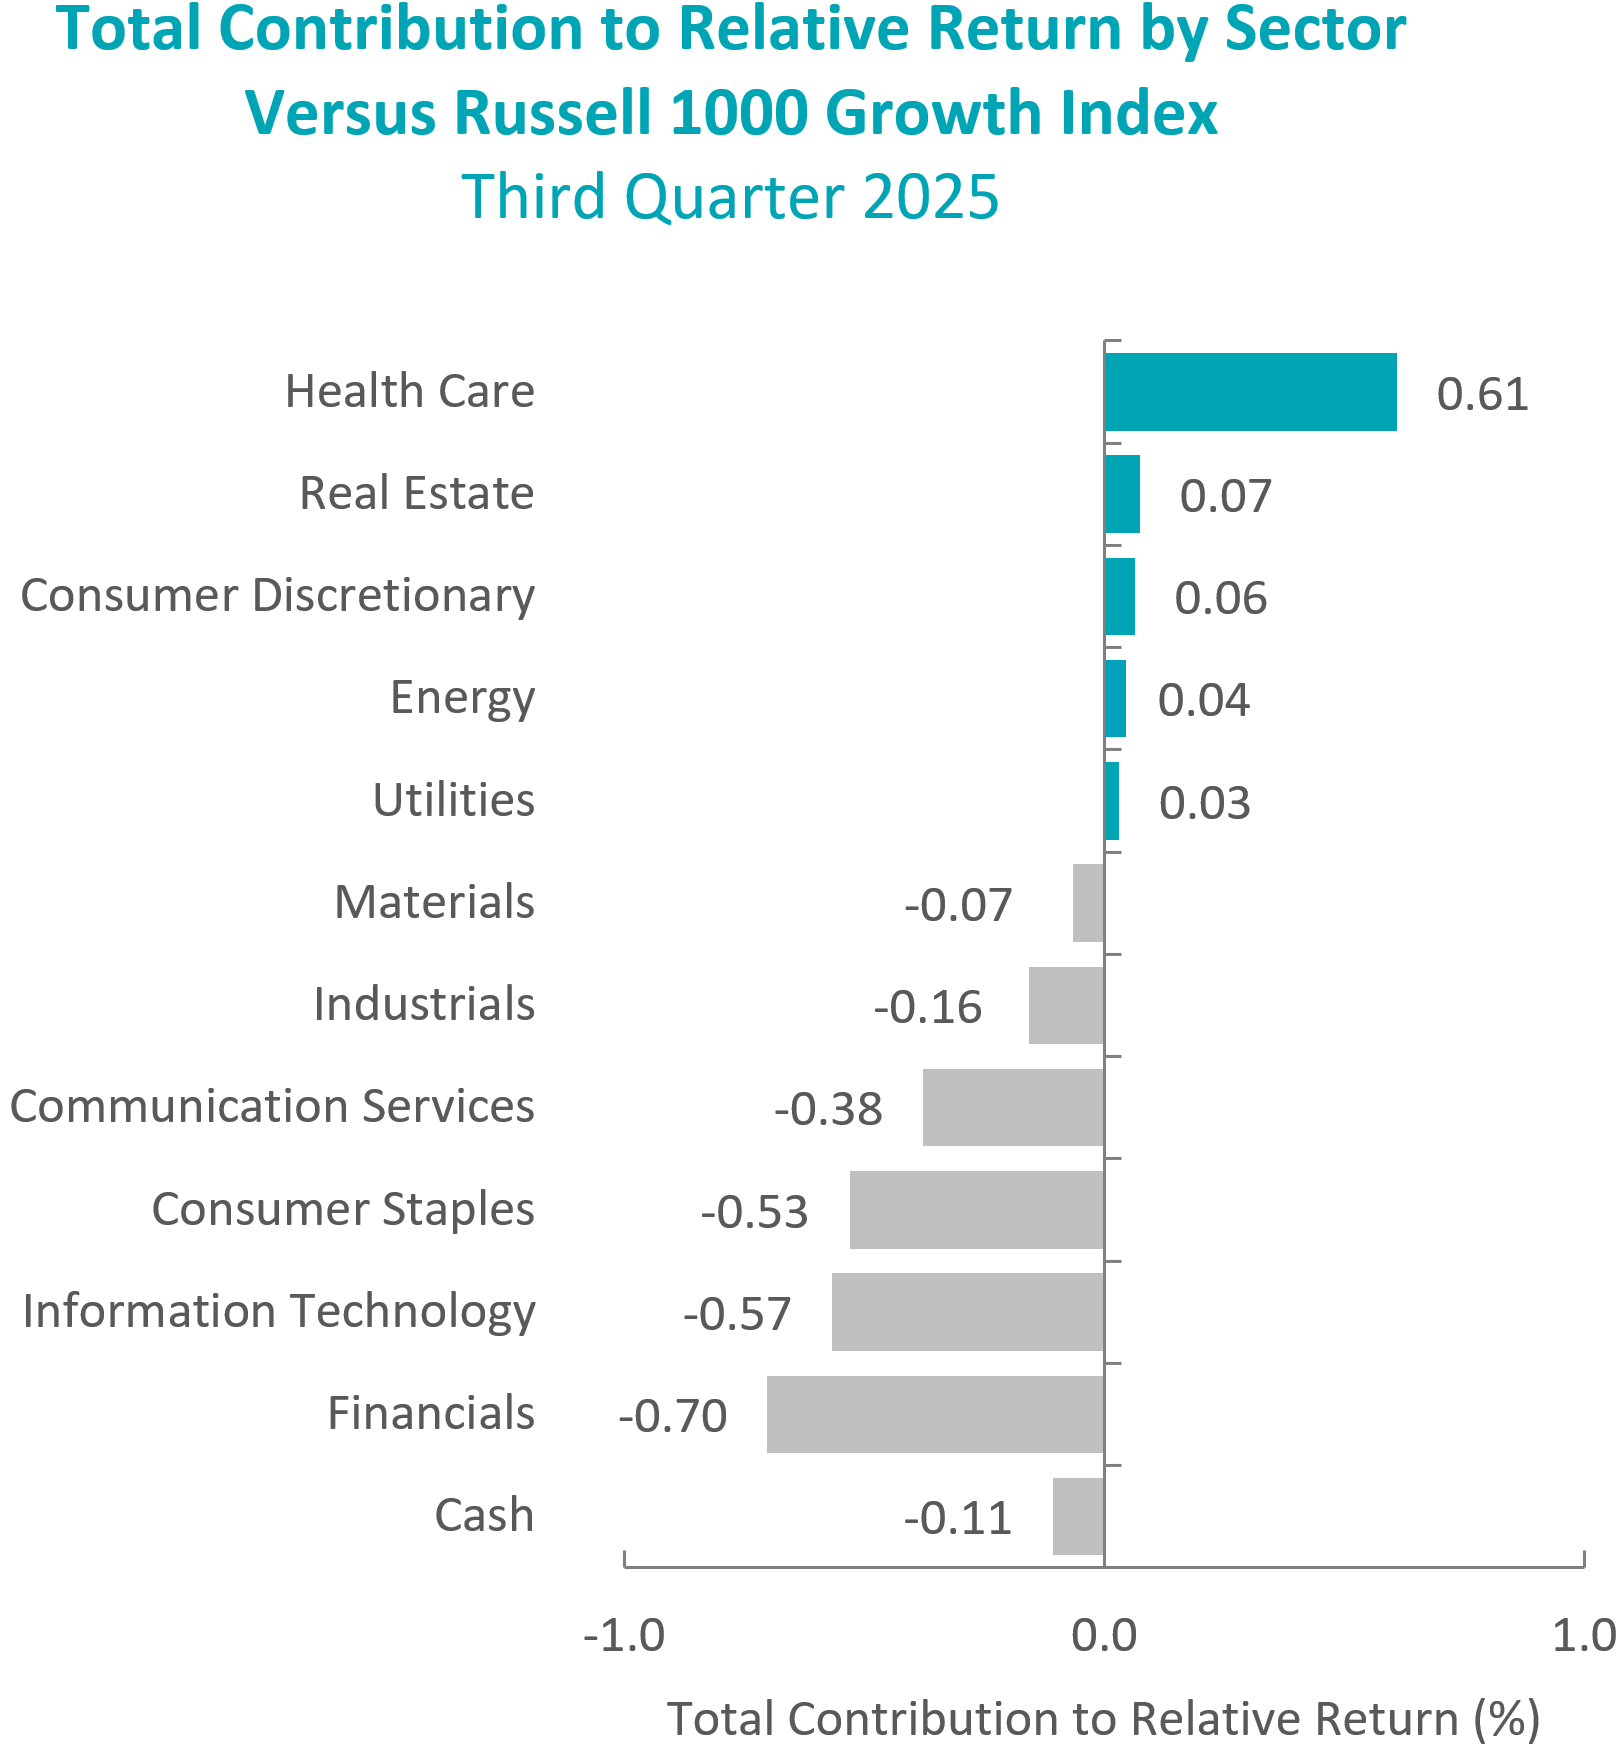
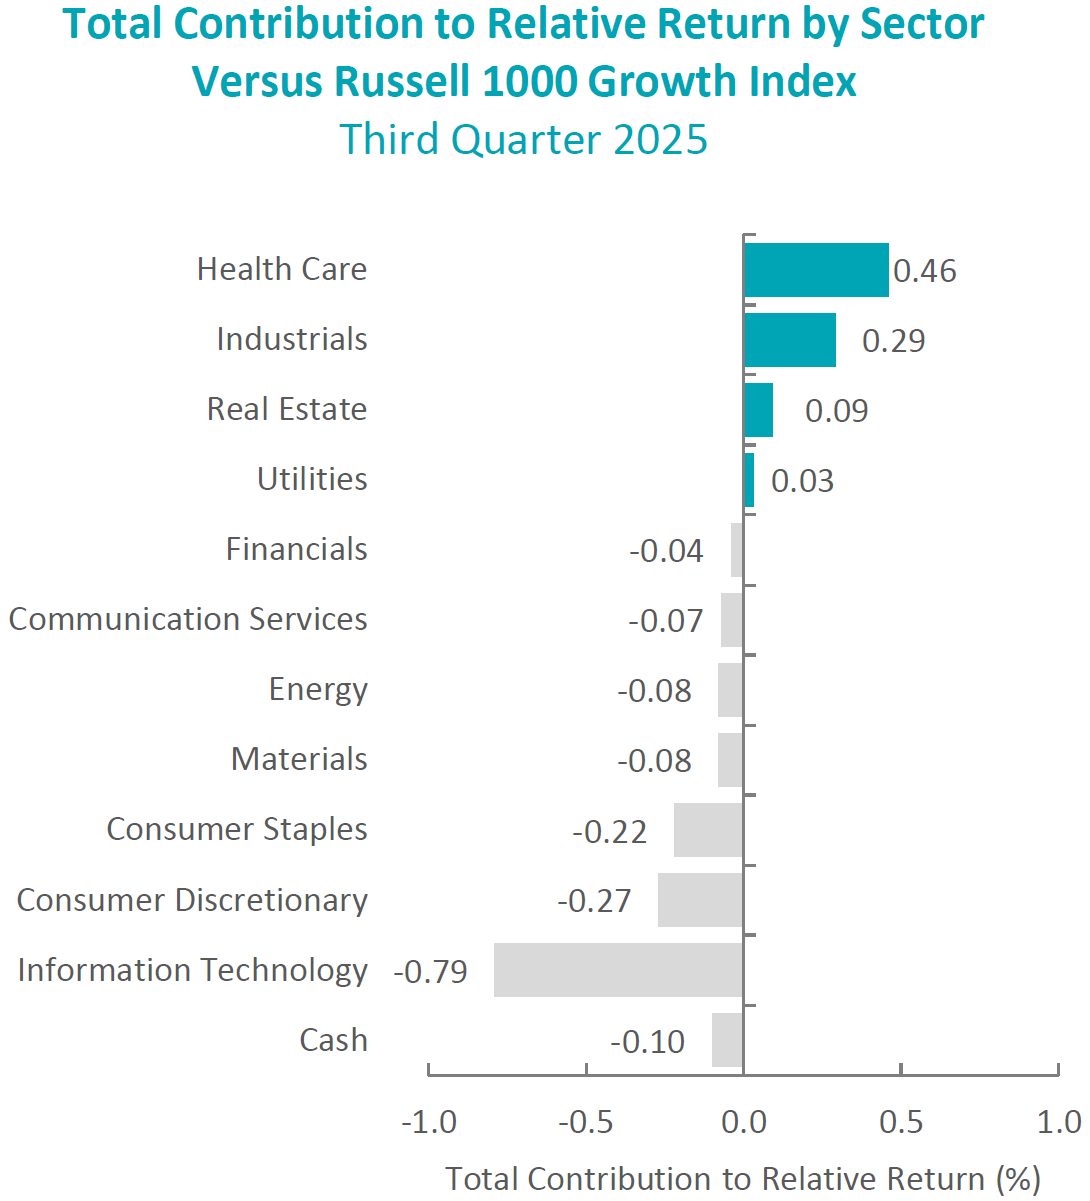
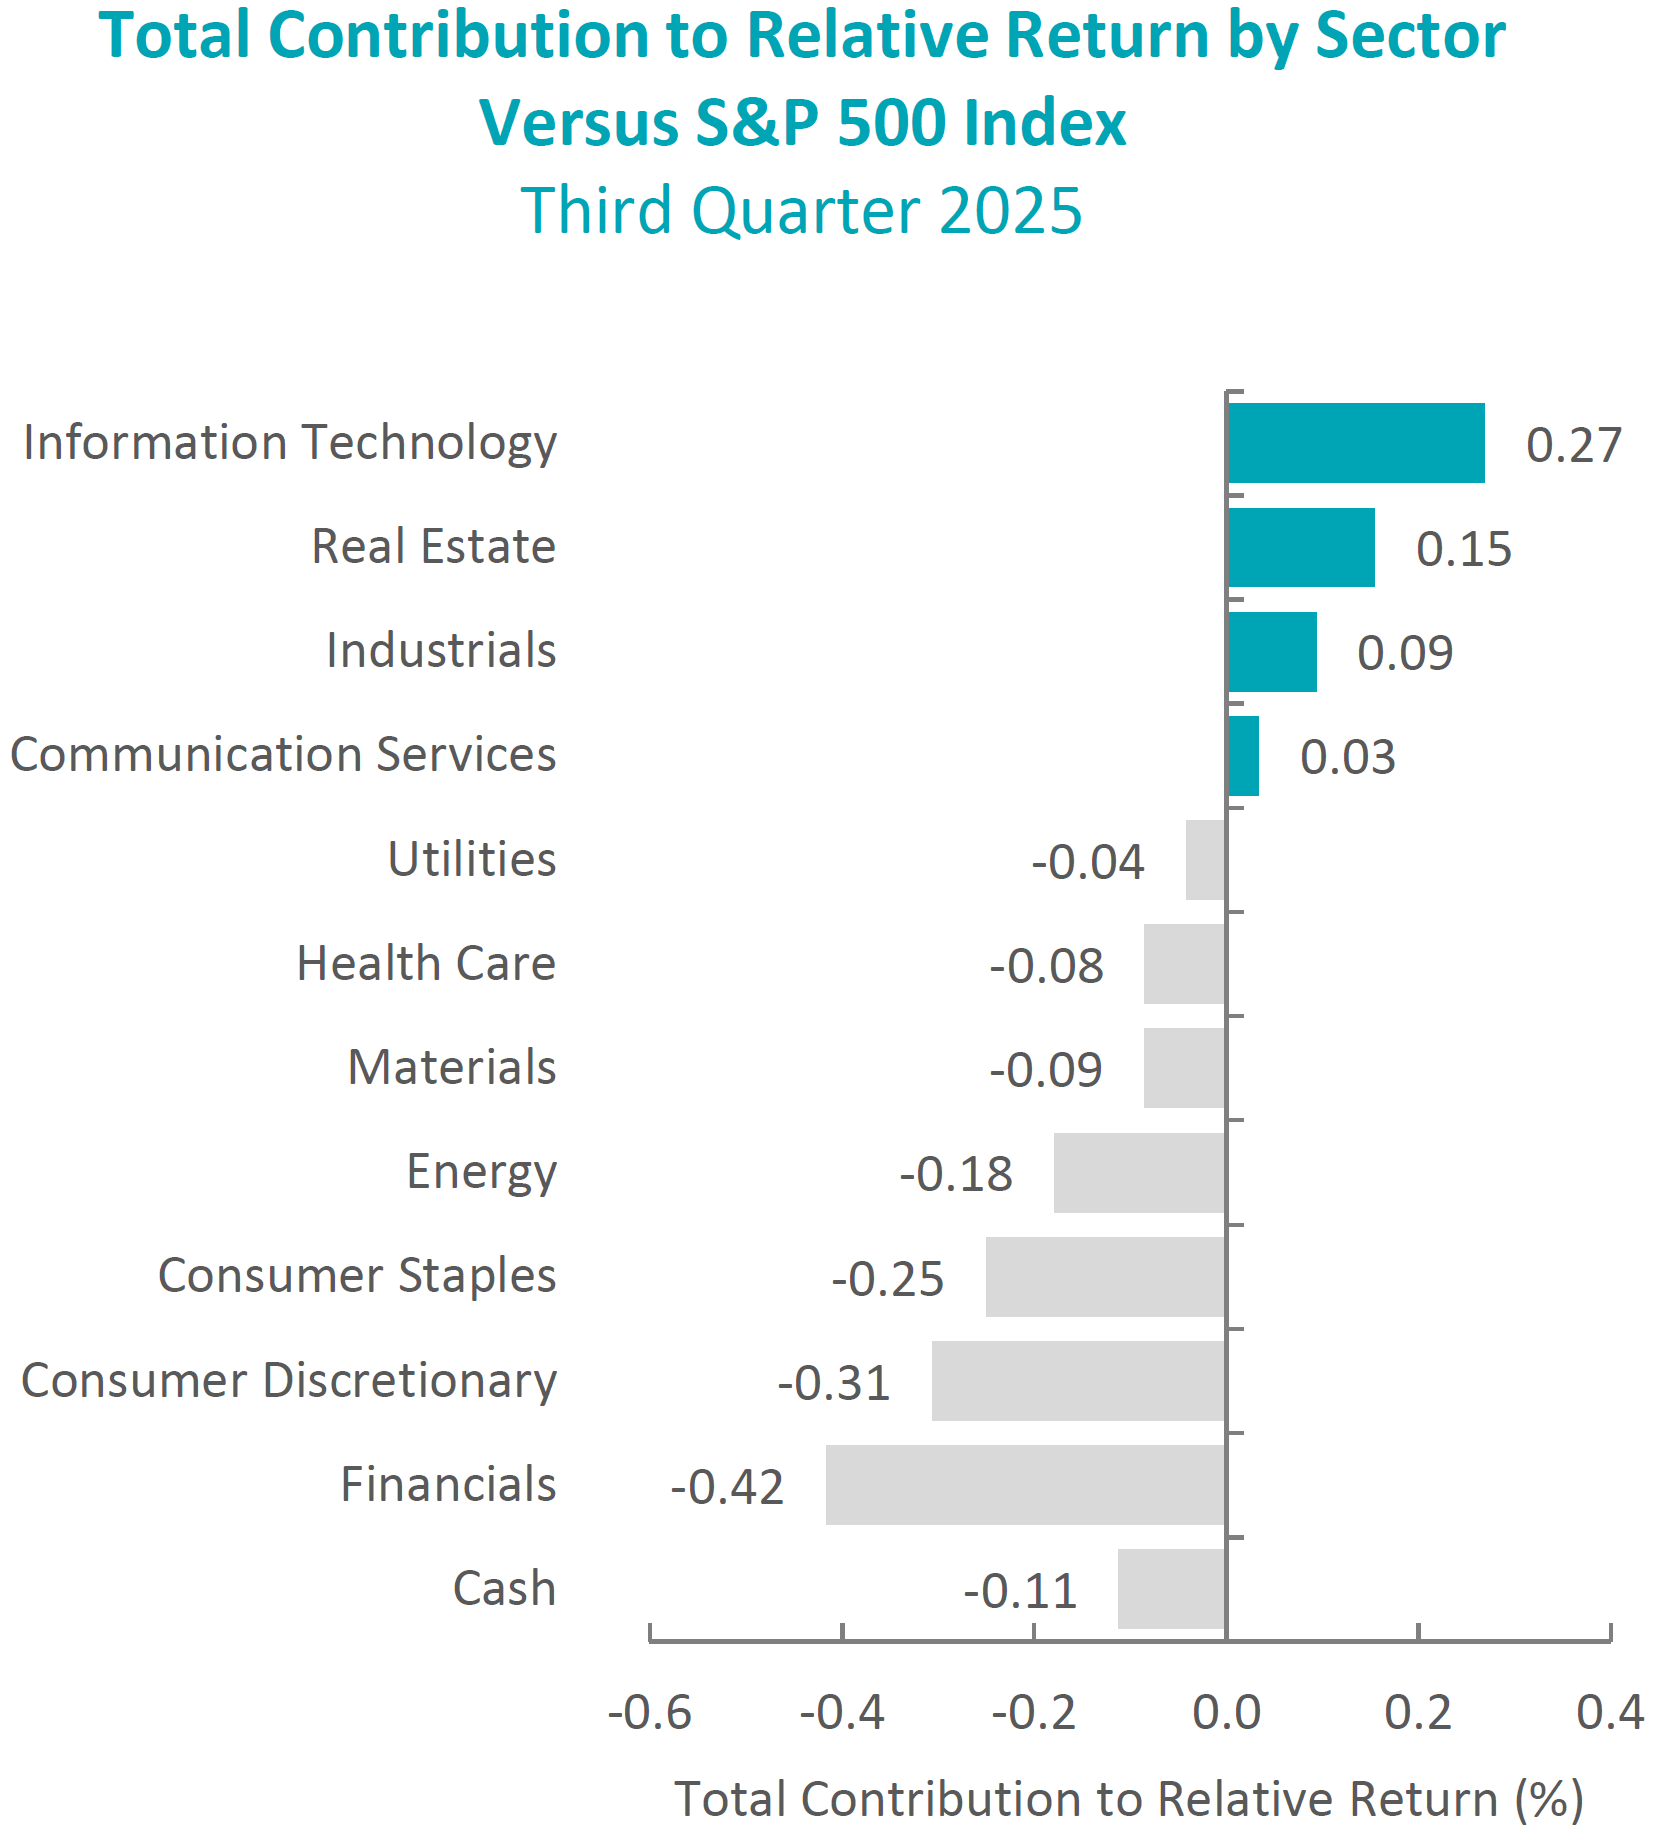
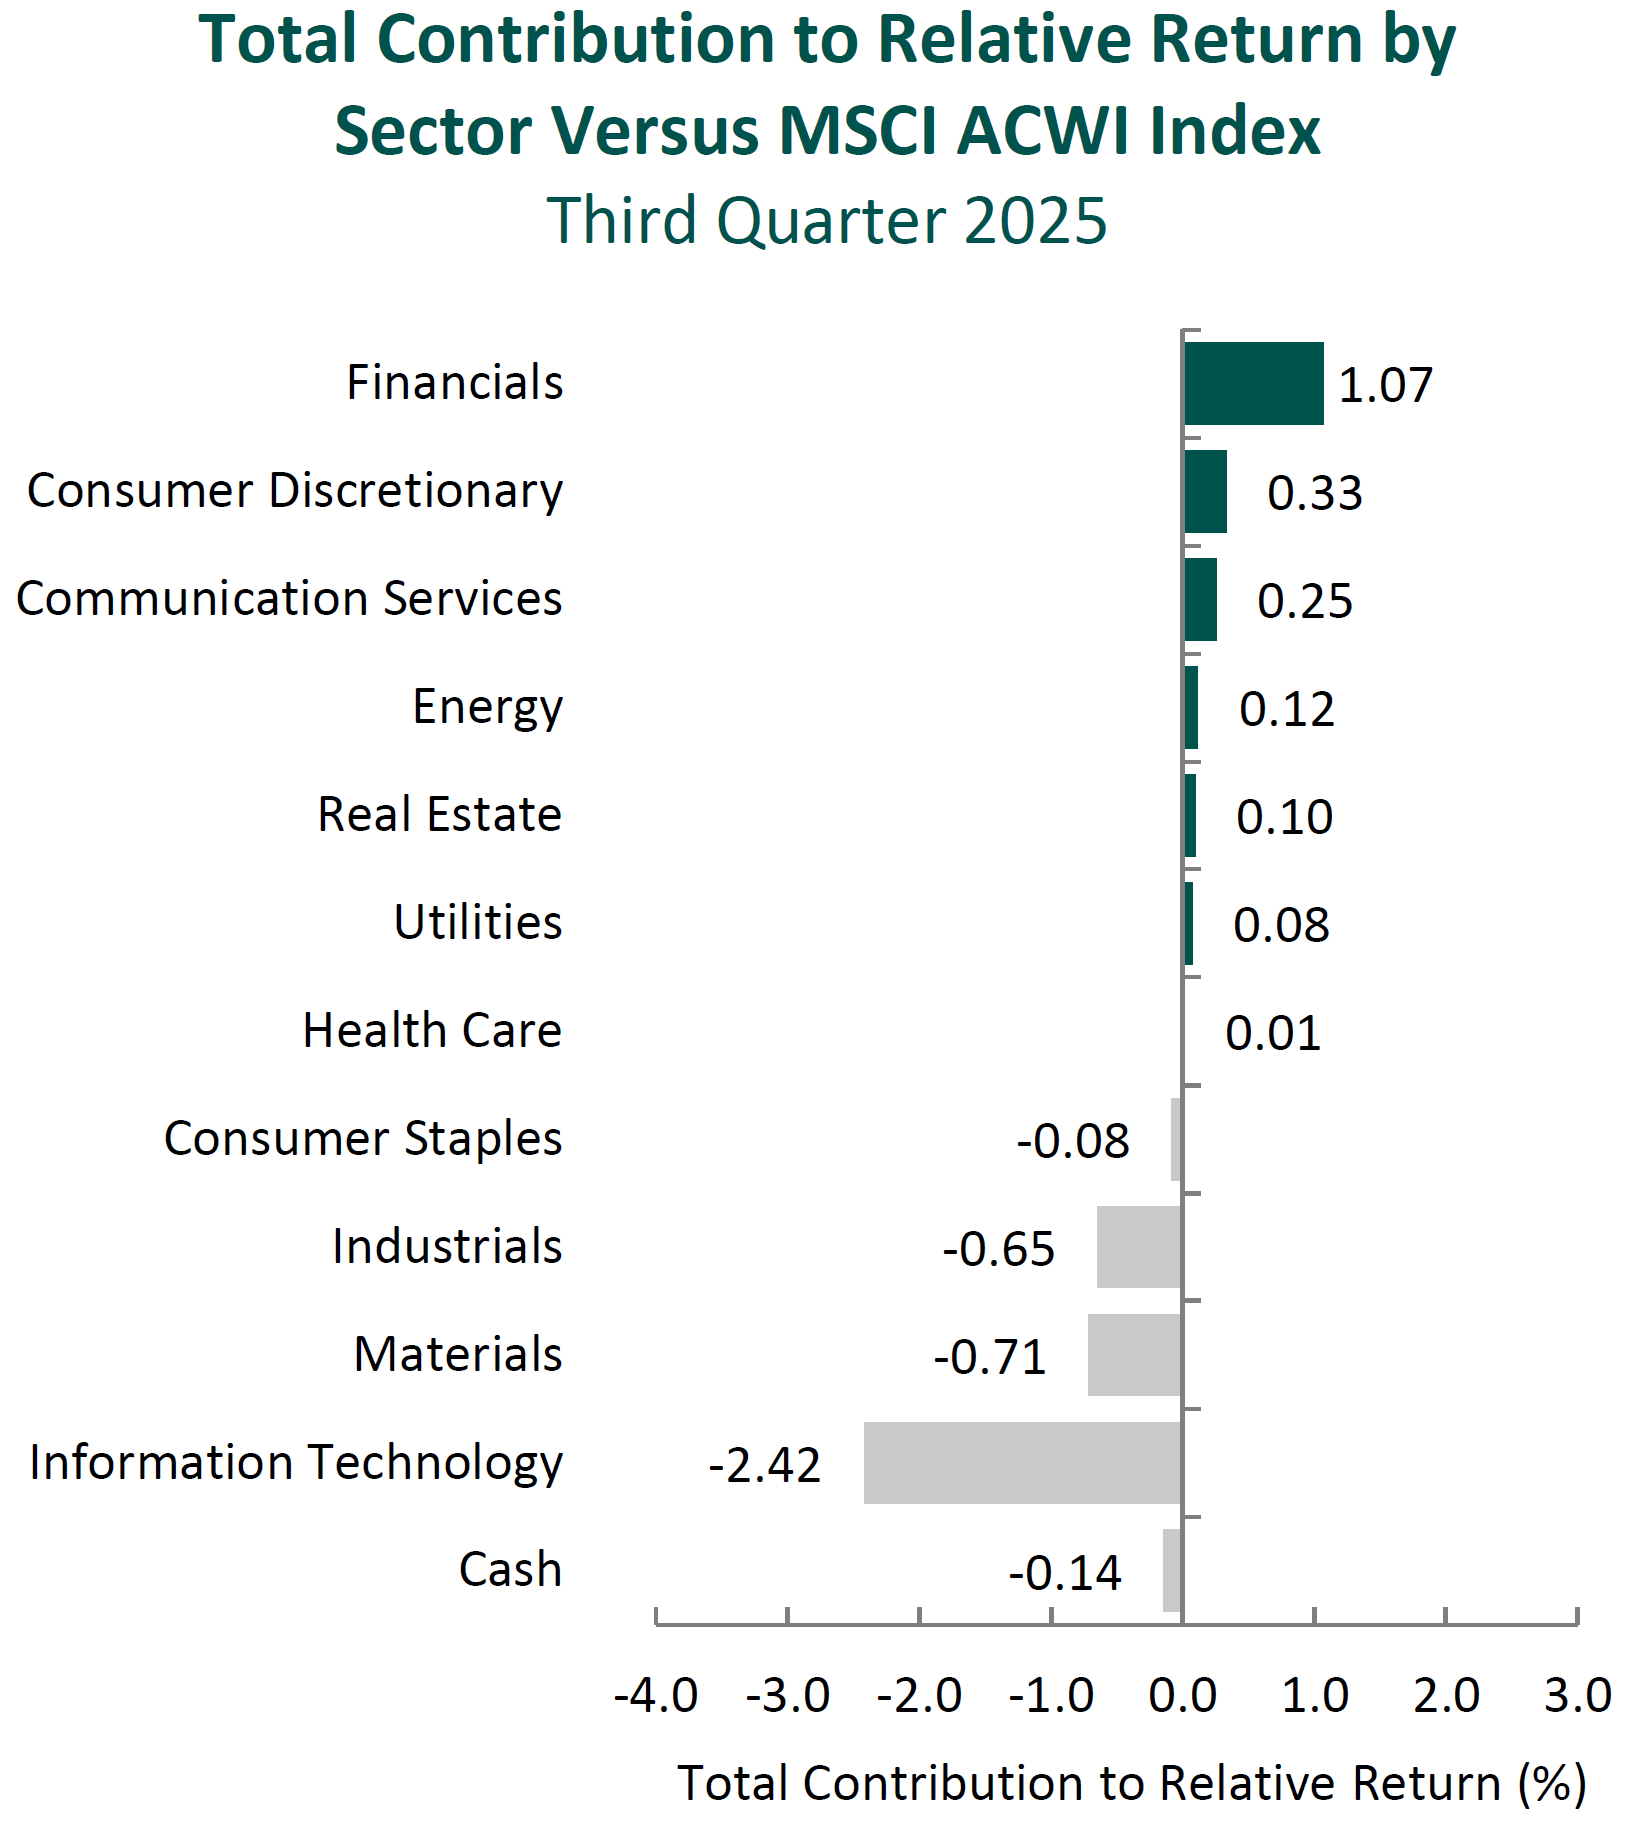
Past performance is not indicative of future results. Sector attribution shows how much of a portfolio’s overall return is directly attributable to stock selection and asset allocation decisions within the portfolio, highlighting which sectors contributed or detracted to the total return. Attribution includes the reinvestment of income. Attribution is presented gross of fees and does not include the deduction of all fees and expenses that a client or investor has paid or would have paid. Please refer to the gross and net composite returns included within to understand the overall impact of fees. Please see important disclosures at the end of this document.
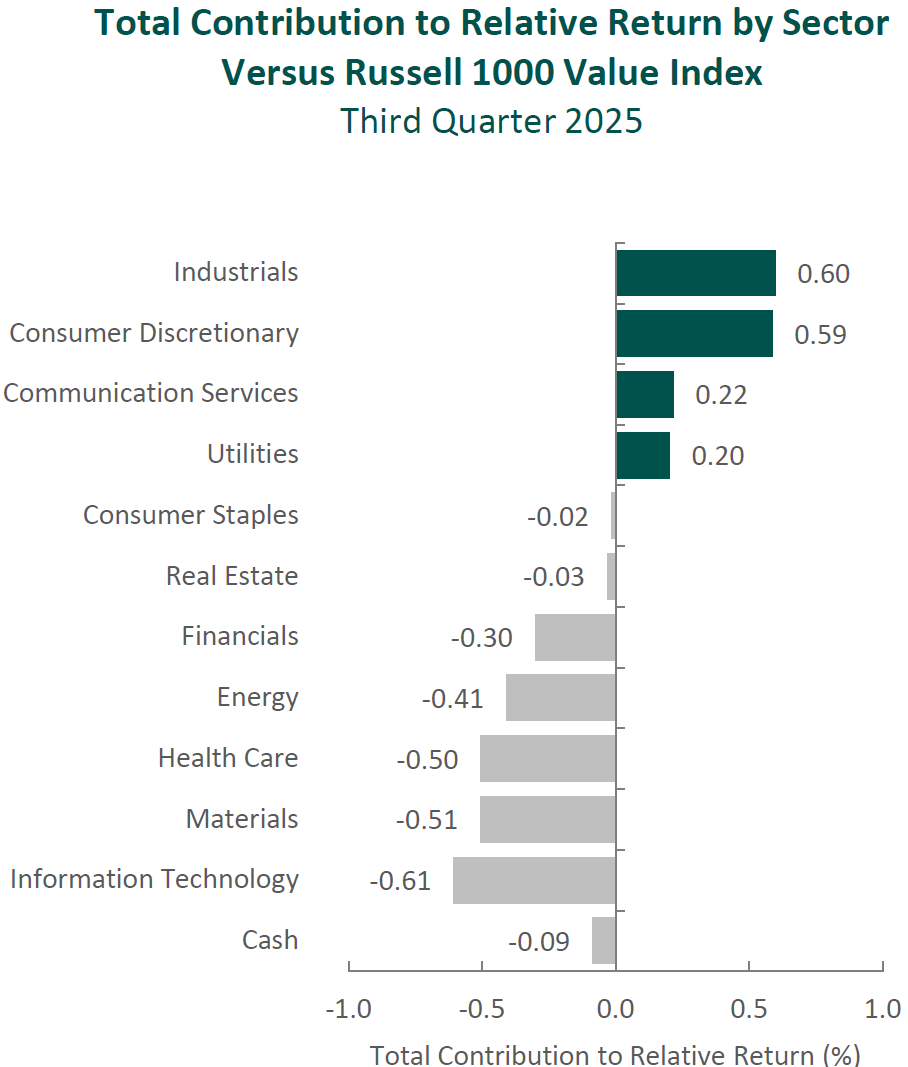
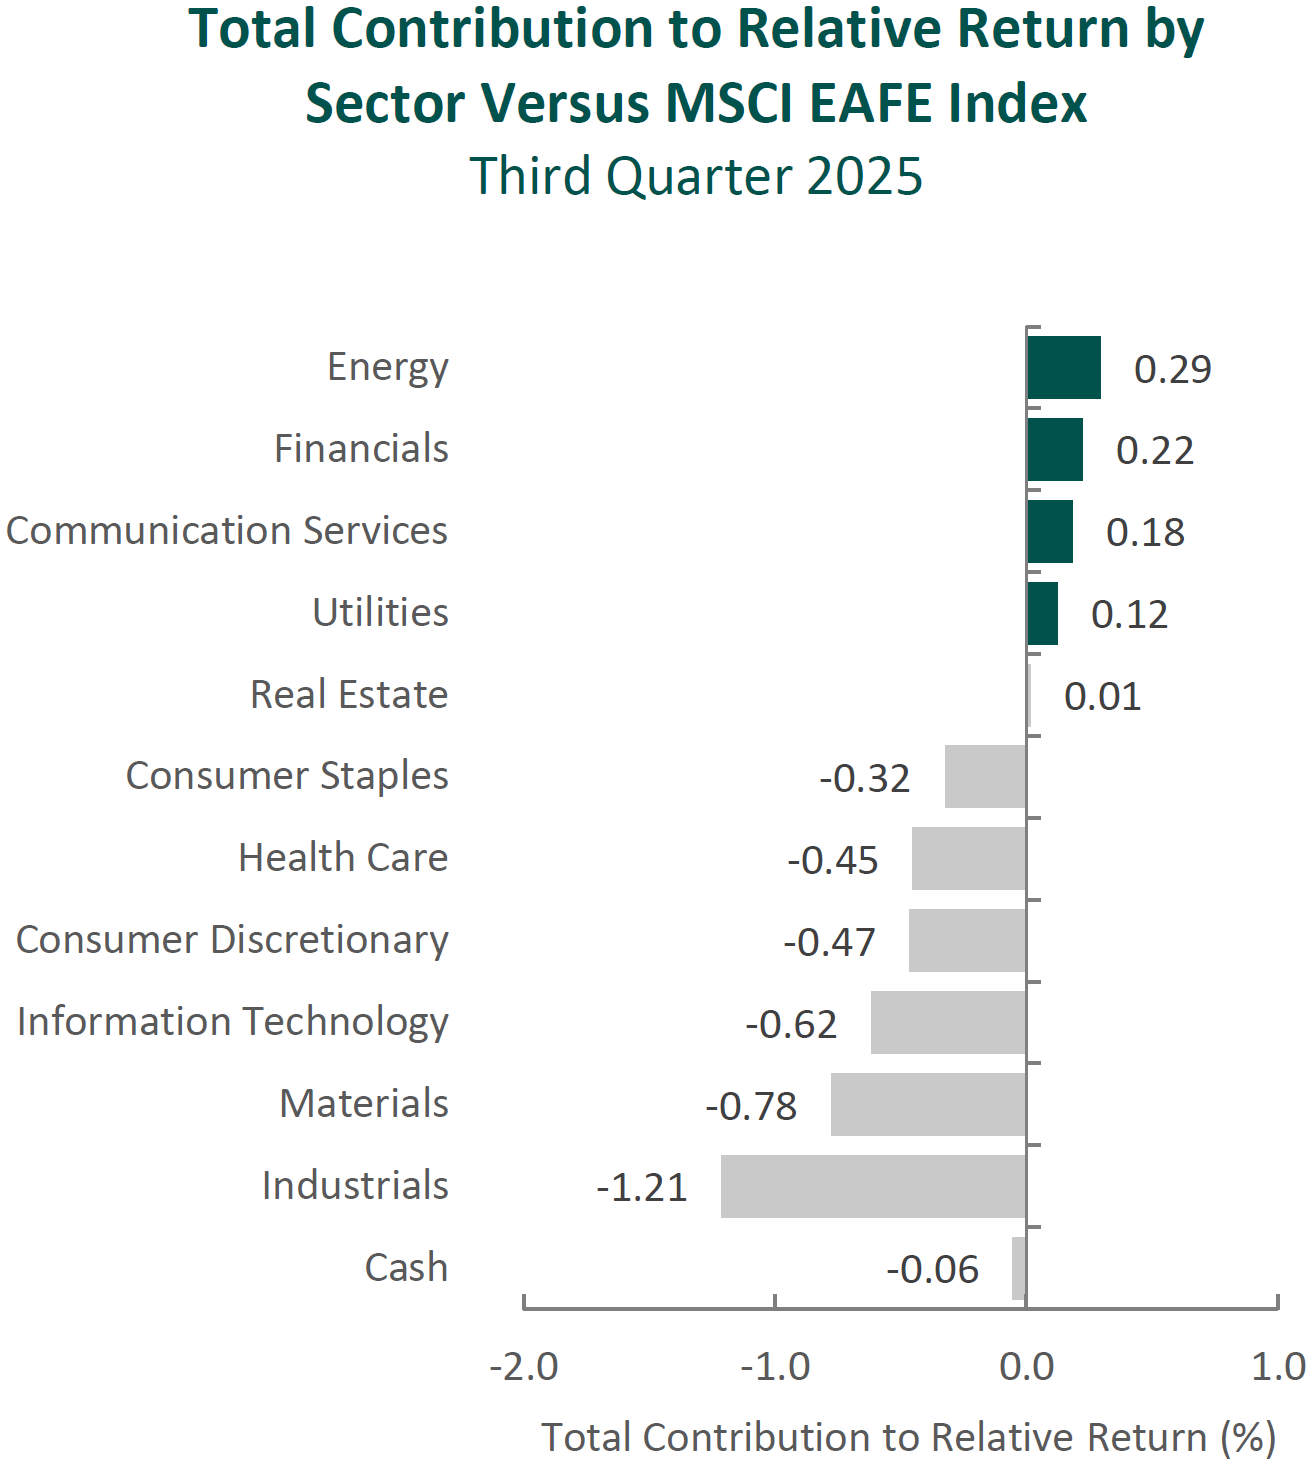
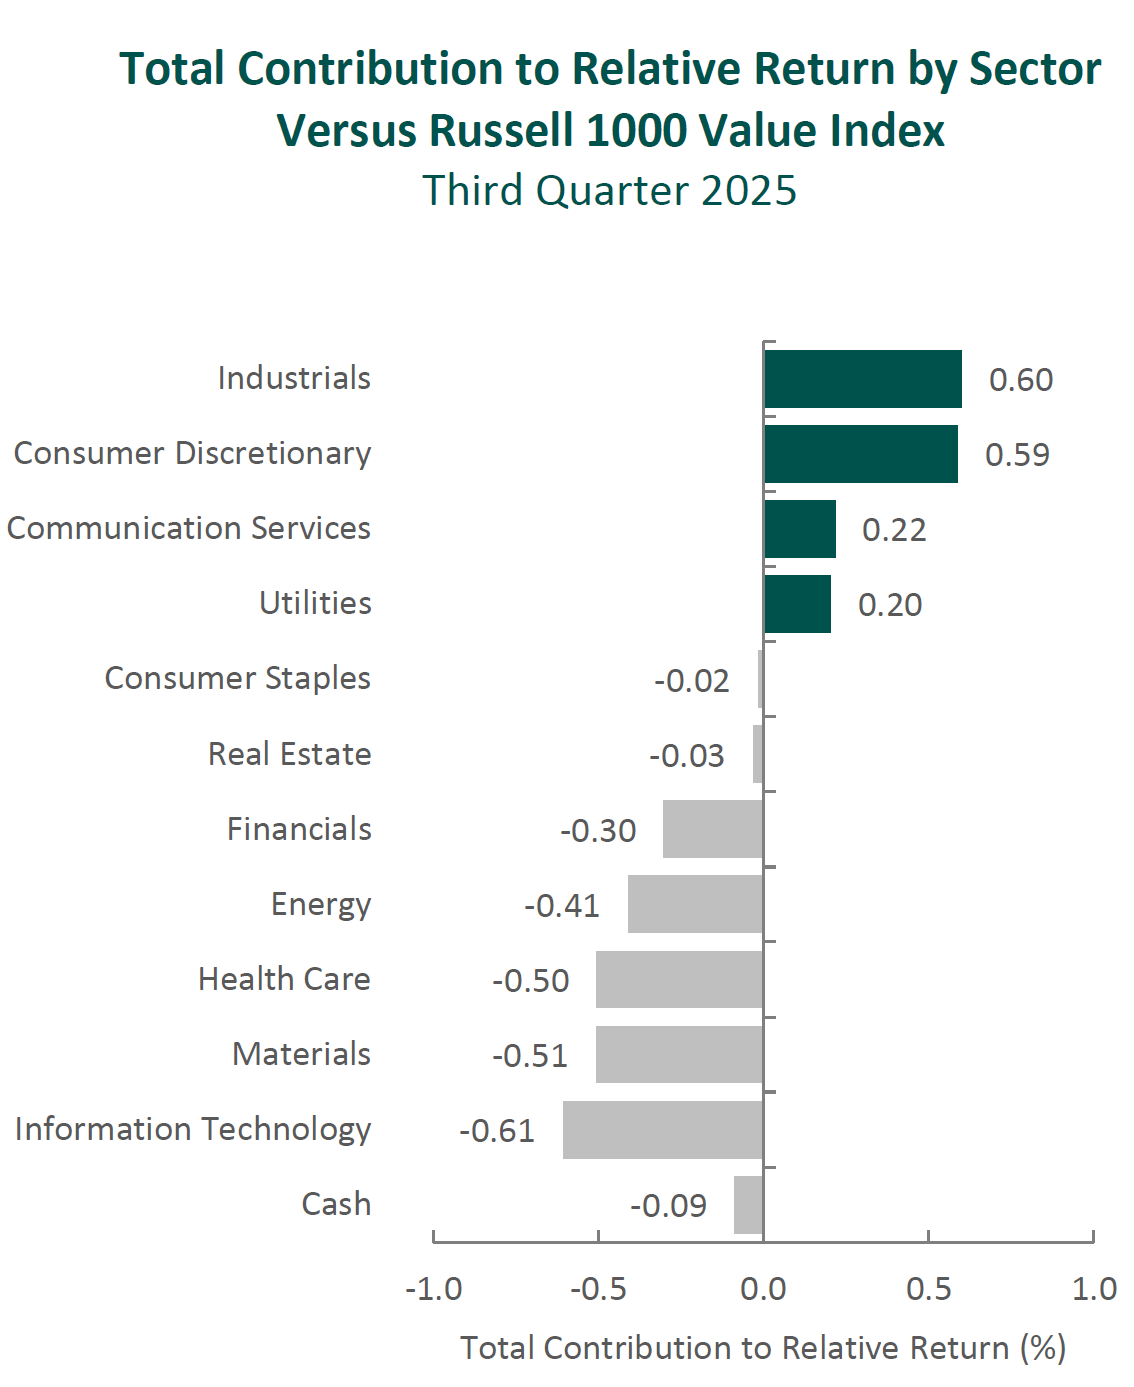
During the third quarter, the portfolio’s underperformance relative to the Russell 1000 Growth Index was due to a mix of security selection and allocation effects. Security selection in Information Technology and Financials detracted the most from relative returns. Conversely, security selection in Health Care and Real Estate contributed the most.
Contributors and Detractors for 3Q 2025
| Relative Contributors | Relative Detractors |
|---|---|
| Oracle | S&P Global |
| Adaptive Biotechnologies | Visa |
| Broadcom | Trane Technologies |
| Guardant Health | Netflix |
| Alphabet | Costco Wholesale |
Detractors
S&P Global
S&P Global detracted from performance in the third quarter as mixed trends highlighted in the company’s second quarter earnings report tempered an otherwise solid outlook. Ratings transaction revenue declined amid softer demand for bank-loan and structured-finance issuance, while ongoing caution around market volatility weighed on sentiment. Although strength in Indices, Market Intelligence, and Global Trading Services supported growth, uneven segment performance created near-term headwinds for the shares.
Visa
Visa detracted from performance in the third quarter as concerns about slowing growth overshadowed solid second quarter operating results. Despite revenue and EPS exceeding consensus expectations, management maintained only modest full-year guidance and signaled softer fourth quarter trends, reinforcing worries of decelerating momentum.
Contributors
Oracle
Oracle contributed to performance in the third quarter due to its transformative growth in cloud infrastructure, with management announcing that Oracle Cloud Infrastructure (OCI) revenue would grow this fiscal year and then increase through fiscal 2030. The stock surged following the closure of multiple multi-billion-dollar deals, including the $30 billion Stargate contract with OpenAI. Additionally, remaining performance obligation (RPO) growth reached 359%, providing investors with greater visibility into future revenue streams.
Adaptive Biotechnologies
Adaptive Biotechnologies contributed to performance in the third quarter as momentum continued in its minimal residual disease (MRD) testing business, anchored by its flagship clonoSEQ test for MRD in several hematological cancers. During the quarter, the company reported better-than-expected earnings and raised full-year guidance. Average selling price (ASP) increases are complementing accelerating volume growth.
Recent Portfolio Activity
TThe table below shows all buys and sells completed during the quarter, followed by a brief rationale.
| Buys | Sells |
|---|---|
| Shopify | Adobe |
Buys
Shopify
Shopify is a global commerce technology company that empowers businesses of all sizes to start, scale, market, and operate efficiently through a comprehensive, multi-channel platform. The company’s focus is to make commerce better for everyone by providing simple, reliable tools and services that enhance the shopping experience for consumers and streamline operations for merchants. Shopify’s business model includes recurring subscription solutions and merchant success-based solutions, supporting millions of merchants across more than 175 countries. The platform enables seamless management of products, sales, and customer relationships across online, physical, and social channels, with a focus on continuous innovation and robust infrastructure to help merchants thrive in a competitive market.
We see Shopify as the dominant force in e-commerce enablement, benefiting from the secular shift toward online retail and the growing ecosystem of merchants seeking direct-to-consumer channels, consistently gaining market share as competitors lose ground. We think the company’s financial momentum is robust, with revenue growth accelerating and record gross merchandise volume, while structural profitability and strong free cash flow illustrate its scalable model. Shopify’s expanding suite of merchant solutions deepens customer engagement and increases revenue per merchant over time. International expansion is a key driver, with global revenue and gross merchandise value (GMV) outpacing North America and local competitors. We also see high customer retention fueled by integrated merchant services that create significant switching costs, supporting long-term platform stickiness. Shopify’s aggressive investment in AI—through features like Shopify Magic, Sidekick, and strategic partnerships—powers innovation and personalized shopping experiences. The platform’s extensive merchant base and thriving app ecosystem reinforce its competitive moat, making Shopify a flexible and difficult-to-replicate “commerce OS (Operating System)” for millions of businesses worldwide. We recognize that the stock trades at a premium to SaaS peers but view the company’s acceleration in revenue growth from increasing market share in both North America and international markets, a widening competitive moat, and increasing profitability through higher revenue per customer as supportive of the premium valuation.
Sells
Adobe
We sold Adobe and believe that competition relative to the company’s creative product suite offerings from AI startups and hyperscalers continues to increase. We believe these competitive threats will continue to pressure seats and pricing initiatives and don’t believe that Adobe’s own AI product offerings will be able to increase monetization fast enough, creating a risk to the company’s Digital Media Annualized Recurring Revenue (ARR) growth rates.
Outlook
The equity markets in the third quarter rose to new highs on the back of multiple expansion and higher earnings. Interest rates declined slightly in the quarter, with the prospect of further easing as the Fed lowers rates. There is still uncertainty around the impact of tariffs as inventories are worked off and price hikes filter through the inflation data. The markets are trading at the upper end of historical valuation levels and will need a combination of lower rates and higher corporate profits to achieve new highs. The economic data was mixed in the quarter, with inflation data largely in line with expectations but employment showing signs of weakening. A strong technology investment cycle, lower interest rates and growing corporate profits should continue to support higher equity prices. Our focus will continue to be at the company level, with an emphasis on seeking to invest in companies with secular tailwinds or strong product-driven cycles.
The opinions expressed herein are those of Aristotle Atlantic Partners, LLC (Aristotle Atlantic) and are subject to change without notice. Past performance is not a guarantee or indicator of future results. This material is not financial advice or an offer to purchase or sell any product. You should not assume that any of the securities transactions, sectors or holdings discussed in this report were or will be profitable, or that recommendations Aristotle Atlantic makes in the future will be profitable or equal the performance of the listed in this report. The portfolio characteristics shown relate to the Aristotle Atlantic Focus Growth strategy. Not every client’s account will have these characteristics. Aristotle Atlantic reserves the right to modify its current investment strategies and techniques based on changing market dynamics or client needs. There is no assurance that any securities discussed herein will remain in an account’s portfolio at the time you receive this report or that securities sold have not been repurchased. The securities discussed may not represent an account’s entire portfolio and, in the aggregate, may represent only a small percentage of an account’s portfolio holdings. The performance attribution presented is of a representative account from Aristotle Atlantic’s Focus Growth Composite. The representative account is a discretionary client account which was chosen to most closely reflect the investment style of the strategy. The criteria used for representative account selection is based on the account’s period of time under management and its similarity of holdings in relation to the strategy. Recommendations made in the last 12 months are available upon request. Returns are presented gross and net of investment advisory fees and include the reinvestment of all income. Gross returns will be reduced by fees and other expenses that may be incurred in the management of the account. Net returns are presented net of actual investment advisory fees and after the deduction of all trading expenses.
All investments carry a certain degree of risk, including the possible loss of principal. Investments are also subject to political, market, currency and regulatory risks or economic developments. International investments involve special risks that may in particular cause a loss in principal, including currency fluctuation, lower liquidity, different accounting methods and economic and political systems, and higher transaction costs. These risks typically are greater in emerging markets. While Large-capitalization companies may have more stable prices than smaller, less established companies, they are still subject to equity securities risk. In addition, large-capitalization equity security prices may not rise as much as prices of equity securities of small-capitalization companies. Securities of small- and medium-sized companies tend to have a shorter history of operations, be more volatile and less liquid. Value stocks can perform differently from the market as a whole and other types of stocks. The material is provided for informational and/or educational purposes only and is not intended to be and should not be construed as investment, legal or tax advice and/or a legal opinion. Investors should consult their financial and tax adviser before making investments. The opinions referenced are as of the date of publication, may be modified due to changes in the market or economic conditions, and may not necessarily come to pass. Information and data presented has been developed internally and/or obtained from sources believed to be reliable. Aristotle Atlantic does not guarantee the accuracy, adequacy or completeness of such information.
Aristotle Atlantic Partners, LLC is an independent registered investment adviser under the Advisers Act of 1940, as amended. Registration does not imply a certain level of skill or training. More information about Aristotle Atlantic, including our investment strategies, fees and objectives, can be found in our Form ADV Part 2, which is available upon request. AAP-2510-23
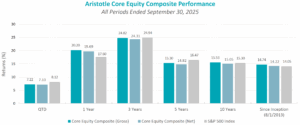
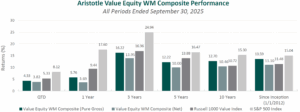
Sources: CAPS CompositeHubTM
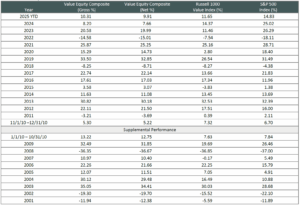
Composite returns for all periods ended September 30, 2025 are preliminary pending final account reconciliation.
Past performance is not indicative of future results. Performance results for periods greater than one year have been annualized. Returns are presented gross and net of investment advisory fees and include the reinvestment of all income. Gross returns will be reduced by fees and other expenses that may be incurred in the management of the account. Net returns are presented net of actual investment advisory fees and after the deduction of all trading expenses.
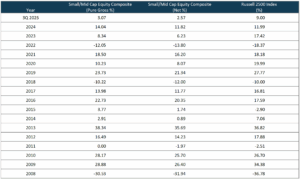
The Russell 1000® Growth Index measures the performance of the large cap growth segment of the U.S. equity universe. It includes those Russell 1000 companies with higher price-to-book ratios and higher forecasted growth values. This index has been selected as the benchmark and is used for comparison purposes only. The Russell 1000® Value Index measures the performance of the large cap value segment of the U.S. equity universe. It includes those Russell 1000 companies with lower price-to-book ratios and lower expected growth values. The S&P 500® Index is the Standard & Poor’s Composite Index of 500 stocks and is a widely recognized, unmanaged index of common stock prices. The Russell 2000® Index measures the performance of the small cap segment of the U.S. equity universe. The Russell 2000 Index is a subset of the Russell 3000® Index representing approximately 10% of the total market capitalization of that index. It includes approximately 2,000 of the smallest securities based on a combination of their market cap and current index membership. The Dow Jones Industrial Average® is a price-weighted measure of 30 U.S. blue-chip companies. The Index covers all industries except transportation and utilities. The NASDAQ Composite Index measures all NASDAQ domestic and international based common type stocks listed on The NASDAQ Stock Market. The NASDAQ Composite includes over 3,000 companies, more than most other stock market indices. The Bloomberg U.S. Aggregate Bond Index is an unmanaged index of domestic investment grade bonds, including corporate, government and mortgage-backed securities. The WTI Crude Oil Index is a major trading classification of sweet light crude oil that serves as a major benchmark price for oil consumed in the United States. The 3-Month U.S. Treasury Bill is a short-term debt obligation backed by the U.S. Treasury Department with a maturity of three months. The Consumer Price Index (CPI) is a measure of the average change over time in the prices paid by urban consumers for a market basket of consumer goods and services. While stock selection is not governed by quantitative rules, a stock typically is added only if the company has an excellent reputation, demonstrates sustained growth and is of interest to a large number of investors. The volatility (beta) of the Composite may be greater or less than its respective benchmarks. It is not possible to invest directly in these indices.


 Sources: CAPS Composite Hub, Russell Investments