This site has been created for institutional investors and RIAs. An institutional investor is an entity that invests capital on behalf of others such as pension funds, banks, insurance companies, mutual funds, foundations/endowments, trust companies or other large investors and their investment consultants. RIA is a registered investment advisor who is responsible for allocating their client funds. This site is not intended for individual investor access, as it does not consider individual risk tolerances or investment objectives of an individual investor. Click “Accept and Continue” to affirm you meet the description of an Institutional Investor.
This site has been designed for financial intermediaries such as financial advisors, wealth managers, broker/dealers and home office research teams. This site is not intended for individual investor access, as it does not consider individual risk tolerances or investment objectives of an individual investor. Click “Accept and Continue” to affirm you meet the description of a Financial Advisor.
This area of the website contains information that is general and/or educational in nature. Individual investors should consider their own investment objectives and risk tolerances or consult with a financial advisor before making any investment decision. Click “Accept and Continue” to continue.
Recent headwinds to Value Equity have reflected multiple expansion within a narrowly led benchmark, while portfolio fundamentals remain strong. We believe this creates a compelling opportunity.
To read the full piece, please use the link below.
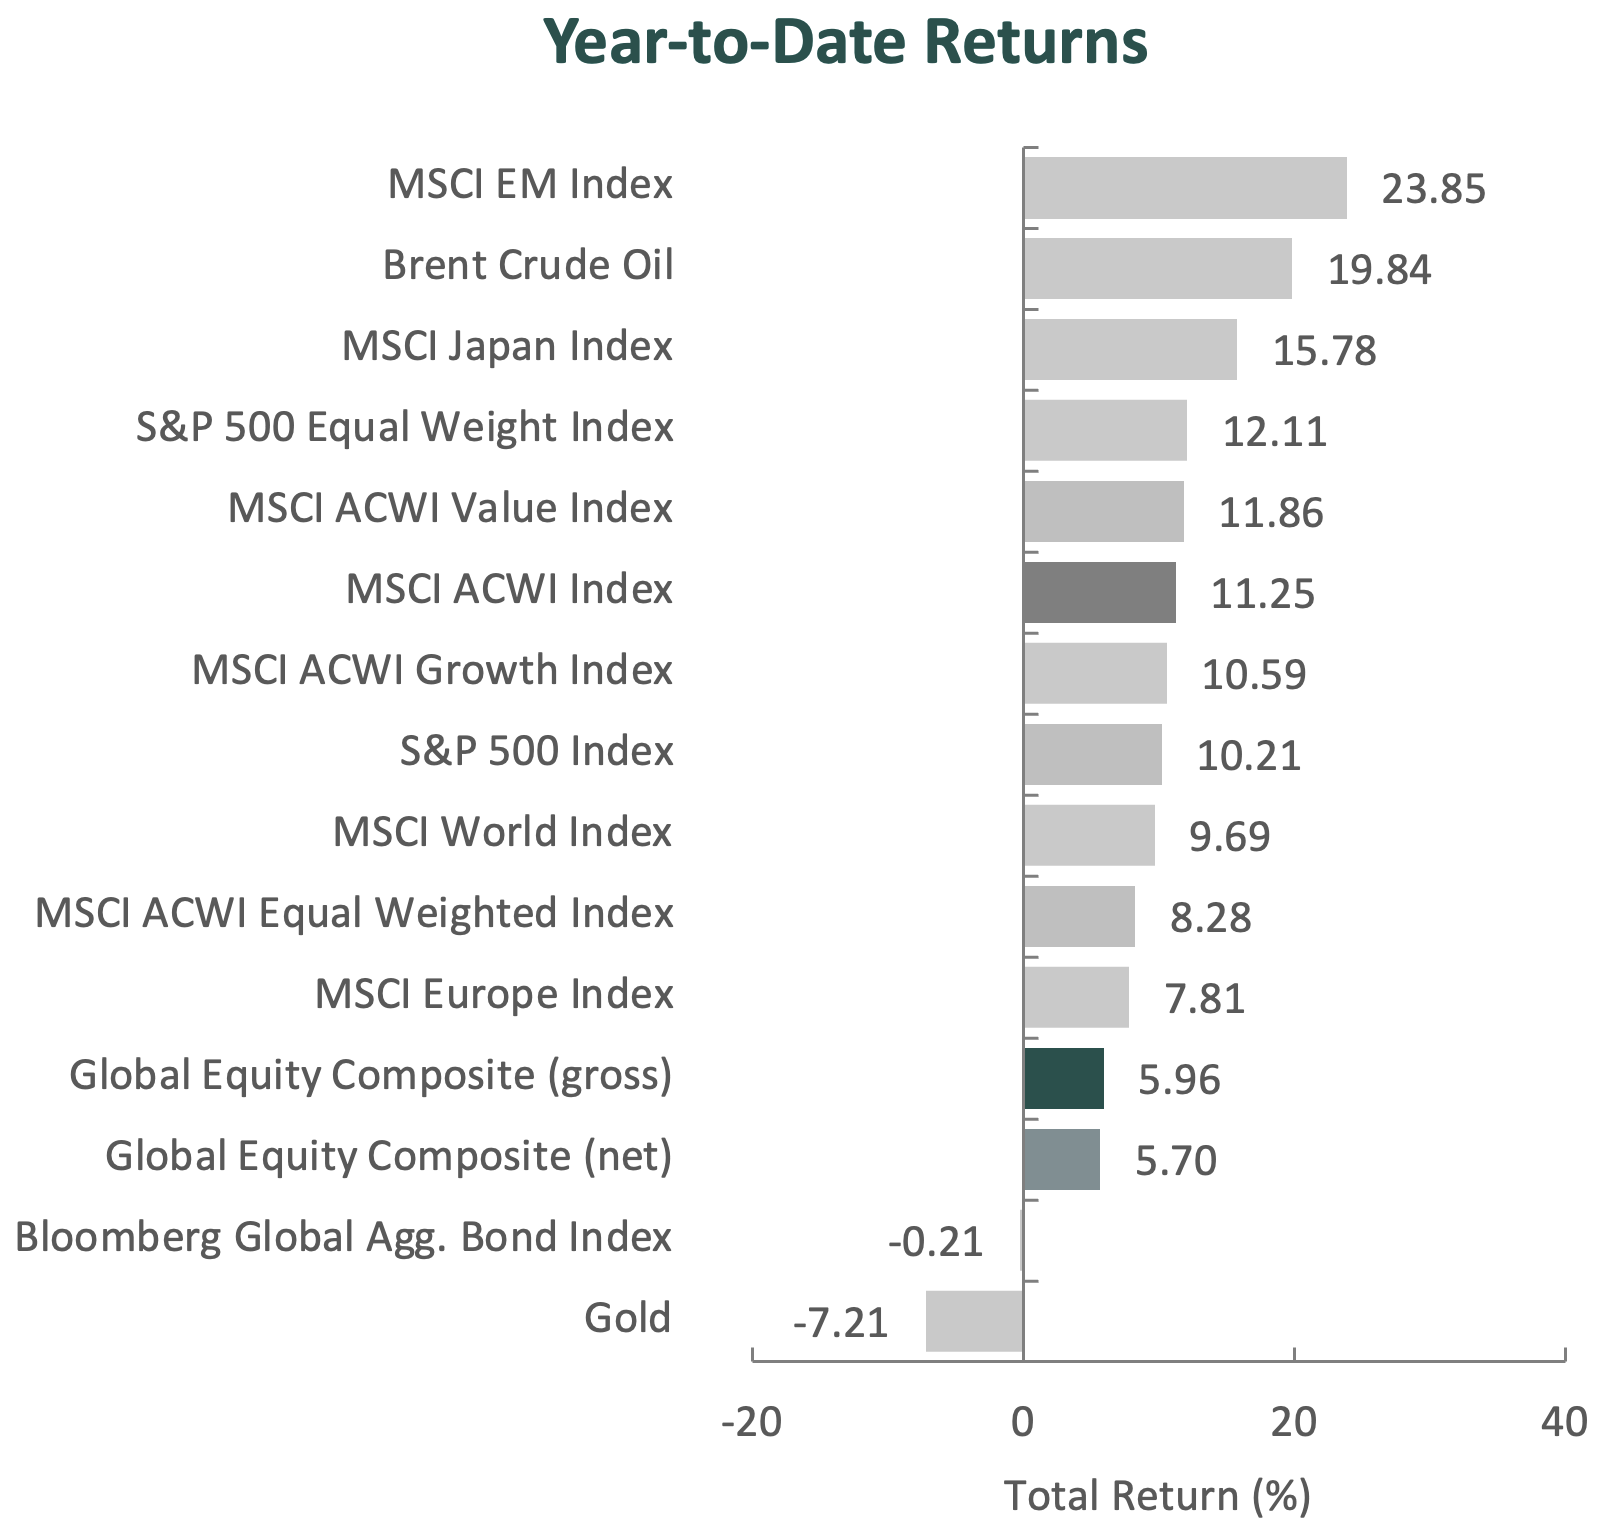
(All MSCI index returns are shown net and in U.S. dollars unless otherwise noted.)
Markets Review
Sources: CAPS CompositeHubTM, Bloomberg Past performance is not indicative of future results. Aristotle Global Equity Composite returns are presented gross and net of model fees and include the reinvestment of all income. Gross returns will be reduced by fees and other expenses that may be incurred in the management of the account. Net returns are calculated by subtracting a model fee of 0.50% on an annual basis or 0.04167% on a monthly basis, which includes trading costs and the revinvestment of all income. Please see important disclosures at the end of this document.
Global equity markets rallied to record highs in the second quarter, with the MSCI ACWI Index rising 14.93% during the period. Global fixed income markets also advanced, as the Bloomberg Global Aggregate Bond Index increased 0.87%. From a style perspective, growth stocks outperformed value, with the MSCI ACWI Growth Index exceeding the MSCI ACWI Value Index by 9.21%.
Performance across global equity markets was broadly positive during the period, led by gains in Asia/Pacific ex-Japan and North America, while Latin America and Africa/Middle East lagged. On a sector basis, ten out of the eleven sectors within the MSCI ACWI Index advanced, led by Information Technology, Industrials, and Financials. Alternatively, Energy, Materials, and Utilities were the worst performers.
Geopolitics remained a source of volatility, particularly in the Middle East, where the ongoing conflict between the U.S. and Iran affected energy markets, shipping routes, and investor sentiment. During the quarter, intermittent military strikes and recurring threats to commercial shipping in and around the Strait of Hormuz kept investors focused on the potential for disruptions to global energy supply. Late in the period, a temporary ceasefire and negotiations briefly eased these concerns. However, developments shortly after quarter-end, including renewed hostilities and President Trump’s statement that the ceasefire was over, underscored the fragility of the situation and the potential for renewed volatility in energy markets.
As the two sides worked toward peace, global economies continued to feel the negative impact of the war. Due to the inflationary shock from the conflict, the European Central Bank raised interest rates during the quarter; however, concerns about stagflation increased on news that real GDP growth in the eurozone had contracted versus the previous quarter. Meanwhile, the Bank of England and U.S. Federal Reserve kept rates steady, despite elevated inflation in both countries. In Asia, the Bank of Japan raised rates, and South Korea’s government passed a $17.7 billion emergency supplementary budget to offset rising oil prices.
Despite the fragile global economic backdrop, earnings in Europe and Asia remained robust, supported by continued demand tied to AI infrastructure and strength in select commodity-linked industries. Beneath the surface, market leadership reflected a more risk-on environment globally, with high-beta stocks generally outperforming low-beta stocks. Companies tied to the buildout of AI-related infrastructure, including semiconductors, memory, power equipment, and other data center suppliers, were among the strongest performers, while more defensive and lower-volatility areas generally lagged.
Performance and Attribution Summary
For the second quarter of 2026, Aristotle Capital’s Global Equity Composite posted a total return of 9.07% gross of fees (8.94% net of fees), underperforming the MSCI ACWI Index, which returned 14.93%, and the MSCI World Index, which returned 13.76%. Please refer to the table below for detailed performance.
Performance (%)
2Q26
YTD
1 Year
3 Years
5 Years
10 Years
Since Inception*
Global Equity Composite (gross)
9.07
5.96
16.01
12.71
7.13
11.44
10.36
Global Equity Composite (net)
8.94
5.70
15.44
12.15
6.60
10.89
9.81
MSCI ACWI Index (net)
14.93
11.25
23.67
19.70
10.98
12.78
10.46
MSCI World Index (net)
13.76
9.69
21.34
19.24
11.47
13.14
11.15
*The inception date for the Global Equity Composite is November 1, 2010. Past performance is not indicative of future results. Aristotle Global Equity Composite returns are presented gross and net of model fees and include the reinvestment of all income. Gross returns will be reduced by fees and other expenses that may be incurred in the management of the account. Net returns are presented net of model fees. Net returns are calculated by subtracting a model fee of .50% on an annual basis or .04167% on a monthly basis, which includes trading costs and the reinvestment of all income. Please see important disclosures at the end of this document.
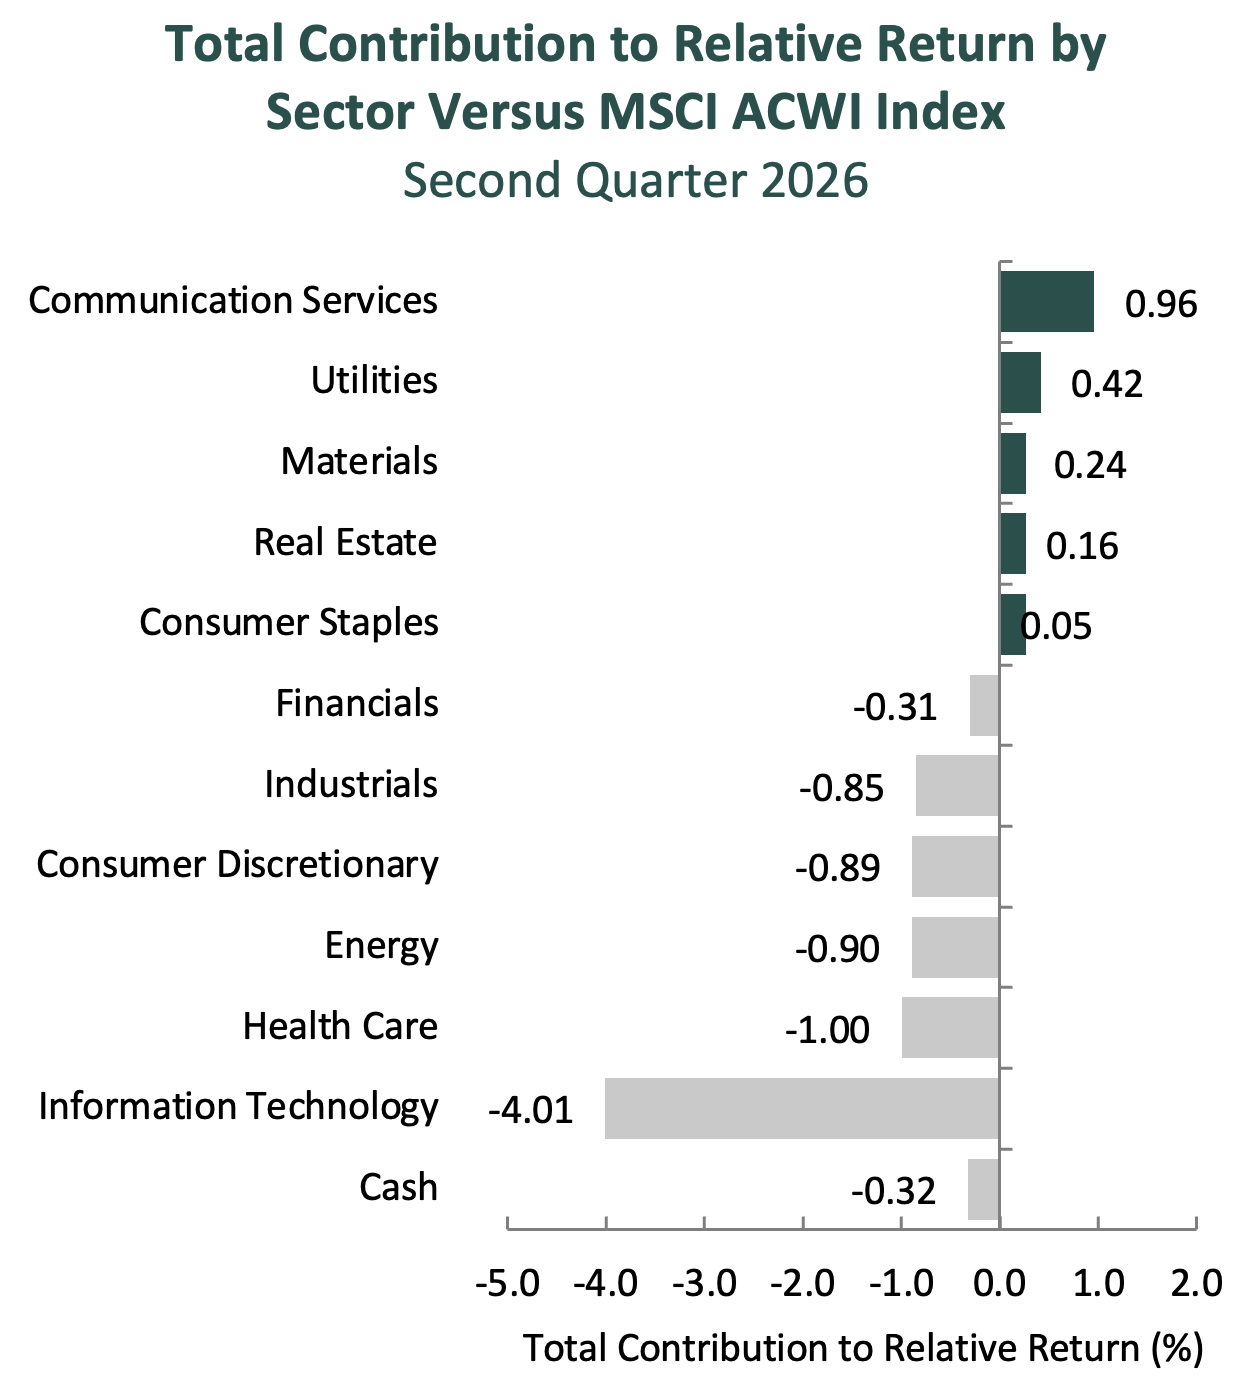
Source: FactSet Past performance is not indicative of future results. Sector attribution shows how much of a portfolio’s overall return is directly attributable to stock selection and asset allocation decisions within the portfolio, highlighting which sectors contributed or detracted to the total return. Attribution includes the reinvestment of income. Attribution is presented gross of fees and does not include the deduction of all fees and expenses that a client or investor has paid or would have paid. Please refer to the gross and net composite returns included within to understand the overall impact of fees.
From a sector perspective, the portfolio’s underperformance relative to the MSCI ACWI Index can be attributed to both security selection and allocation effects. Security selection and an underweight in Information Technology, as well as security selection in Consumer Discretionary, detracted the most from the portfolio’s relative performance. Conversely, security selection in Materials and Communication Services and a lack of exposure to Utilities contributed most to relative return.
Regionally, both security selection and allocation effects were responsible for the portfolio’s underperformance relative to the MSCI ACWI Index. Security selection in North America detracted the most from relative performance, while security selection in Asia/Pacific ex-Japan contributed the most.
Contributors and Detractors for 2Q 2026
Relative Contributors
Relative Detractors
Samsung Electronics
TotalEnergies
Microchip Technology
Munich Reinsurance
Qualcomm
Otsuka Holdings
Erste Group Bank
AIA Group
FANUC
Martin Marietta Materials
Relative contributors and detractors are based on attribution total effect and exclude benchmark securities not held in the portfolio.
Munich Re, the world’s largest reinsurance company, was a detractor during the quarter. Although the company reported strong operating results, supported by lower-than-expected catastrophe losses and disciplined underwriting, shares declined as investors focused on continued pricing pressure in portions of the global reinsurance market and weaker investment results driven by capital market volatility. We view these pressures as part of the normal insurance cycle rather than a change in the quality of the franchise. Munich Re provides balance sheet capacity and risk expertise to insurers around the world across property and casualty, life and health, cyber, and other complex risks—areas where scale, data, underwriting judgment, and long-standing client relationships are critical. The company’s diversified business mix, including its growing primary insurance operations through ERGO, can help reduce reliance on any single product line or geography, while its strong capital position provides flexibility to absorb catastrophe losses, support clients when capacity is most valuable, and return capital to shareholders. In addition, management continues to differentiate Munich Re through investments in technology, data, and R&D, which should improve underwriting, claims handling, and efficiency over time. We believe these advantages, together with opportunities for share gains in specialty lines such as cyber and in underpenetrated markets such as Asia, position the company to generate attractive returns across insurance cycles.
Martin Marietta, a leading supplier of construction aggregates and building materials, was a detractor during the quarter.Shares modestly declined as investors remained focused on the pace of recovery in residential and private nonresidential construction activity, despite continued strength in infrastructure, energy, and data center-related demand. While the stock underperformed during the period, it remains a strong performer over the past 12 months. We continue to believe Martin Marietta’s irreplaceable aggregates reserves, disciplined pricing strategy, and strategically located asset base position the company to benefit from long-term infrastructure investment and population growth while generating attractive FREE cash flow over time. In addition, the announced acquisition of Lhoist North America further broadens the company’s portfolio into attractive industrial markets and, if executed successfully, should enhance its long-term earnings power and cash flow generation.
Samsung Electronics, the South Korean technology conglomerate, was the largest contributor. Shares advanced as memory pricing continued to ramp sharply, driven by tight supply and accelerating demand from data centers and AI infrastructure. While Samsung is often viewed through the lens of smartphones and consumer electronics, the company’s earnings power is increasingly tied to memory, particularly DRAM, where Samsung remains one of the global leaders and where we have long identified memory and smartphones as the two core profit drivers. Importantly, the current strength in the share price seems to reflect more than simply higher spot pricing. Samsung is shifting its portfolio toward higher-value products such as HBM4, server DDR5 and enterprise SSDs, while longer-term supply agreements should provide better visibility through the cycle. After trailing peers in earlier generations of high-bandwidth memory, the company has improved its competitive position, supported by renewed investment focus, DRAM line conversion and HBM4 progress. Beyond memory, Samsung continues to benefit from its scale and manufacturing expertise across displays, image sensors, smartphones, consumer electronics, and custom semiconductor manufacturing. We remain mindful of memory cyclicality, Chinese competition, and the capital intensity required to remain at the leading edge. However, Samsung’s improving product mix, disciplined capacity allocation, and broader component opportunities should support higher normalized earnings and FREE cash flow over our investment horizon.
Qualcomm, a leading semiconductor and communications technology company, was among the largest contributors for the quarter. Shares recovered as management indicated that the inventory adjustments and production constraints resulting from higher memory costs were progressing largely as expected and that handset revenues from Chinese customers were expected to reach a bottom. As we noted last quarter, we believed these headwinds to be cyclical rather than structural and did not alter our long-term investment thesis. The company also continued to make progress on its long-term strategy of evolving from a handset-centric company into a broader provider of connected computing technologies. Automotive revenue reached another record high, while Internet of Things (IoT) and newer businesses such as AI-enabled PCs, industrial applications, and data center computing continue to represent a growing portion of the company and remain central to its long-term diversification strategy. We believe Qualcomm’s technologies will continue to benefit as connectivity expands across devices and AI workloads increasingly extend from the cloud to the edge, supporting Qualcomm’s ability to generate strong levels of FREE cash flow in the long run.
Recent Portfolio Activity
Buys
Sells
Techtronic Industries
Danaher
Wal-Mart de Mexico
Dolby Laboratories
Tokyo Century
During the quarter, we sold our positions in Danaher, Dolby Laboratories, and Tokyo Century and purchased Techtronic Industries and Wal-Mart de Mexico.
We first invested in Danaher, a company focused on biotechnology, life sciences and diagnostics, in the first quarter of 2016, attracted by its disciplined capital allocation, differentiated operating culture, and consistent FREE cash flow generation. The business is distinguished by a portfolio of market-leading franchises and a high mix of recurring consumables revenue tied to a large installed base. Its differentiated operating culture, anchored by the Danaher Business System (DBS), has historically enabled the company to be a highly effective acquirer, consistently integrating new businesses, expanding margins, and driving strong FREE cash flow generation. Over our decade-long holding period, Danaher successfully transformed itself from a diversified industrial company into a more focused healthcare business. This evolution included the spinoffs of Fortive, Envista, and Veralto, as well as the acquisition and integration of key assets such as Pall, Cepheid, and Cytiva. The company also increased the contribution from recurring revenue and workflow-based solutions embedded in customer operations, which contributed to the durability and predictability of the business.
More recently, as Danaher has shifted further into more complex, innovation-driven end markets, the application of DBS appears to be less differentiated than it was in Danaher’s traditional manufacturing-oriented businesses. Success in these new end markets is increasingly driven by scientific innovation, faster product cycles, and more specialized customer requirements. At the same time, increased scale and a more centralized organizational structure appear to be limiting flexibility at the business unit level, reducing the speed and effectiveness with which opportunities can be pursued. While we continue to view Danaher as a high-quality business, we believe much of our original investment thesis has now been realized, with fewer company-specific catalysts ahead. Accordingly, we elected to exit the position and redeploy the proceeds into what we view as more attractive opportunities.
We first invested in Dolby Laboratories, the creator and licensor of audio and imaging technologies, in the first quarter of 2022. We were attracted to Dolby’s asset-light licensing model, trusted brand, strong intellectual property portfolio, and deep relationships with both content creators and device makers. We believed Dolby would benefit from the growing demand for more immersive entertainment experiences, allowing the company to extend its technology into new use cases. During our ownership, Dolby executed well in several respects: increasing adoption across content and devices, expanding into newer end markets such as autos and gaming, adding to its patent portfolio, and maintaining the high-margin, cash-generative financial profile that first attracted us. However, adoption has not translated into the level of earnings growth we initially expected. As a result, while we continue to view Dolby as a high-quality franchise and will monitor its monetization efforts, we believe the remaining catalysts lack the visibility and timing we require, and exited the position.
We first invested in Tokyo Century, the Japan-based provider of leasing and specialty finance solutions, in the third quarter of 2024. The company benefits from a diversified platform across equipment leasing, specialty finance, automobility, and global financing, as well as its strategic relationships with partners such as NTT, Itochu, and CSI Leasing. We also saw attractive catalysts in aviation leasing through Aviation Capital Group, IT leasing through CSI Leasing, and data center-related investments. During our ownership, Tokyo Century continued to benefit from favorable aircraft leasing conditions, including tight aircraft supply, rising lease rates, and improved aircraft values, while its broader leasing franchise remained supported by scale, a strong balance sheet, and diversified revenue streams. However, as we reassessed the Global Equity portfolio, we concluded that a more direct investment in Itochu, which owns roughly 30% of Tokyo Century, together with a new investment in Techtronic, offered a more attractive use of capital. Given this overlap and the clearer catalysts we see in these opportunities, we elected to exit Tokyo Century and redeploy the proceeds.
Techtronic Industries Co. Ltd.
Headquartered in Hong Kong, Techtronic Industries (“TTI”) is a global manufacturer of power tools, outdoor power equipment and related accessories. The company operates primarily through two flagship brands: Milwaukee, which serves professional tradespeople, and Ryobi, which targets the DIY and light professional market (including handymen and maintenance professionals whose needs fall between homeowners and full-time trades). Over the past decade, TTI has transformed itself into one of the leading players in the global power tool industry, driven by sustained innovation and disciplined brand investment.
Milwaukee has been the primary growth engine, expanding from approximately $450 million in sales in the early 2000s to roughly $10 billion today. The brand has gained meaningful share in professional trades through a focus on productivity, safety, and battery-powered innovation. Ryobi remains a leading DIY platform, supported by a long-standing distribution relationship with Home Depot, TTI’s largest retail partner.
TTI continues to benefit from the long-term industry transition from corded, gas-powered, and pneumatic tools toward battery-powered platforms. The company’s strategy of maintaining backward compatibility across battery generations has reinforced customer loyalty and created a durable installed base across both Milwaukee and Ryobi ecosystems.
High-Quality Business
Some of the quality characteristics we have identified for TTI include:
Leading positions in professional and DIY power tools through the Milwaukee and Ryobi brands, supported by strong brand equity, deep engagement with professional tradespeople, and a track record of consistent product innovation;
A powerful battery ecosystem strategy, with over 110 million M18 and 65 million M12 batteries in circulation and backward and forward compatibility across generations, creating switching costs and repeat purchases across hundreds of compatible tools;
Ongoing investment in research and development, enabling consistent product innovation, market share gains, and expansion into adjacent product categories; and
Deep retail partnerships, particularly with Home Depot, reinforced by dedicated in-store sales representation and merchandising support
Attractive Valuation
We believe shares are attractively valued relative to our estimate of intrinsic value. Our analysis reflects the growing contribution of the Milwaukee franchise, which now represents the majority of operating profit, and the benefits of continued mix shift toward professional products, as well as stabilization of underperforming segments. In addition, as recent investment spending normalizes, we expect FREE cash flow to increase to levels that we believe are not fully reflected in the current share price.
Compelling Catalysts
Catalysts we have identified for TTI, which we believe will cause its stock price to appreciate over our three- to five-year investment horizon, include:
Continued mix shift toward the higher-margin Milwaukee brand, which has grown from 18% of total sales in 2010 to approximately two-thirds today;
Geographic expansion of the Milwaukee brand outside the United States, where market share remains below North American levels, and introduction of the Ryobi platform into additional markets such as Latin America and Australia;
Expansion into adjacent professional categories, including personal protective equipment and modular tool storage systems, thereby increasing wallet share within the professional customer base; and
Improvement in operating profitability through turnaround of underperforming segments and greater cost discipline.
Wal-Mart de Mexico SAB de CV
Founded in 1952 and headquartered in Mexico City, Wal-Mart de Mexico (“Walmex”) is the largest retailer in Mexico and Central America and a key subsidiary of Walmart Inc., which retains a majority ownership stake. Walmex operates more than 3,800 stores across multiple formats—Bodega Aurrerá (discount stores and the company’s fastest-growing format), Walmart Supercenter (big-box retail), Sam’s Club (membership warehouse), Walmart Express (small supermarkets), and other discount outlets—giving it a uniquely diversified presence across the consumer landscape.
This multi-format approach serves a wide spectrum of customers and shopping occasions—from everyday essentials and large family baskets to convenience and premium purchases. Bodega Aurrerá, for example, has become a household name across Mexico and now represents roughly half of the company’s stores, while Sam’s Club caters to membership customers seeking bulk purchases and higher-ticket items. Together, these formats provide Walmex broad market coverage, geographic reach, and strong brand loyalty across urban centers, suburban communities, and regional towns.
In recent years, the company has significantly expanded its omnichannel ecosystem, investing in e-commerce, logistics, and digital services to enhance convenience and deepen customer engagement. E-commerce is ~8% of total sales, supported by strong growth in online grocery and third-party marketplace offerings. Complementary platforms, such as Cashi (digital payments), BAIT (mobile telecom), and Walmart Connect (digital advertising), extend Walmex’s reach into financial and digital services, strengthening customer ties and building new revenue streams.
High-Quality Business
Some of the quality characteristics we have identified for Walmex include:
Dominant scale advantages with over 3,000 stores in Mexico, making it the clear market leader in food and general merchandise retail;
Diversified and resilient revenue base, with a meaningful percentage of sales from grocery—providing recurring traffic and stable cash flow—complemented by general merchandise, fuel, pharmacy, and membership-based services;
Strong returns on invested capital (~18%), supported by consistent execution and capital discipline; and
Support from Walmart Inc., which provides access to global best practices, digital tools, and procurement efficiencies.
Attractive Valuation
We believe Walmex is attractively valued relative to its long-term normalized earnings power. In our view, the market underappreciates the company’s ability to grow revenue through ongoing store expansion and strengthen margins and FREE cash flow generation through efficiency gains, scale benefits and continued growth in higher-margin channels, such as private label and e-commerce.
Compelling Catalysts
Catalysts we have identified for Walmex, which we believe will cause its stock price to appreciate over our three- to five-year investment horizon, include:
Expansion of private label penetration (from mid-teens to mid-20s), which should improve profitability and customer loyalty;
Further development of the e-commerce platform, with Walmex aiming to become a one-stop shop by combining online grocery and a third-party marketplace, supported by digital tools adapted from Walmart U.S.;
Disciplined store expansion, with current plans to add approximately 1,500 new stores across Mexico and Central America over the next five years, extending reach and scale advantages; and
Leadership continuity, as newly appointed interim CEO Cristian Barrientos, a veteran Walmart executive with more than 25 years of experience, provides operational stability and maintains focus on profitable growth during the leadership transition.
Conclusion
As we look ahead, the global backdrop remains complex. Geopolitical developments, central bank decisions, and changes in investor risk appetite can all influence returns over shorter periods, but these factors are difficult to forecast with consistency. Rather than position the portfolio around macro outcomes, we continue to focus on the businesses we own and the actions management teams are taking to increase value over time.
Our investment process centers on the three pillars of Quality, Valuation, and Catalysts. We seek companies with strong competitive positions, capable management teams, financial resilience, and identifiable opportunities to improve profitability and FREE cash flow. While markets can move quickly from one theme to the next, we believe owning high-quality businesses at attractive valuations remains the best way to create value for clients over the long term.
Disclosures
The opinions expressed herein are those of Aristotle Capital Management, LLC (Aristotle Capital) and are subject to change without notice. Past performance is not a guarantee or indicator of future results. This material is not financial advice or an offer to buy or sell any product. You should not assume that any of the securities transactions, sectors or holdings discussed in this report were or will be profitable, or that recommendations Aristotle Capital makes in the future will be profitable or equal the performance of the securities listed in this report. The portfolio characteristics shown relate to the Aristotle Global Equity strategy. Not every client’s account will have these characteristics. Aristotle Capital reserves the right to modify its current investment strategies and techniques based on changing market dynamics or client needs. There is no assurance that any securities discussed herein will remain in an account’s portfolio at the time you receive this report or that securities sold have not been repurchased. The securities discussed may not represent an account’s entire portfolio and, in the aggregate, may represent only a small percentage of an account’s portfolio holdings. The performance attribution presented is of a representative account from Aristotle Capital’s Global Equity Composite. The representative account is a discretionary client account which was chosen to most closely reflect the investment style of the strategy. The criteria used for representative account selection is based on the account’s period of time under management and its similarity of holdings in relation to the strategy. Recommendations made in the last 12 months are available upon request.
Returns are presented gross and net of model fees and include the reinvestment of all income. Gross returns will be reduced by fees and other expenses that may be incurred in the management of the account. Net returns are presented net of model fees. Net returns are calculated by subtracting a model fee of .50% on an annual basis or .04167% on a monthly basis, which includes trading costs and the reinvestment of all income.
All investments carry a certain degree of risk, including the possible loss of principal. Investments are also subject to political, market, currency and regulatory risks or economic developments. International investments involve special risks that may in particular cause a loss in principal, including currency fluctuation, lower liquidity, different accounting methods and economic and political systems, and higher transaction costs. These risks typically are greater in emerging markets. While Large-capitalization companies may have more stable prices than smaller, less established companies, they are still subject to equity securities risk. In addition, large-capitalization equity security prices may not rise as much as prices of equity securities of small-capitalization companies. Securities of small- and medium-sized companies tend to have a shorter history of operations and be more volatile and less liquid. Value stocks can perform differently from the market as a whole and other types of stocks. The material is provided for informational and/or educational purposes only and is not intended to be and should not be construed as investment, legal or tax advice and/or a legal opinion. Investors should consult their financial and tax adviser before making investments. The opinions referenced are as of the date of publication, may be modified due to changes in the market or economic conditions, and may not necessarily come to pass. Information and data presented has been developed internally and/or obtained from sources believed to be reliable. Aristotle Capital does not guarantee the accuracy, adequacy or completeness of such information.
Aristotle Capital Management, LLC is an independent investment adviser registered under the Investment Advisers Act of 1940, as amended. Registration does not imply a certain level of skill or training. More information about Aristotle Capital, including our investment strategies, fees and objectives, can be found in our Form ADV Part 2, which is available upon request. ACM-2607-51
Performance Disclosures
Sources: CAPS CompositeHubTM, MSCI
MSCI ACWI (Net) was stated as the primary benchmark on June 1, 2024 and MSCI World (Net) became the secondary benchmark. The Aristotle Global Equity Composite has an inception date of November 1, 2010; however, the strategy initially began at Howard Gleicher’s predecessor firm in July 2007. A supplemental performance track record from January 1, 2008 through October 31, 2010 is provided on this page. The performance results were achieved while Mr. Gleicher managed the strategy at a prior firm. The returns are those of a publicly available mutual fund from the fund’s inception through Mr. Gleicher’s departure from the firm. During that time, Mr. Gleicher had primary responsibility for managing the fund.
Past performance is not indicative of future results. The information provided should not be considered financial advice or a recommendation to purchase or sell any particular security or product. Performance results for periods greater than one year have been annualized. Composite and supplemental returns are presented gross and net of model fees and include the reinvestment of all income. Gross returns will be reduced by fees and other expenses that may be incurred in the management of the account. Net returns are presented net of model fees. Net returns are calculated by subtracting a model fee of .50% on an annual basis or .04167% on a monthly basis, which includes trading costs and the reinvestment of all income.
Index Disclosures
The MSCI ACWI Index captures large and mid cap representation across Developed Markets (DM) and Emerging Markets (EM) countries. The index covers approximately 85% of the global investable equity opportunity set. The MSCI ACWI Equal Weighted Index represents an alternative weighting scheme to its market capitalization-weighted parent index, the MSCI ACWI. The Index includes the same constituents as its parent (large and mid-cap securities from 23 developed markets and 24 emerging markets countries). However, at each quarterly rebalance date, all index constituents are weighted equally, effectively removing the influence of each constituent’s current price (high or low). The MSCI World Index (Net) is a free float-adjusted market capitalization-weighted index that is designed to measure the equity market performance of developed markets. The MSCI World Index includes the following 23 developed market countries: Australia, Austria, Belgium, Canada, Denmark, Finland, France, Germany, Hong Kong, Ireland, Israel, Italy, Japan, Netherlands, New Zealand, Norway, Portugal, Singapore, Spain, Sweden, Switzerland, the United Kingdom and the United States. The index returns are net of withholding taxes. The MSCI ACWI Index (Net) was stated as the primary benchmark on June 1, 2024 and the MSCI World Index (Net) became the secondary benchmark. The MSCI Emerging Markets Index is a free float-adjusted market capitalization-weighted index that is designed to measure equity market performance of emerging markets. The MSCI Emerging Markets Index consists of the following 24 emerging market country indexes: Brazil, Chile, China, Colombia, Czech Republic, Egypt, Greece, Hungary, India, Indonesia, Korea, Kuwait, Malaysia, Mexico, Peru, Philippines, Poland, Qatar, Saudi Arabia, South Africa, Taiwan, Thailand, Turkey and United Arab Emirates. The MSCI ACWI Growth Index captures large and mid-cap securities exhibiting overall growth style characteristics across 23 developed markets countries and 24 emerging markets countries. The MSCI ACWI Value Index captures large and mid-cap securities exhibiting overall value style characteristics across 23 developed markets countries and 24 emerging markets countries. The MSCI Europe Index captures large and mid-cap representation across 15 developed markets countries in Europe. With approximately 400 constituents, the Index covers approximately 85% of the free float-adjusted market capitalization across the European developed markets equity universe. The MSCI Japan Index is designed to measure the performance of the large and mid-cap segments of the Japanese market. With approximately 200 constituents, the Index covers approximately 85% of the free float-adjusted market capitalization in Japan. The S&P 500® Index is the Standard & Poor’s Composite Index of 500 stocks and is a widely recognized, unmanaged index of common stock prices. The S&P 500® Equal Weight Index is designed to be the size-neutral version of the S&P 500. It includes the same constituents as the market capitalization-weighted S&P 500, but each company in the S&P 500 Equal Weight Index is allocated the same weight at each quarterly rebalance. The Bloomberg Global Aggregate Bond Index is a flagship measure of global investment grade debt from 27 local currency markets. This multi-currency benchmark includes Treasury, government-related, corporate and securitized fixed rate bonds from both developed and emerging markets issuers. The Brent Crude Oil Index is a major trading classification of sweet light crude oil that serves as a major benchmark price for purchases of oil worldwide. The volatility (beta) of the Composite may be greater or less than the benchmarks. It is not possible to invest directly in these indexes.
The U.S. equity market rebounded during the second quarter and reached new all-time highs, with the S&P 500 Index rising 15.20% during the period. Surging demand for artificial intelligence (AI) processing power and expansive capital expenditure plans continued to support AI-related businesses, which drove a substantial portion of benchmark returns and contributed meaningfully to earnings growth. Fixed income markets also advanced, as the Bloomberg U.S. Aggregate Bond Index increased 0.67%.
Sources: CAPS CompositeHubTM, Bloomberg Past performance is not indicative of future results. Aristotle Atlantic Focus Growth Composite returns are presented gross and net of investment advisory fees and include the reinvestment of all income. Gross returns will be reduced by fees and other expenses that may be incurred in the management of the account. Net returns are presented net of actual investment advisory fees and after the deduction of all trading expenses. Please see important disclosures at the end of this document.
On a sector basis, ten of the eleven sectors within the Russell 1000 Growth Index posted gains in the second quarter of 2026. The strongest-performing sectors were Information Technology and Industrials. The weakest sectors were Energy and Consumer Staples.
Market leadership remained narrow and increasingly tied to the AI infrastructure buildout. Significant investment in semiconductors, memory and data center infrastructure continued to benefit a concentrated group of companies. While these themes supported benchmark returns, they also contributed to significant dispersion beneath the surface, as many resilient, cash-generative businesses outside the AI infrastructure ecosystem did not participate to the same degree.
Geopolitics remained a key source of market uncertainty during the quarter. Peace negotiations between the U.S. and Iran proved volatile, with the reopening of the Strait of Hormuz, nuclear commitments, asset sanctions and regional economic development as primary points of discussion. An interim understanding between the two countries helped establish a ceasefire framework and restore maritime shipping in the region. However, tensions remained elevated, as both sides accused the other of violations, contributing to renewed U.S. strikes on Iran.
Against this backdrop, oil prices were volatile and continued to put upward pressure on inflation. The Consumer Price Index rose 4.2% for the 12 months ended May, compared with 3.8% for the 12 months ended April. Despite elevated inflation, real GDP growth accelerated, the unemployment rate remained stable at 4.3%, and consumer confidence improved in June from May’s record low. Given these conditions, the Federal Reserve maintained the target range for the federal funds rate as the Committee continued to balance its dual mandate of maximum employment and price stability.
Performance and Attribution Summary
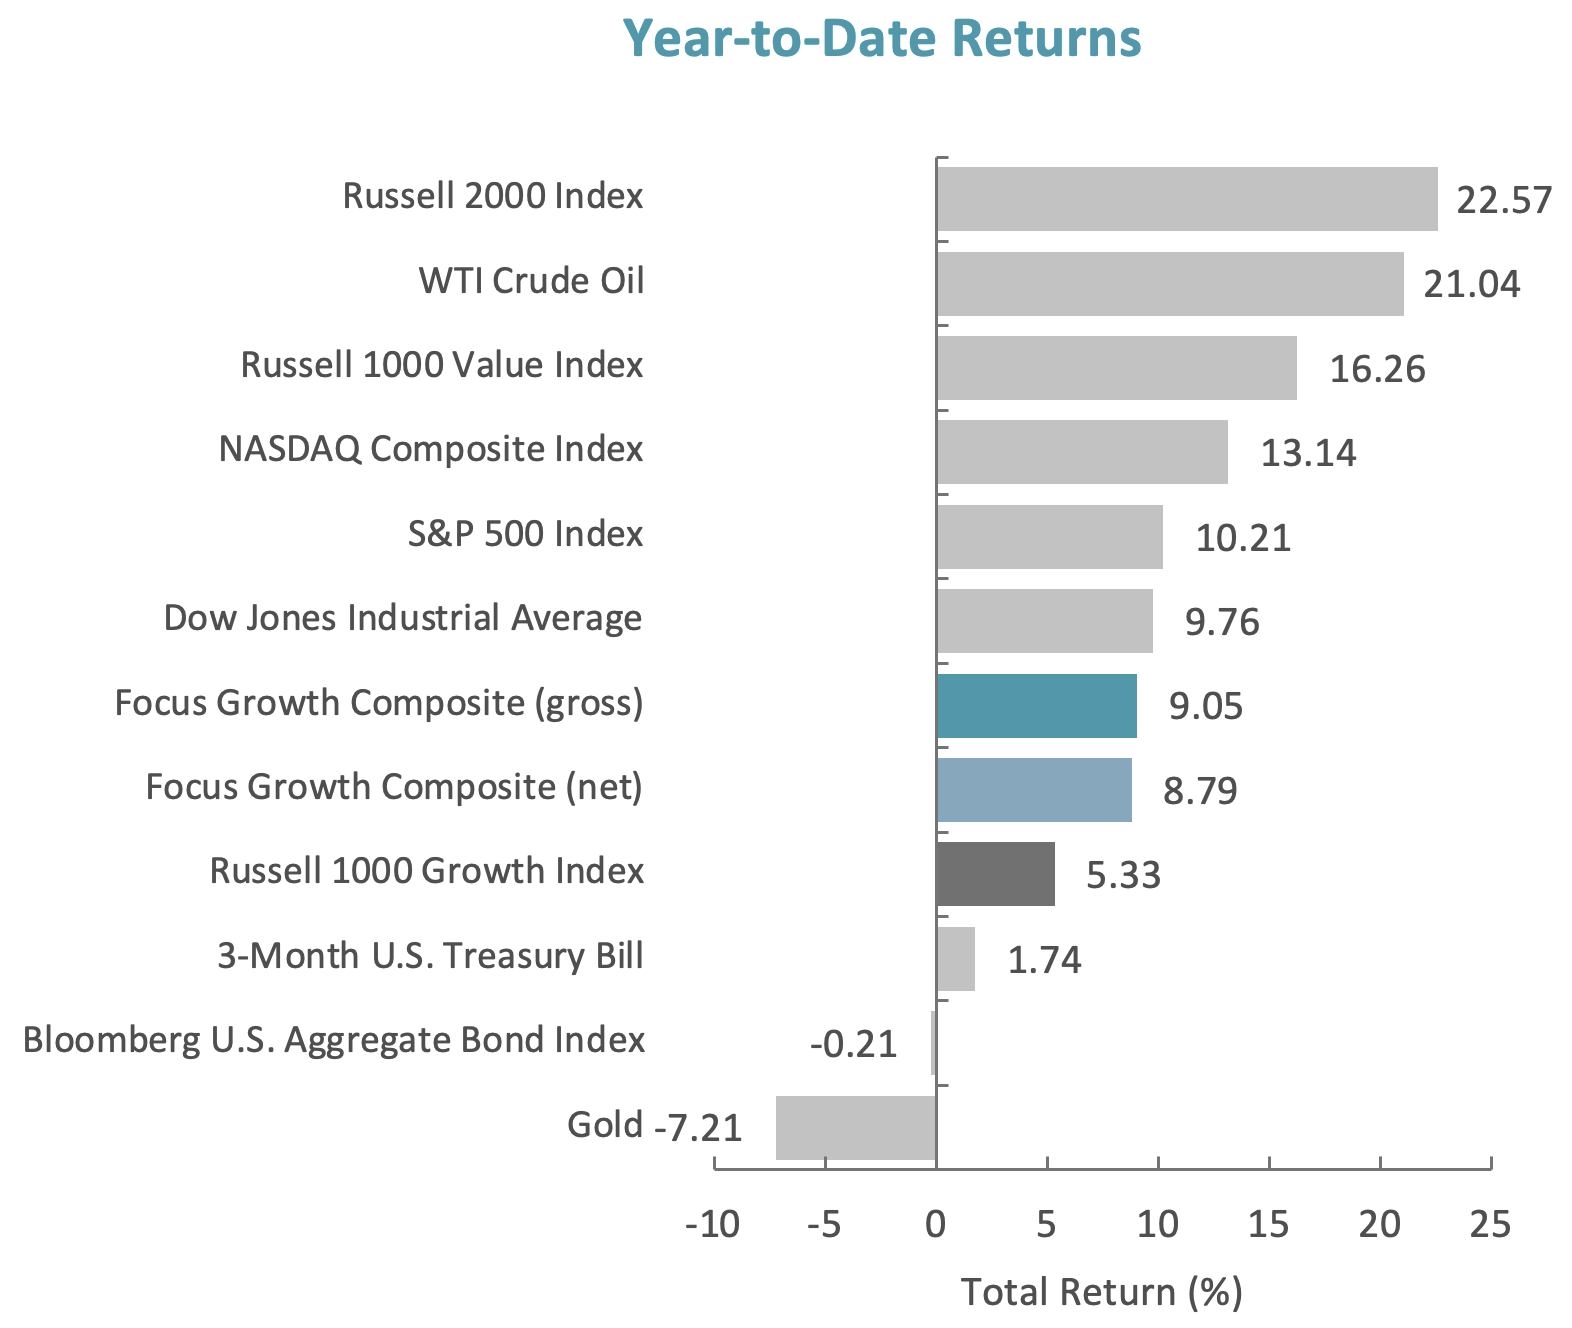
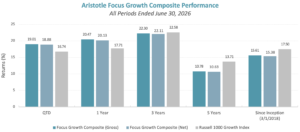
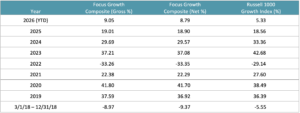
For the second quarter of 2026, Aristotle Atlantic’s Focus Growth Composite posted a total return of 19.01% gross of fees (18.88% net of fees), outperforming the 16.74% total return of the Russell 1000 Growth Index.
Performance (%)
QTD
YTD
1 Year
3 Years
5 Years
Since Inception*
Focus Growth Composite (gross)
19.01
9.05
20.47
22.30
10.78
15.61
Focus Growth Composite (net)
18.88
8.79
20.13
22.11
10.63
15.38
Russell 1000 Growth Index
16.74
5.33
17.71
22.58
13.71
17.50
*The Focus Growth Composite has an inception date of March 1, 2018. Past performance is not indicative of future results. Aristotle Atlantic Focus Growth Composite returns are presented gross and net of investment advisory fees and include the reinvestment of all income. Gross returns will be reduced by fees and other expenses that may be incurred in the management of the account. Net returns are presented net of actual investment advisory fees and after the deduction of all trading expenses. Please see important disclosures at the end of this document.
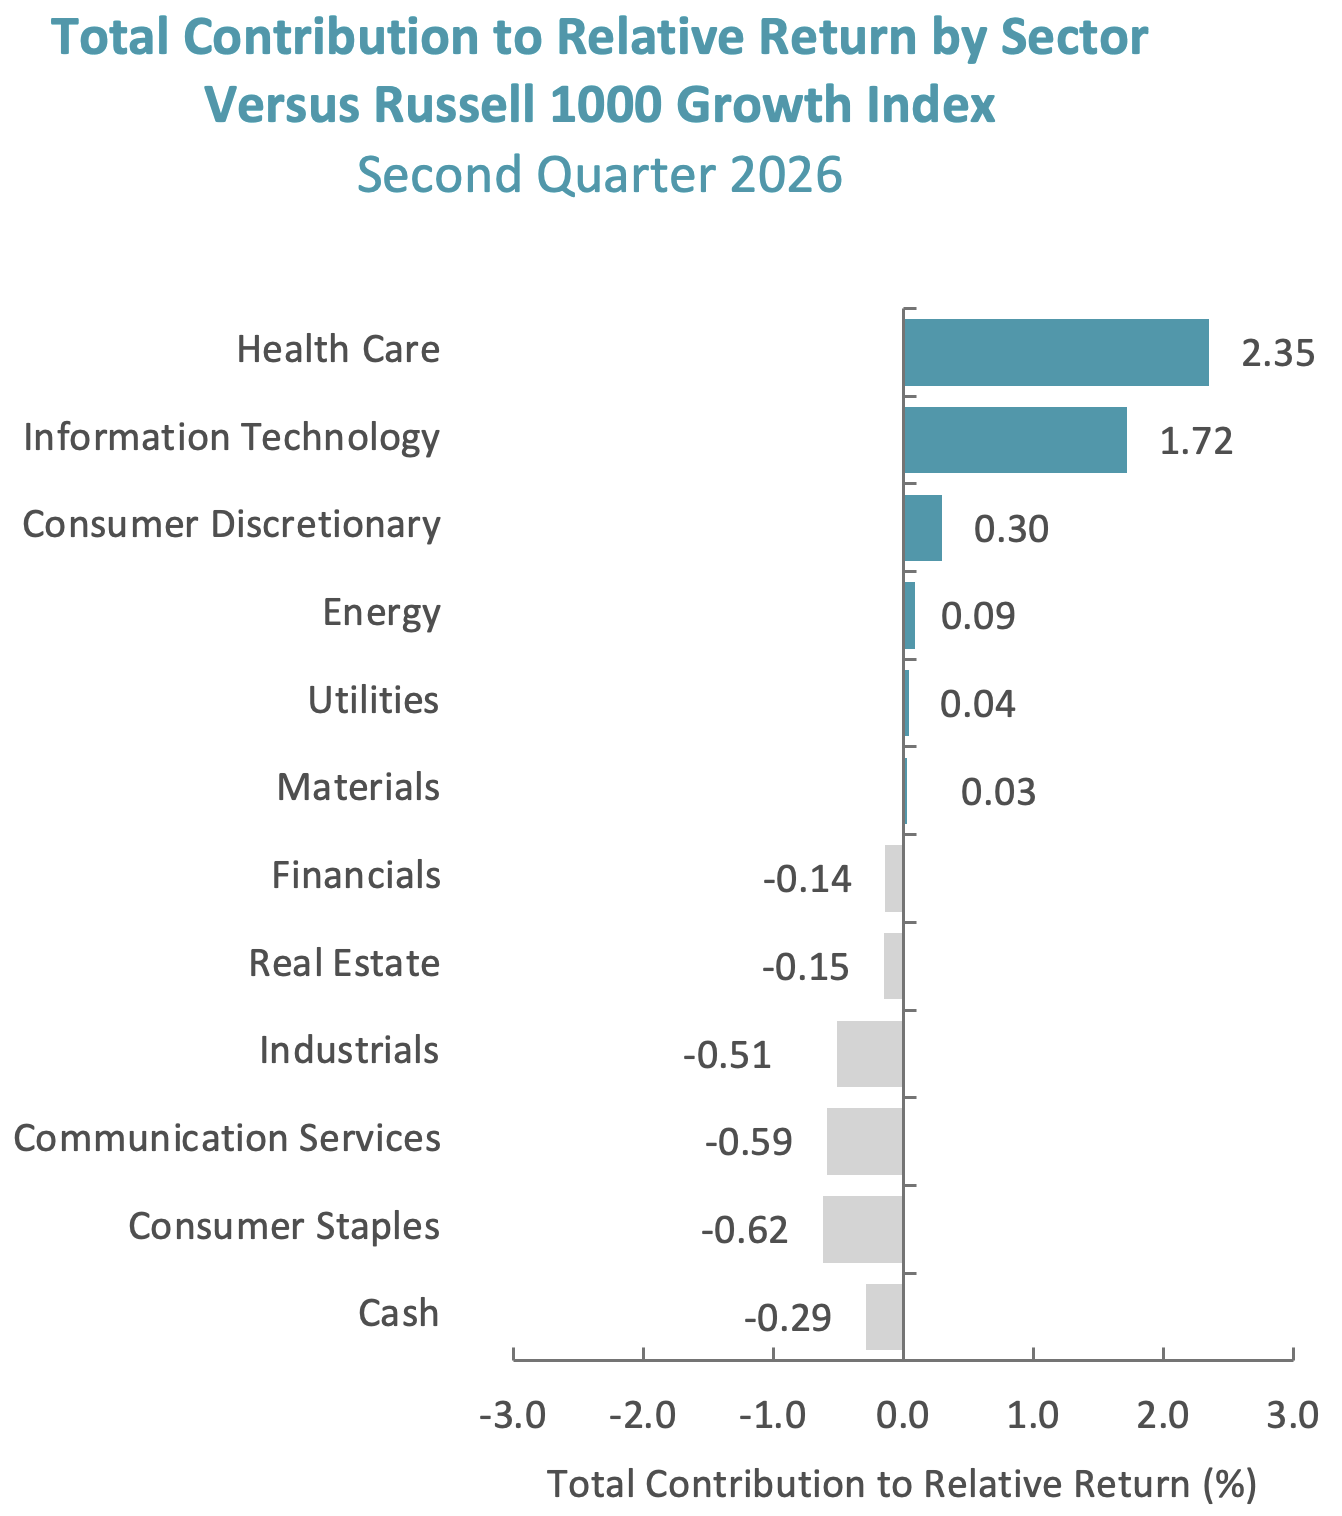
Source: FactSet Past performance is not indicative of future results. Sector attribution shows how much of a portfolio’s overall return is directly attributable to stock selection and asset allocation decisions within the portfolio, highlighting which sectors contributed or detracted to the total return. Attribution includes the reinvestment of income. Attribution is presented gross of fees and does not include the deduction of all fees and expenses that a client or investor has paid or would have paid. Please refer to the gross and net composite returns included within to understand the overall impact of fees. Please see important disclosures at the end of this document.
During the second quarter, the portfolio’s outperformance relative to the Russell 1000 Growth Index was due to security selection, while allocation effects detracted. Security selection in Health Care and Information Technology contributed the most to relative returns. Conversely, security selection in Communication Services and Consumer Staples detracted the most.
Contributors and Detractors for 2Q 2026
Relative Contributors
Relative Detractors
KLA Corporation
Netflix
Guardant Health
Darling Ingredients
CrowdStrike Holdings
S&P Global
Adaptive Biotechnologies
Oracle
Snowflake
Prologis
Relative contributors and detractors are based on attribution total effect and exclude benchmark securities not held in the portfolio.
Contributors
KLA Corporation
KLA Corporation contributed to performance in the second quarter, benefiting from the AI-driven WFE upcycle and reinforcing its position as the leading process control beneficiary of rising semiconductor manufacturing complexity. The company’s quarterly results highlighted the broad-based strength across process control, specialty process tools and advanced packaging tied to AI logic and high-bandwidth memory (HBM). Management raised its long-term outlook, underpinned by process control market share that has expanded to approximately 58%, over 4x its nearest competitor, as rising chip complexity (GAA, advanced nodes, HBM stacking) continues to lift process control intensity as a share of fab spend. This positioning was further validated in June, as Samsung and SK Hynix’s $515-$518 billion capacity expansion plan to double South Korean DRAM output drove strength in KLA’s shares, reinforcing the read-through from accelerating WFE spend (~$145B in 2026 toward ~$250B by 2028) directly into the company’s process control business.
Guardant Health
Guardant Health contributed to performance in the second quarter following a string of positive developments, as several catalysts played out during the quarter. These developments include FDA approval of an updated version of the Guardant360 liquid biopsy test, American Cancer Society inclusion of the company’s Shield test for colorectal cancer screening, and a report of stronger-than-expected first quarter earnings driven by volume growth and coverage expansion.
Detractors
Netflix
Netflix shares detracted from performance in the second quarter following a series of failed large-scale M&A bids that raised concerns about the company’s organic growth trajectory. The pursuit of both Warner Bros. Discovery and Roku signaled that management may be increasingly reliant on inorganic levers to sustain engagement and revenue growth, weighing on the P/E multiple. Headwinds were compounded by lower subscriber engagement due to a weaker content slate and disappointment that management did not raise full-year 2026 guidance during its first quarter 2026 earnings call in April.
Darling Ingredients
Darling Ingredients detracted from performance in the second quarter as the market digested outsized gains in Darling’s stock during the first quarter of 2026. In the second quarter, Darling announced better-than-expected earnings and raised full-year guidance. Several commodity-based indicators tied to Darling’s earnings drivers, including fat prices, renewable diesel margins and renewable identification numbers (RINs), remained supportive of the company’s earnings outlook for the remainder of 2026 and into 2027.
Recent Portfolio Activity
The table below shows all buys and sells completed during the quarter, followed by a brief rationale.
Buys
Sells
Amphenol
HubSpot
Coherent
Sandisk
Western Digital
Buys
Amphenol
Amphenol is one of the world’s largest designers, manufacturers and marketers of electrical, electronic and fiber optic connectors and interconnect systems; antennas; sensors and sensor-based products; and coaxial, high-speed and specialty cable. Based on recent reports of industry analysts, the company estimates that worldwide sales of interconnect and sensor-related products were approximately $250 billion in 2024, reflecting continued growth driven by data communications, electrification, and aerospace and defense demand. The company aligns its businesses into three reportable business segments: (i) Harsh Environment Solutions, (ii) Communications Solutions and (iii) Interconnect and Sensor Systems. The company sells products to customers in a diversified set of end markets.
Our view on Amphenol centers on its diversified exposure across automotive, aerospace, defense, information technology datacom, mobile networks, industrial and other end markets, which provides resilience while positioning the company to benefit from multiple long-term growth themes. The company is a consolidator in a fragmented interconnect market, supported by a global manufacturing footprint, disciplined acquisition strategy and a track record of integrating deals that expand capabilities in fiber optics, defense interconnects, cable solutions, active optics and building connectivity. Its decentralized operating model, cost discipline, strong incremental margins, high returns on invested capital and equity, and robust free cash flow can support profitability and earnings growth. We believe demand from AI data centers and cloud infrastructure is a major growth driver, with Amphenol now spanning the full data center signal path across copper, power, fiber and optics, while broader electrification, factory automation, Industrial Internet of Things adoption, defense modernization and aerospace electronics provide additional multi-year demand tailwinds. Together, these factors can create a resilient, high-quality growth profile supported by disciplined capital allocation and continued opportunities for organic and acquisition-driven expansion. Amphenol trades above its recent historical valuation range after re-rating on the strength of its AI and data center business, as well as strong execution. We view the premium as justified given the company’s long record of trading at a meaningfully higher earnings multiple than the broader market. The main drivers of future valuation will likely be the durability of AI and data center growth, the pace of recovery in industrial demand, and continued value creation from acquisitions.
Coherent
Coherent is a vertically integrated manufacturing company that develops, manufactures and markets lasers, transceivers, and other optical and optoelectronic devices, modules, and systems, as well as engineered materials, for use in the communications, industrial, instrumentation and electronics markets. The company has broad technical expertise and a deep technology stack in areas of importance to its products. This includes materials growth and fabrication of specialty materials, semiconductor lasers and passive optics, including isolators, transceivers, transport equipment, higher-powered lasers for semiconductor capital equipment, display manufacturing, precision manufacturing and scientific research. Many of Coherent’s products include custom integrated software that it develops internally, leveraging the company’s deep domain expertise.
We believe Coherent offers a compelling long-term investment thesis as AI data centers shift from electrical copper connections to optical networking, creating a structural multi-year growth opportunity across scale-out, scale-up and data center interconnect applications. The company benefits from vertical integration across key photonic components, expanding indium phosphide manufacturing capacity, a geographically diversified and U.S.-centered supply chain, and a strategic partnership with NVIDIA that validates its position in co-packaged optics for next-generation data center architectures. In addition, Coherent has a large and expanding addressable market, a high-margin industrial business with recurring service and replacement revenue, and a portfolio streamlining program that reallocates investment toward higher-growth opportunities while using divestiture proceeds to reduce debt and support earnings growth.
Sandisk
We initiated Sandisk as a complementary picks-and-shovels investment opportunity tied to the AI memory bottleneck, with hard disk drives and flash memory now capacity-constrained inputs for AI data center expansion. These components are shifting away from commoditized consumer technology inputs, and we believe Sandisk can benefit from stronger pricing power, multi-year customer agreements, higher earnings and potential valuation multiple expansion.
Sandisk is a global developer and manufacturer of flash memory storage solutions headquartered in Milpitas, California, following its spinoff from Western Digital in February 2025. The company serves enterprise data centers, personal computers, smartphones and consumer devices through products including enterprise solid-state drives, client solid-state drives, embedded mobile storage, and branded removable and retail storage. Sandisk manufactures through its Flash Ventures joint venture with Kioxia, giving it access to advanced three-dimensional flash memory production at low-cost, capital-efficient economics, while retaining vertical integration in controller and firmware intellectual property, supported by a large patent portfolio. The company is increasingly focused on higher-value storage demand tied to AI data center growth.
We see Sandisk offering leveraged exposure to the AI-driven memory bottleneck, as flash memory and enterprise solid-state drives shift from commoditized components to strategically constrained inputs for data center growth. The investment case rests on stronger and more visible demand from hyperscale customers, improved industry supply discipline, multi-year customer agreements that provide floor-protected revenue, and a cleaner standalone structure following the separation from Western Digital. The company also benefits from its long-standing Flash Ventures partnership with Kioxia, which provides a cost and capital advantage, while new data center platform qualifications, high-bandwidth flash optionality and geopolitical support for trusted supply chains can create additional paths for earnings growth and valuation multiple expansion.
We believe Sandisk trades at a valuation that appears reasonable given improving earnings expectations, stronger AI memory demand and rising pricing power. We believe disciplined supply, contracted demand and a debt-free, cash-returning balance sheet should reduce earnings volatility and support a higher valuation over time.
Western Digital
We initiated Western Digital because we view the company as providing picks-and-shovels exposure to the AI memory bottleneck, with hard disk drives and NAND flash memory now serving as capacity-constrained inputs to AI data center buildout. These components are no longer commoditized inputs in consumer technology goods, and we see both Western Digital and Sandisk benefiting from stronger pricing power and multi-year customer agreements, resulting in upward earnings inflection and multiple expansion.
Western Digital is a pure-play developer and manufacturer of hard disk drives and data storage solutions focused on high-capacity storage for cloud and AI infrastructure. Following the February 2025 separation of its flash memory business into the independent company Sandisk, Western Digital has become one of the leading suppliers of nearline hard disk drives used by hyperscale cloud service providers to store large volumes of data economically. The company is vertically integrated across key components such as recording heads and magnetic media, operates a global manufacturing and testing footprint, and supports its product roadmap with advanced recording technologies and a large patent portfolio. With only three remaining global hard disk drive manufacturers and two scaled industry participants, Western Digital operates in a consolidated and supply-disciplined market that benefits from growing demand for AI data storage.
We believe Western Digital represents a compelling investment opportunity as hard disk drive demand shifts from a personal computer-driven cycle to a durable AI and cloud infrastructure growth story. The company benefits from a structurally improved industry with limited competition, disciplined capacity, multi-year customer agreements and rising pricing power as hyperscale customers prioritize secure storage supply for rapidly expanding data needs. This stronger market backdrop can translate into higher margins, improved earnings visibility, significant free cash flow generation and increased shareholder returns through dividends and share repurchases. With limited capital investment requirements, a cleaner balance sheet and sustained demand for economical mass storage, we believe Western Digital is positioned to compound earnings and cash flow over multiple years.
Western Digital Corporation has earned a higher valuation because its business profile has shifted from a cyclical hardware supplier to a more disciplined, cash-generative infrastructure company with stronger demand visibility. Continued growth in data storage needs, improved pricing power, durable margins, modest reinvestment requirements and meaningful shareholder returns support further earnings and cash flow compounding over time.
Sells
HubSpot
We sold HubSpot because its core value proposition—an easy-to-use, all-in-one go-to-market platform—is becoming increasingly replicable by AI-native agents that can autonomously manage prospecting, lead nurturing and pipeline workflows without the need for a dedicated SaaS layer. HubSpot’s SMB-heavy customer base is especially price-sensitive and more exposed to churn as lower-cost AI-native alternatives emerge, creating risk to both net revenue retention and new logo growth. With the stock still valued for durable double-digit growth, we view the risk/reward as skewed to the downside.
Outlook
The equity markets in the second quarter increased mid-teens on the strength in technology and related companies tied into the AI infrastructure spend. Interest rates rose slightly for the quarter, as inflation continues to run above the Federal Reserve’s target level. There was a sizable decline in energy-related equities on the pullback in energy commodity prices. We view equity valuations on forward earnings expectations as reasonable, as the growth in earnings has continued to surprise to the upside. The economic data points to a moderately growing economy with lingering inflation, putting the Federal Reserve on hold with a bias toward a rate increase in the latter half of the year. The conflicts in Iran and Ukraine will continue to drive uncertainty, especially in the energy commodity space. Our focus will likely continue to be at the company level, with an emphasis on seeking to invest in companies with secular tailwinds or strong product-driven cycles.
Disclosures
The opinions expressed herein are those of Aristotle Atlantic Partners, LLC (Aristotle Atlantic) and are subject to change without notice. Past performance is not a guarantee or indicator of future results. This material is not financial advice or an offer to purchase or sell any product. You should not assume that any of the securities transactions, sectors or holdings discussed in this report were or will be profitable, or that recommendations Aristotle Atlantic makes in the future will be profitable or equal the performance of the listed in this report. The portfolio characteristics shown relate to the Aristotle Atlantic Focus Growth strategy. Not every client’s account will have these characteristics. Aristotle Atlantic reserves the right to modify its current investment strategies and techniques based on changing market dynamics or client needs. There is no assurance that any securities discussed herein will remain in an account’s portfolio at the time you receive this report or that securities sold have not been repurchased. The securities discussed may not represent an account’s entire portfolio and, in the aggregate, may represent only a small percentage of an account’s portfolio holdings. The performance attribution presented is of a representative account from Aristotle Atlantic’s Focus Growth Composite. The representative account is a discretionary client account which was chosen to most closely reflect the investment style of the strategy. The criteria used for representative account selection is based on the account’s period of time under management and its similarity of holdings in relation to the strategy. Recommendations made in the last 12 months are available upon request. Returns are presented gross and net of investment advisory fees and include the reinvestment of all income. Gross returns will be reduced by fees and other expenses that may be incurred in the management of the account. Net returns are presented net of actual investment advisory fees and after the deduction of all trading expenses.
All investments carry a certain degree of risk, including the possible loss of principal. Investments are also subject to political, market, currency and regulatory risks or economic developments. International investments involve special risks that may in particular cause a loss in principal, including currency fluctuation, lower liquidity, different accounting methods and economic and political systems, and higher transaction costs. These risks typically are greater in emerging markets. While Large-capitalization companies may have more stable prices than smaller, less established companies, they are still subject to equity securities risk. In addition, large-capitalization equity security prices may not rise as much as prices of equity securities of small-capitalization companies. Securities of small- and medium-sized companies tend to have a shorter history of operations, be more volatile and less liquid. Value stocks can perform differently from the market as a whole and other types of stocks. The material is provided for informational and/or educational purposes only and is not intended to be and should not be construed as investment, legal or tax advice and/or a legal opinion. Investors should consult their financial and tax adviser before making investments. The opinions referenced are as of the date of publication, may be modified due to changes in the market or economic conditions, and may not necessarily come to pass. Information and data presented has been developed internally and/or obtained from sources believed to be reliable. Aristotle Atlantic does not guarantee the accuracy, adequacy or completeness of such information.
Aristotle Atlantic Partners, LLC is an independent registered investment adviser under the Advisers Act of 1940, as amended. Registration does not imply a certain level of skill or training. More information about Aristotle Atlantic, including our investment strategies, fees and objectives, can be found in our Form ADV Part 2, which is available upon request. AAP-2607-10
Performance Disclosures
Sources: CAPS CompositeHubTM
Past performance is not indicative of future results. Performance results for periods greater than one year have been annualized. Returns are presented gross and net of investment advisory fees and include the reinvestment of all income. Gross returns will be reduced by fees and other expenses that may be incurred in the management of the account. Net returns are presented net of actual investment advisory fees and after the deduction of all trading expenses.
Index Disclosures
The Russell 1000® Growth Index measures the performance of the large cap growth segment of the U.S. equity universe. It includes those Russell 1000 companies with higher price-to-book ratios and higher forecasted growth values. This index has been selected as the benchmark and is used for comparison purposes only. The Russell 1000® Value Index measures the performance of the large cap value segment of the U.S. equity universe. It includes those Russell 1000 companies with lower price-to-book ratios and lower expected growth values. The S&P 500® Index is the Standard & Poor’s Composite Index of 500 stocks and is a widely recognized, unmanaged index of common stock prices. The Russell 2000® Index measures the performance of the small cap segment of the U.S. equity universe. The Russell 2000 Index is a subset of the Russell 3000® Index representing approximately 10% of the total market capitalization of that index. It includes approximately 2,000 of the smallest securities based on a combination of their market cap and current index membership. The Dow Jones Industrial Average® is a price-weighted measure of 30 U.S. blue-chip companies. The Index covers all industries except transportation and utilities. The NASDAQ Composite Index measures all NASDAQ domestic and international based common type stocks listed on The NASDAQ Stock Market. The NASDAQ Composite includes over 3,000 companies, more than most other stock market indices. The Bloomberg U.S. Aggregate Bond Index is an unmanaged index of domestic investment grade bonds, including corporate, government and mortgage-backed securities. The WTI Crude Oil Index is a major trading classification of sweet light crude oil that serves as a major benchmark price for oil consumed in the United States. The 3-Month U.S. Treasury Bill is a short-term debt obligation backed by the U.S. Treasury Department with a maturity of three months. The Consumer Price Index (CPI) is a measure of the average change over time in the prices paid by urban consumers for a market basket of consumer goods and services. While stock selection is not governed by quantitative rules, a stock typically is added only if the company has an excellent reputation, demonstrates sustained growth and is of interest to a large number of investors. The volatility (beta) of the Composite may be greater or less than its respective benchmarks. It is not possible to invest directly in these indices.
Five years ago, one of our portfolio managers (PMs) made an inaugural trip to Iceland. The PM was fascinated by the lundi, Icelandic meaning a puffin species of bird. We wrote about these tough (yet quite cute!) flying creatures in our January 2022 edition of The Essence. Their heartiness and extraordinary lives, mostly out at sea, exemplified a part of Aristotle Capital’s process of studying how businesses “weather” tough conditions. COVID was still impacting most countries – yet Iceland was largely spared – while its duration and consequences were not fully known.
Fast forward to 2026 and this same PM set out to replicate what was a unique journey. This time, however, a more circuitous route was taken. First through London to meet with some portfolio companies, then north to Ireland and Scotland. Then on to the Scottish Highlands and through the Faroe Islands as a last stop before Iceland. These 18 islands (population no more than 54,000 on a crowded day) are a self-governing part of Denmark, sitting between Iceland and Norway in the North Atlantic Ocean. This is where our PM met Dánial Hoydal, Founder and CEO of Faer Isles Distillery.
To read the full article, please use the link below.
Sources: CAPS CompositeHubTM, Bloomberg Past performance is not indicative of future results. Aristotle Value Equity Composite returns are presented gross and net of investment advisory fees and include the reinvestment of all income. Gross returns will be reduced by fees and other expenses that may be incurred in the management of the account. Net returns are presented net of model fees. Net returns are calculated by subtracting a model fee of 0.50% on an annual basis or 0.04167% on a monthly basis, which includes trading costs and the reinvestment of all income. Please see important disclosures at the end of this document.
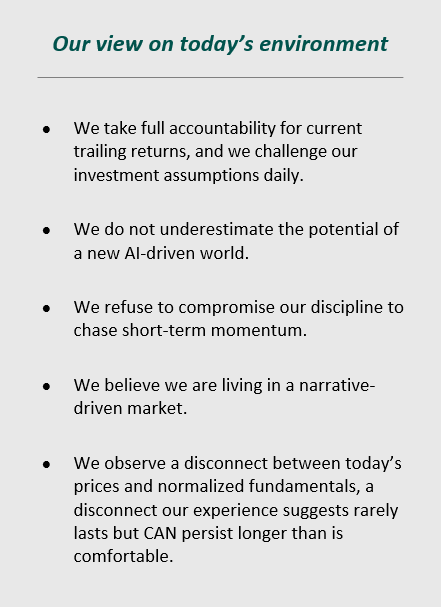
When capital is rushing away from resilient, predictable franchises to crowd into unpredictable, uncertain and yet-to-be-proven themes, it may create a headwind for our strategy. As speculative enthusiasm intensifies and capital becomes increasingly concentrated, those headwinds can grow considerably. And the more indiscriminate the inflows into those speculative areas, the more pronounced those headwinds become.
But we are not standing still. We are eagerly accumulating what in our view are durable quality companies at valuations we believe to be attractive.
The Scale of the Spending Firehose – From Processing Units to Memory Chips
A big part of recent underperformance is underexposure to spending on the data center ecosystem:
Much of today’s AI spending is going into short-lived data center hardware (three- to five-year economic life), especially processors and memory, rather than permanent infrastructure.
In the U.S., there are roughly 4,000 existing data centers. Today, there are almost 3,000 more planned or under construction. This spending has created extreme bottlenecks, first in processing and then in memory, driving extraordinary scarcity profits.
For the first two years of this cycle, Nvidia stood directly in front of the firehose, absorbing a point-blank blast of capital that took pre-tax cash flow from $8 billion in 2023 to an estimated $250 billion in 2026.
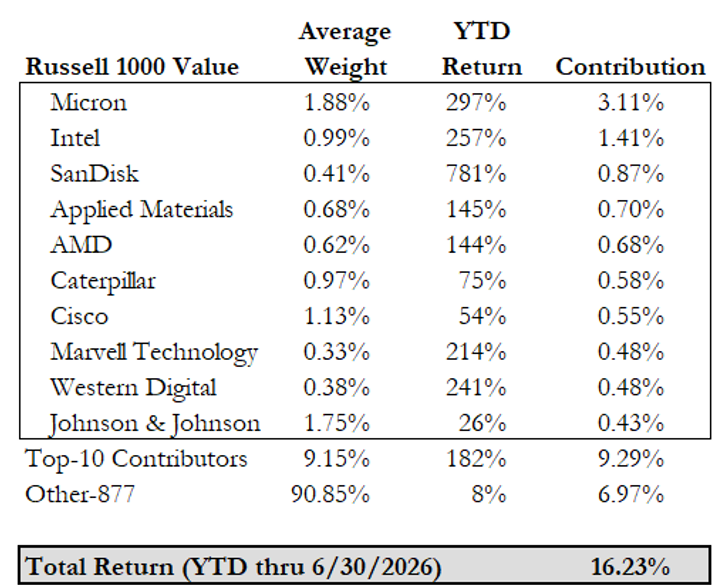
The firehose has pivoted to memory, as Micron’s pre-tax cash flow is estimated to rise from $2.5 billion in 2023 to approximately $100 billion in FY26 and $200 billion in FY27 — year to date through June 30, Micron had the largest weight in the Russell 1000 Value Index and was up approximately 300%, contributing nearly 20% of the Index’s return.
These are real earnings, but they are scarcity earnings, and when supply catches up, we believe pricing, earnings, and valuations will normalize.
Source: Factset
K Shaped: Wall Street Asset Owners and Main Street Consumers
But most businesses sit outside the AI data center ecosystem, and many are struggling:
The broader construction industry is facing its toughest environment since the Global Financial Crisis.
High rates have frozen housing activity, with turnover at its lowest level since the early 1990s.
The average U.S. home age is now a record 44 years old.
The average first-time homebuyer age is now 40, up from 32 in 2016.
In short, AI infrastructure is booming, but much of the real economy is not (sidenote: social and political consequences may follow).
Quality: Three Archetypes
We remain focused on Quality fundamentals, Valuations we believe are attractive, and Catalysts controlled by management teams with a long-term strategic plan (“QVC”).
When we explain that our investment process starts with “quality,” clients often balk. After all, what active manager doesn’t “seek high quality?” Fair point. But like beauty, quality is in the eye of the beholder, and we see three kinds: Transient, Conventional and Durable.
Transient Quality looks exceptional at the peak, with scarcity-driven pricing power, margin expansion, and high returns on capital that Wall Street often mistakes for permanent economics. But there is no cartel; supply eventually catches up, prices normalize and, once investors realize what has happened, significant valuation resets can occur. Consider memory technology companies today.
Conventional Quality still has powerful brands, customer loyalty, incumbency advantages, and ecosystem lock-in – but the old moats are eroding. Digital advertising, ecommerce, private label, low barriers to entry, and AI disruption have made many of these franchises less structurally resilient than they once were.
Durable Quality is where we are most energized, because scarcity is permanent rather than cyclical (or at least less so). These businesses can raise prices ahead of inflation for years without impairing volume, protected by natural monopolies, geology, irreplaceable infrastructure, essentiality, regulation, or deliberate scarcity. Consider businesses like luxury goods, regulated utilities, and mission-critical technology solutions, or specialty data providers, unique ingredient producers, and transportation platforms.
Performance and Attribution Summary
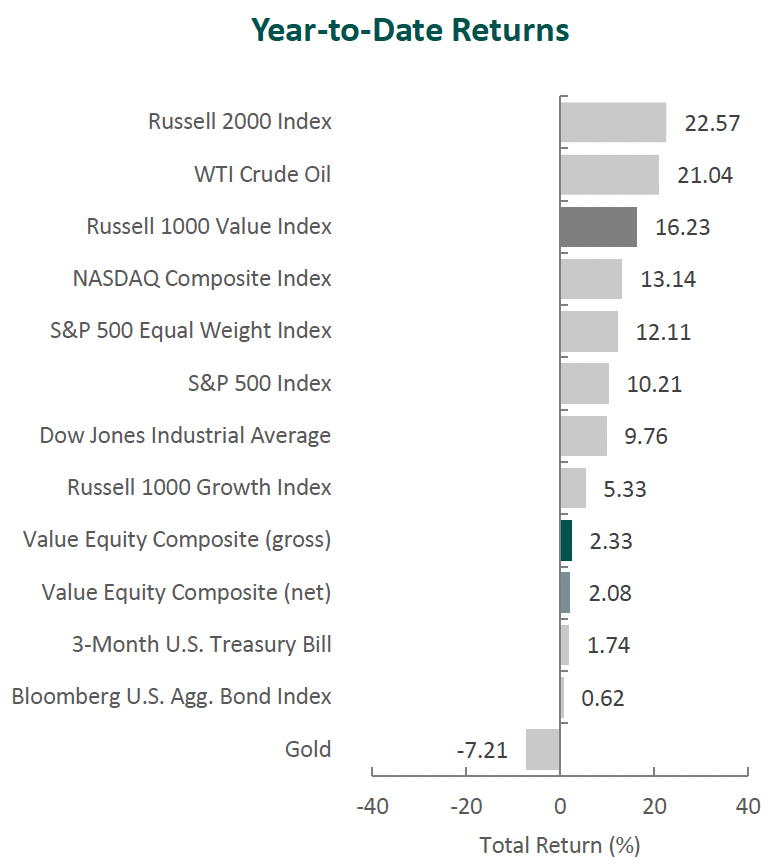
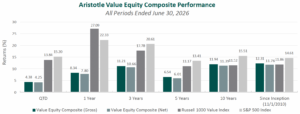
For the second quarter of 2026, Aristotle Capital’s Value Equity Composite posted a total return of 4.38% gross of fees (4.25% net of fees), underperforming the 13.84% return of the Russell 1000 Value Index and the 15.20% return of the S&P 500 Index. Please refer to the table for detailed performance.
Performance (%)
2Q26
YTD
1 Years
3 Years
5 Years
10 Years
Value Equity Composite (gross)
4.38
2.33
8.34
11.21
6.54
11.94
Value Equity Composite (net)
4.25
2.08
7.80
10.66
6.01
11.39
Russell 1000 Value Index
13.84
16.23
27.09
17.78
11.17
11.52
S&P 500 Index
15.20
10.21
22.33
20.61
13.41
15.51
Past performance is not indicative of future results. Aristotle Value Equity Composite returns are presented gross and net of model fees and include the reinvestment of all income. Gross returns will be reduced by fees and other expenses that may be incurred in the management of the account. Net returns are presented net of model fees. Net returns are calculated by subtracting a model fee of .50% on an annual basis or .04167% on a monthly basis, which includes trading costs and the reinvestment of all income. Please see important disclosures at the end of this document.
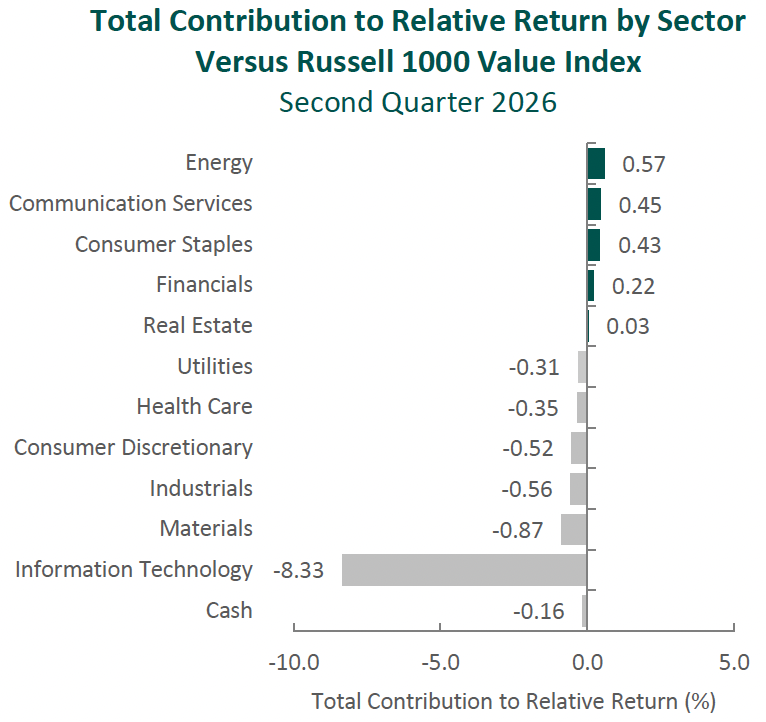
Source: FactSet Past performance is not indicative of future results. Sector attribution shows how much of a portfolio’s overall return is directly attributable to stock selection and asset allocation decisions within the portfolio, highlighting which sectors contributed or detracted to the total return. Attribution includes the reinvestment of income. Attribution is presented gross of fees and does not include the deduction of all fees and expenses that a client or investor has paid or would have paid. Please refer to the gross and net composite returns included within to understand the overall impact of fees.
The portfolio’s underperformance relative to the Russell 1000 Value Index in the second quarter can be attributed to security selection, while allocation effects contributed. Security selection in Information Technology and Industrials, as well as an overweight in Materials, detracted the most from relative performance. Conversely, an overweight in Information Technology, an underweight in Energy, and security selection in Communication Services contributed. (Relative weights are the result of bottom-up security selection.)
Contributors and Detractors for 2Q 2026
Relative Contributors
Relative Detractors
Qualcomm
TotalEnergies
Microchip Technology
Autodesk
Alphabet
Verizon
PNC Financial Services
Corteva
Mitsubishi UFJ Financial
Motorola Solutions
Relative contributors and detractors are based on attribution total effect and exclude benchmark securities not held in the portfolio.
Corteva, the seed and crop protection company, was one of the largest detractors during the period. While fundamentals remained healthy, with first-quarter FREE cash flow supported by strength in both Seed and Crop Protection, the stock lagged a sharply rising market as investors focused on Corteva’s more tempered outlook for the balance of the year. The management team cited potential second-half headwinds from tariffs, higher oil-related input costs, farmer fuel expenses, and competitive crop protection pricing in Latin America and Asia. We believe the market also weighed the near-term complexity of Corteva’s planned fourth-quarter separation into New Corteva and Vylor, including potential dis-synergies from operating two public companies. Nevertheless, our investment thesis remains intact. Farmers continue to adopt Corteva’s latest hybrids, varieties, and premium crop protection technologies, supporting Corteva’s margin expansion. Meanwhile, the company’s R&D-led innovation, disciplined cost management, and path toward net royalty income should enhance its long-term competitive position. Management has remained steadfast in returning shareholder value, with $500 million of share repurchases in the first half of the year. Finally, Corteva remains opportunistic as exemplified by its partnership with FMC Corporation to expand its product and technology portfolio.
Motorola Solutions, the provider of mission-critical communications and security systems, was one of the largest detractors during the quarter. Shares declined as higher memory and supply chain costs weighed on near-term margin expectations. While these factors affected near-term results, they do not change our long-term thesis. At the core of the company is its land mobile radio business, which provides the communication backbone used by police, fire, and emergency responders – particularly during natural disasters or other high-stress situations when commercial networks may become congested or unavailable. These systems are deeply embedded in public safety agencies, where reliability, control, and resiliency are non-negotiable, and customer relationships are often supported by long-term service agreements, predictable equipment refresh cycles, and decades of trust. Importantly, Motorola is using this installed base to broaden its platform, integrating radios with video security, body-worn cameras, and command center software to help agencies unify voice, video, and data across public safety workflows. The company is also expanding its capabilities through acquisitions such as Silvus Technologies, which adds secure wireless communications technology used in defense, unmanned systems, and other demanding environments. We believe these opportunities, together with a continued shift toward higher-margin software and recurring services, should support improved profitability and FREE cash flow generation over our three- to five-year investment horizon.
Qualcomm, a leading semiconductor and communications technology company, was the largest contributor for the quarter. Shares recovered as management indicated that the inventory adjustments and production constraints resulting from higher memory costs were progressing largely as expected and that handset revenues from Chinese customers were expected to reach a bottom. As we noted last quarter, we believed these headwinds to be cyclical rather than structural and did not alter our long-term investment thesis. The company also continued to make progress on its long-term strategy of evolving from a handset-centric company into a broader provider of connected computing technologies. Automotive revenue reached another record high, while Internet of Things (IoT) and newer businesses such as AI-enabled PCs, industrial applications, and data center computing continue to represent a growing portion of the company and remain central to its long-term diversification strategy. We believe Qualcomm’s technologies will continue to benefit as connectivity expands across devices and AI workloads increasingly extend from the cloud to the edge, supporting Qualcomm’s ability to generate strong levels of FREE cash flow in the long run.
Alphabet, the parent company of Google and YouTube, was a primary contributor during the period. We initiated our position in the first quarter of 2025, when investors were concerned that generative AI tools would fundamentally alter search behavior and erode Google’s advertising franchise. Since then, Alphabet has continued to demonstrate the strength of its ecosystem and the resilience of its core businesses. Google Search has remained strong, with AI-powered features increasing user engagement while supporting advertising growth, and Google Cloud has continued to benefit from robust enterprise demand for AI infrastructure and services. Importantly, Alphabet appears increasingly capable of monetizing these new experiences in a manner consistent with its historical strengths, through advertising, distribution, and integration across a broad user base rather than relying solely on paid subscriptions. YouTube also remains well-positioned to benefit from continued growth in advertising and subscription revenues, including YouTube TV, as consumers continue to shift away from traditional cable. In addition, while we continue to monitor regulatory risk, capital intensity, and changes in search behavior, recent execution reinforces our view that Alphabet remains a high-quality business with durable competitive advantages and multiple avenues for long-term value creation.
Recent Portfolio Activity
Buys
Sells
Autodesk
Atmos Energy
Edwards Lifesciences
Danaher
During the quarter, we sold our positions in Atmos Energy and Danaher and purchased Autodesk and Edwards Lifesciences.
We first invested in Atmos Energy, the largest fully regulated natural gas-only utility in the U.S., in the first quarter of 2022. We were attracted to the company’s strong balance sheet, constructive regulatory environment across its service territories, and significant opportunity to invest in infrastructure modernization projects. During our holding period, Atmos benefited from ongoing system replacement programs, population growth in its key markets, and supportive rate mechanisms that allowed it to earn attractive returns on invested capital. While we continue to view Atmos as a high-quality business, we believe many of the catalysts identified at purchase have either been realized or are well underway. Looking ahead, we expect the company’s growth plan to require a significantly higher level of equity capital than in prior investment cycles. As a result, we elected to exit our position and redeploy the proceeds into Autodesk, which we believe offers a more compelling investment opportunity.
We first invested in Danaher, a company focused on biotechnology, life sciences and diagnostics, in the second quarter of 2016, attracted by its disciplined capital allocation, differentiated operating culture, and consistent FREE cash flow generation. The business is distinguished by a portfolio of market-leading franchises and a high mix of recurring consumables revenue tied to a large installed base. Its differentiated operating culture, anchored by the Danaher Business System (DBS), has historically enabled the company to be a highly effective acquirer, consistently integrating new businesses, expanding margins, and driving strong FREE cash flow generation. Over our decade-long holding period, Danaher successfully transformed itself from a diversified industrial company into a more focused healthcare business. This evolution included the spinoffs of Fortive, Envista, and Veralto, as well as the acquisition and integration of key assets such as Pall, Cepheid, and Cytiva. The company also increased the contribution from recurring revenue and workflow-based solutions embedded in customer operations, which contributed to the durability and predictability of the business.
More recently, as Danaher has shifted further into more complex, innovation-driven end markets, the application of DBS appears to be less differentiated than it was in Danaher’s traditional manufacturing-oriented businesses. Success in these new end markets is increasingly driven by scientific innovation, faster product cycles, and more specialized customer requirements. At the same time, increased scale and a more centralized organizational structure appear to be limiting flexibility at the business unit level, reducing the speed and effectiveness with which opportunities can be pursued. While we continue to view Danaher as a high-quality business, we believe much of our original investment thesis has now been realized, with fewer company-specific catalysts ahead. Accordingly, we elected to exit the position and redeploy the proceeds into what we view as a more attractive opportunity in Edwards Lifesciences.
Autodesk
Headquartered in Northern California and founded in 1982, Autodesk produces software that allows companies to design and model their products and/or projects. The company is the global industry standard for computer-aided design in the architecture, engineering, and construction industry (AEC). Autodesk’s millions of subscribers rely on its software to design and model buildings, manufactured products, animated films, and video games. The company’s four segments are AEC (~48% of net sales), its iconic software AutoCAD (~27%), Manufacturing (~20%), and Media and Entertainment (M&E) (~5%).
Autodesk primarily sells its software on a subscription basis, having discontinued perpetual license sales of most standalone products in 2016. As part of the move to subscription licensing, Autodesk replaced its product suite with three streamlined “Industry Collections” focused on AEC, Manufacturing and M&E.
In recent years, the AEC industry has increasingly sought to resolve the inefficiencies that arise when many parties are needed to complete a building project. Autodesk has been at the cutting edge of enabling improvement through innovation and promoting the use of open standards, or open building information modeling (BIM), which allows for all relevant building data to be processed virtually in a 3D model and shared across stakeholders. Importantly, Autodesk’s leadership in ensuring the interoperability of its software with that of competitors increases collaboration and productivity among architects, engineers and contractors—an attractive value proposition for its customers.
High-Quality Business
Some of the quality characteristics we have identified for Autodesk include:
Brand power, as AutoCAD is one of the most recognizable products in the industry;
Leading market share in AEC software, where Autodesk’s BIM platform has reinforced its position as the industry standard;
Large and loyal installed base of over six million users across more than 180 countries;
Stable business model with a high degree of recurring revenue (97% of total) and significant FREE cash flow generation; and
Substantial switching costs and pricing power that stem from its advanced solutions, network effects and the time (often many years) it requires for a professional to master Autodesk software.
Attractive Valuation
We believe shares of Autodesk are attractively valued given our estimates of normalized earnings. In our view, the market underappreciates Autodesk’s ability to sustain double-digit revenue growth while maintaining high levels of profitability, with operating margins of approximately 40%. Supported by pricing initiatives, strong customer retention and a highly recurring revenue model, we believe the shares do not fully reflect the company’s long-term earnings power and ability to generate FREE cash flow.
Compelling Catalysts
Catalysts we have identified for Autodesk, which we believe will cause its stock price to appreciate over our three- to five-year investment horizon, include:
Expanding adoption of BIM, 3D modeling and construction coordination tools as customers increasingly seek to improve collaboration and productivity across complex projects, driving greater utilization of Autodesk’s software portfolio;
Benefits from its multi-year go-to-market modernization initiative, including greater automation of renewals through direct billing and auto-renew capabilities, allowing sales resources to focus on growth opportunities rather than maintenance activities;
Increased monetization through tiered offerings and consumption-based pricing initiatives, which should support higher average selling prices over time; and
Continued market share gains across its core AEC and Manufacturing software businesses.
Edwards Lifesciences Corporation
Headquartered in Irvine, California, Edwards Lifesciences is a global leader in structural heart disease therapies, developing and commercializing medical devices used to treat advanced cardiovascular conditions. The company is best known for its leadership in transcatheter aortic valve replacement (TAVR), a minimally invasive procedure that allows physicians to replace diseased heart valves without open-heart surgery. By reducing the invasiveness, recovery time and risk associated with traditional surgical valve replacement, TAVR has significantly expanded the number of patients eligible for treatment and accelerated adoption across the structural heart market.
We have followed Edwards for many years as both a leading structural heart company and a competitor to Medtronic’s CoreValve platform. Over the last decade, Edwards effectively “bet the company” on TAVR technology and successfully established its Sapien platform as one of the leading transcatheter heart valve systems globally while maintaining a meaningful presence in surgical aortic valve replacement (SAVR). Today, TAVR represents the core of Edwards’ business and is supported by a large global installed base, extensive physician training and extensive long-term clinical evidence, reinforcing its position as a standard of care for aortic stenosis.
Beyond TAVR, Edwards is expanding into transcatheter mitral and tricuspid therapies (TMTT), which represent a significantly larger but more underpenetrated market opportunity. The company is also investing in adjacent cardiovascular technologies, supported by continued investment in research and development, targeted acquisitions, and substantial FREE cash flow generation.
High-Quality Business
Some of the quality characteristics we have identified for Edwards Lifesciences include:
Leadership in transcatheter heart valve technologies, particularly TAVR, where the company’s Sapien platform is widely regarded as a gold standard among physicians;
High barriers to entry, driven by clinical data, physician training requirements and regulatory approvals, which create meaningful switching costs once devices are adopted in practice;
A strong innovation-driven culture, supported by consistent investment in R&D and a track record of developing next-generation cardiovascular therapies; and
A focused strategy centered on structural heart disease, allowing for deep expertise and a comprehensive product portfolio across aortic, mitral and tricuspid valve therapies.
Attractive Valuation
While the TAVR market is more developed, we believe both the continued expansion of this franchise and the scaling contribution from newer mitral and tricuspid therapies are not fully reflected in the current stock price. As these businesses continue to scale and adoption broadens, we expect continued improvement in operating performance and FREE cash flow generation over our investment horizon.
Compelling Catalysts
Catalysts we have identified for Edwards Lifesciences, which we believe will cause its stock price to appreciate over our three- to five-year investment horizon, include:
Higher TAVR procedure volumes, driven by increasing penetration across symptomatic and asymptomatic patient populations, ongoing clinical data supporting use in additional indications, expanding physician adoption, and continued share gains relative to surgical valve replacement surgery (SAVR);
Broader adoption of TMTT valve therapies, which we believe represent a market opportunity significantly larger than TAVR over time;
Expansion into adjacent cardiovascular technologies, including heart failure monitoring and treatment, supported by internal development and targeted acquisitions; and
Continued deployment of substantial FREE cash flow into internal innovation, targeted acquisitions and shareholder returns, supported by a strong balance sheet and meaningful net cash position.
Conclusion
We believe markets are extrapolating the earnings of today’s AI infrastructure beneficiaries far into the future and treating Transient Quality as though it were durable. While artificial intelligence and its enabling technologies are undoubtedly important, history suggests that no investment theme enjoys an uninterrupted run forever. Capital eventually chases diminishing returns, valuations become overly extended, and investors begin to rediscover quality businesses outside the market’s narrow focus. Cycles don’t end because the underlying technology disappears—they end because expectations and prices become disconnected from what is normal.
We are not dismissing AI, nor are we waiting passively for the market to change. We are using this dislocation to upgrade the portfolio toward what we believe to be elite Durable Quality businesses, purchased at valuations that better reflect normalized fundamentals. In periods like this, discipline can feel uncomfortable, but history suggests that prices and fundamentals eventually reconnect. Our objective is to ensure that when they do, our clients own businesses with the durability, pricing power, and compounding potential to create value well beyond the current cycle.
Disclosures
The opinions expressed herein are those of Aristotle Capital Management, LLC (Aristotle Capital) and are subject to change without notice. Past performance is not a guarantee or indicator of future results. This material is not financial advice or an offer to purchase or sell any product. You should not assume that any of the securities transactions, sectors or holdings discussed in this report were or will be profitable, or that recommendations Aristotle Capital makes in the future will be profitable or equal the performance of the securities listed in this report. The portfolio characteristics shown relate to the Aristotle Value Equity strategy. Not every client’s account will have these characteristics. Aristotle Capital reserves the right to modify its current investment strategies and techniques based on changing market dynamics or client needs. There is no assurance that any securities discussed herein will remain in an account’s portfolio at the time you receive this report or that securities sold have not been repurchased. The securities discussed may not represent an account’s entire portfolio and, in the aggregate, may represent only a small percentage of an account’s portfolio holdings. The performance attribution presented is of a representative account from Aristotle Capital’s Value Equity Composite. The representative account is a discretionary client account which was chosen to most closely reflect the investment style of the strategy. The criteria used for representative account selection is based on the account’s period of time under management and its similarity of holdings in relation to the strategy. Recommendations made in the last 12 months are available upon request.
Returns are presented gross and net of model fees and include the reinvestment of all income. Gross returns will be reduced by fees and other expenses that may be incurred in the management of the account. Net returns are presented net of model fees. Net returns are calculated by subtracting a model fee of .50% on an annual basis or .04167% on a monthly basis, which includes trading costs and the reinvestment of all income. Relative performance discussed represents Aristotle Capital equity strategies – Value Equity, International Equity, Global Equity, net of fees versus stated benchmarks for QTD, YTD, and 1-year periods.
All investments carry a certain degree of risk, including the possible loss of principal. Investments are also subject to political, market, currency and regulatory risks or economic developments. International investments involve special risks that may in particular cause a loss in principal, including currency fluctuation, lower liquidity, different accounting methods and economic and political systems, and higher transaction costs. These risks typically are greater in emerging markets. While Large-capitalization companies may have more stable prices than smaller, less established companies, they are still subject to equity securities risk. In addition, large-capitalization equity security prices may not rise as much as prices of equity securities of small-capitalization companies. Securities of small- and medium-sized companies tend to have a shorter history of operations and be more volatile and less liquid. Value stocks can perform differently from the market as a whole and other types of stocks. The material is provided for informational and/or educational purposes only and is not intended to be and should not be construed as investment, legal or tax advice and/or a legal opinion. Investors should consult their financial and tax adviser before making investments. The opinions referenced are as of the date of publication, may be modified due to changes in the market or economic conditions, and may not necessarily come to pass. Information and data presented has been developed internally and/or obtained from sources believed to be reliable. Aristotle Capital does not guarantee the accuracy, adequacy or completeness of such information.
Aristotle Capital Management, LLC is an independent registered investment adviser under the Advisers Act of 1940, as amended. Registration does not imply a certain level of skill or training. More information about Aristotle Capital, including our investment strategies, fees and objectives, can be found in our ADV Part 2, which is available upon request. ACM-2607-33
Performance Disclosures
Sources: CAPS CompositeHubTM, Russell Investments, Standard & Poor’s
Past performance is not indicative of future results. The information provided should not be considered financial advice or a recommendation to purchase or sell any particular security or product. Performance results for periods greater than one year have been annualized. The Aristotle Value Equity strategy has an inception date of November 1, 2010; however, the strategy initially began at Mr. Gleicher’s predecessor firm in October 1997. A supplemental performance track record from January 1, 2001 through October 31, 2010 is provided above. The returns are based on two separate accounts and performance results are based on custodian data. During this time, Mr. Gleicher had primary responsibility for managing the two accounts, one account starting in November 2000 and the other in December 2000.
Composite and supplemental returns are presented gross and net of model fees and include the reinvestment of all income. Gross returns will be reduced by fees and other expenses that may be incurred in the management of the account. Net returns are presented net of model fees. Net returns are calculated by subtracting a model fee of .50% on an annual basis or .04167% on a monthly basis, which includes trading costs and the reinvestment of all income.
Index Disclosures
The Russell 1000® Value Index measures the performance of the large cap value segment of the U.S. equity universe. It includes those Russell 1000 Index companies with lower price-to-book ratios and lower expected growth values. The S&P 500® Index is the Standard & Poor’s Composite Index of 500 stocks and is a widely recognized, unmanaged index of common stock prices. The S&P 500 Equal Weight Index is designed to be the size-neutral version of the S&P 500. It includes the same constituents as the cap-weighted S&P 500, but each company in the S&P 500 Equal Weight Index is allocated the same weight at each quarterly rebalance. The Russell 1000® Growth Index measures the performance of the large cap growth segment of the U.S. equity universe. It includes those Russell 1000 companies with higher price-to-book ratios and higher forecasted growth values. The Russell 2000® Index measures the performance of the small cap segment of the U.S. equity universe. The Russell 2000 Index is a subset of the Russell 3000® Index representing approximately 10% of the total market capitalization of that index. It includes approximately 2,000 of the smallest securities based on a combination of their market cap and current index membership. The Dow Jones Industrial Average® is a price-weighted measure of 30 U.S. blue-chip companies. The Index covers all industries except transportation and utilities. The NASDAQ Composite Index measures all NASDAQ domestic and international based common type stocks listed on The NASDAQ Stock Market. The NASDAQ Composite includes over 3,000 companies, more than most other stock market indexes. The Bloomberg U.S. Aggregate Bond Index is an unmanaged index of domestic investment grade bonds, including corporate, government and mortgage-backed securities. The WTI Crude Oil Index is a major trading classification of sweet light crude oil that serves as a major benchmark price for oil consumed in the United States. The 3-Month U.S. Treasury Bill is a short-term debt obligation backed by the U.S. Treasury Department with a maturity of three months. The volatility (beta) of the Composite may be greater or less than its respective benchmarks. It is not possible to invest directly in these indices.