(All MSCI index returns are shown net and in U.S. dollars unless otherwise noted.)
Markets Review
Sources: CAPS CompositeHubTM, Bloomberg
Past performance is not indicative of future results. Aristotle International Equity ADR WM Composite returns are presented pure gross and net of the maximum wrap fee and include the reinvestment of all income. Pure gross returns do not reflect the deduction of any trading costs or other fees and are supplemental to the net returns. Net returns are calculated by subtracting the highest applicable wrap/SMA fee, which includes trading costs and custodial fees, from the pure gross composite return. (From inception to 12/31/2015, the highest applicable wrap/SMA fee is 3.00% on an annual basis, or 0.75% quarterly. From 1/1/2016 to 12/31/2023, the highest applicable wrap/SMA fee is 2.00% on an annual basis, or 0.50% quarterly and 0.17% monthly from 1/1/2024 to present.) Aristotle Capital Composite returns are preliminary pending final account reconciliation. Please see important disclosures at the end of this document.
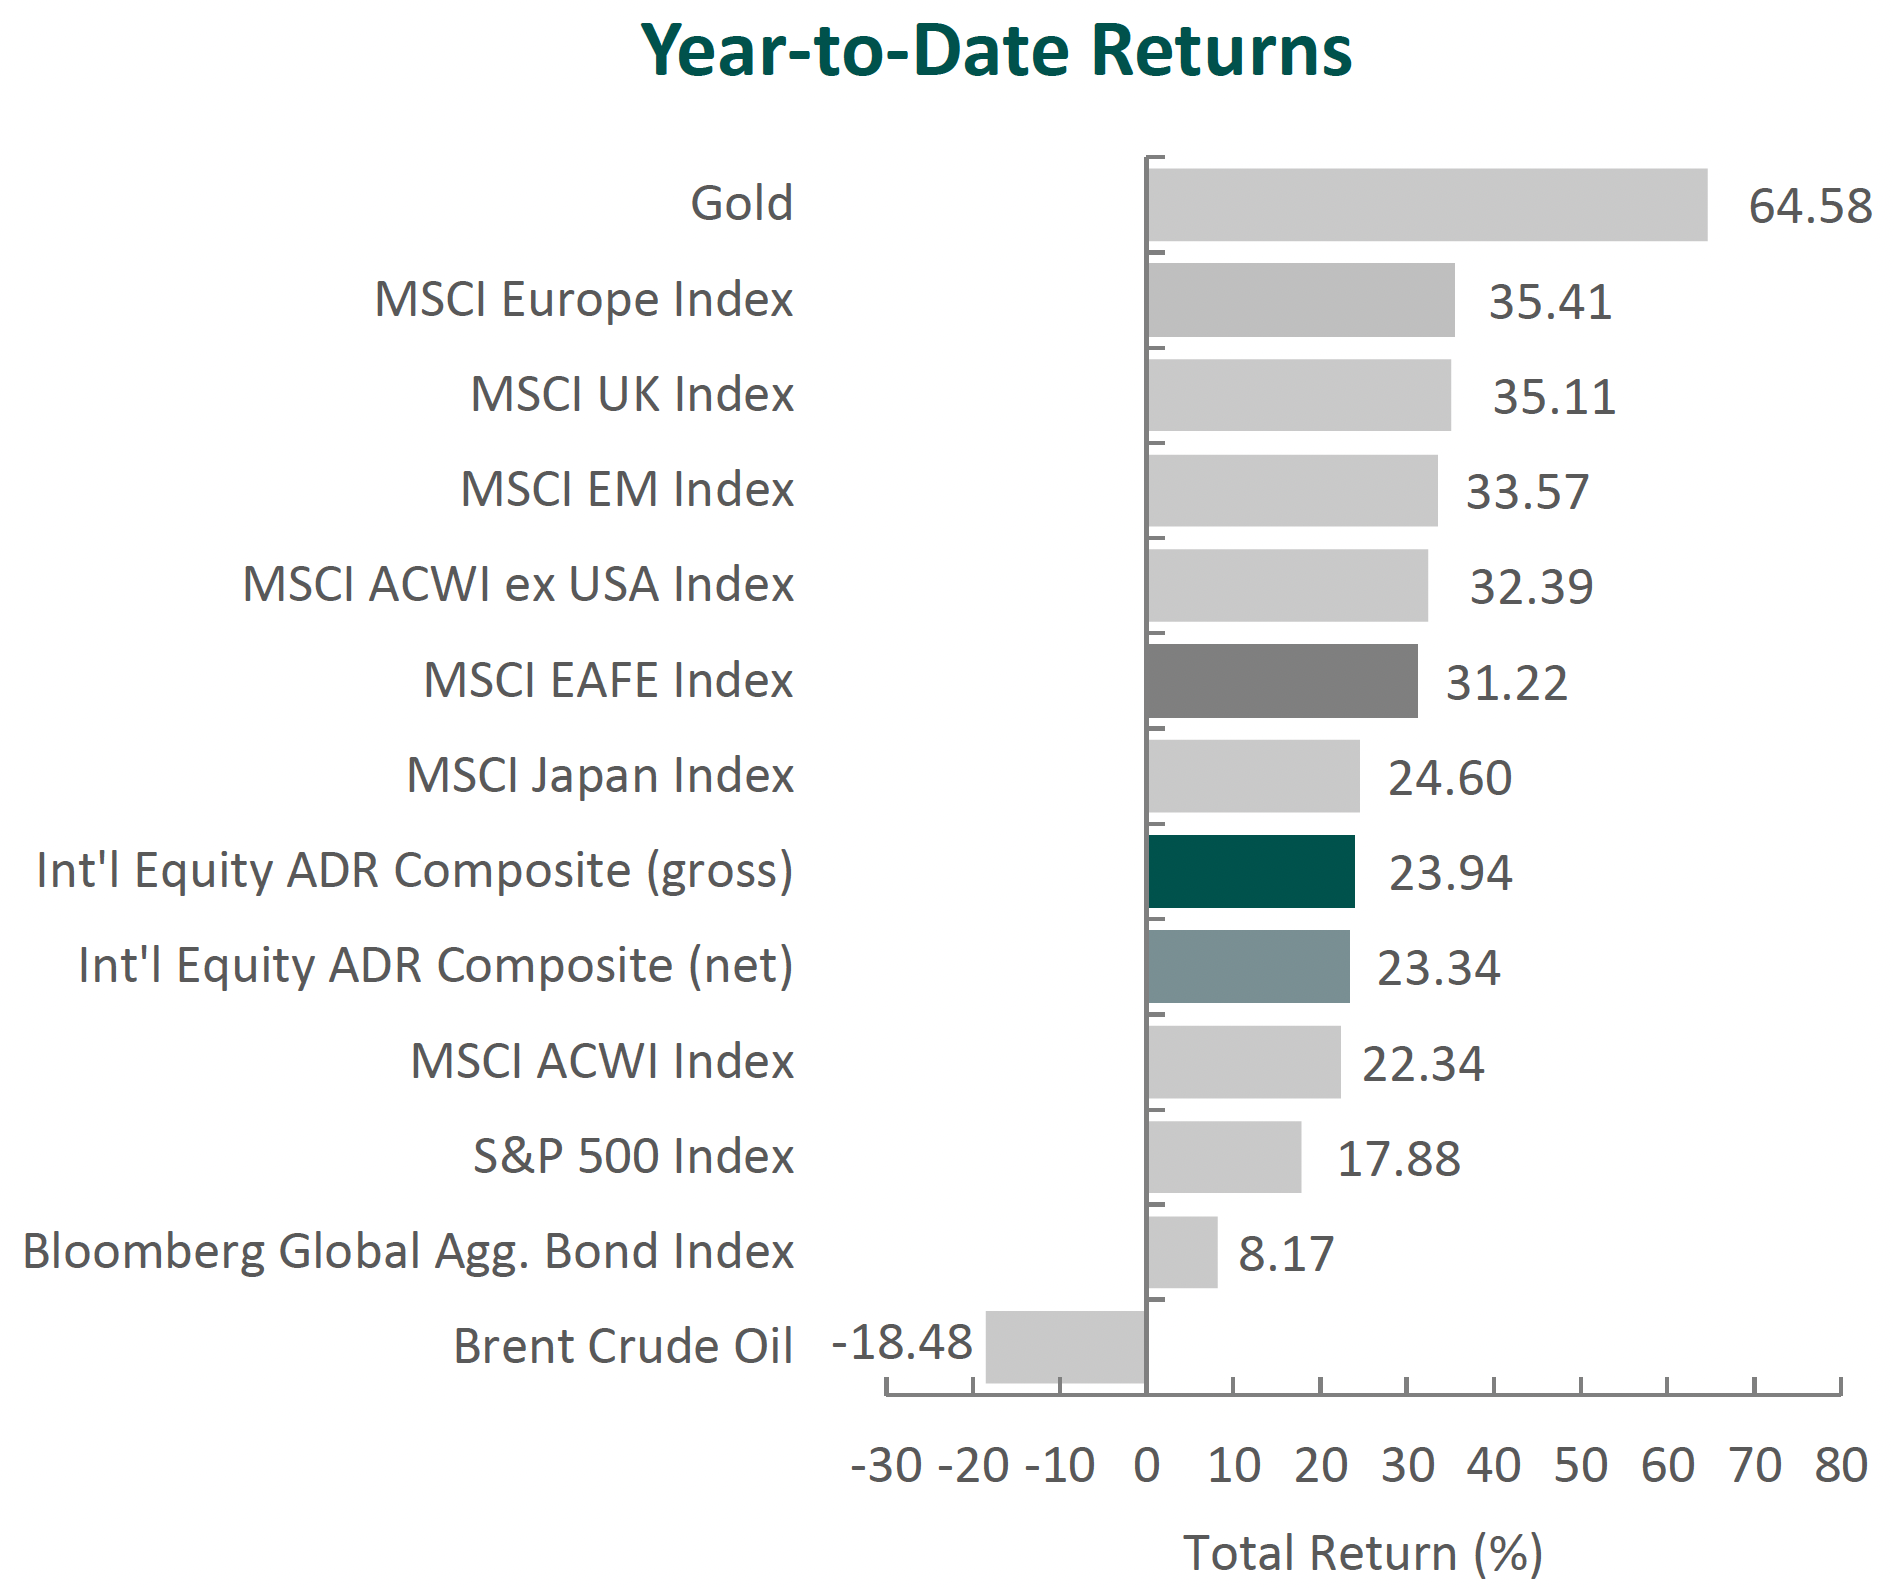
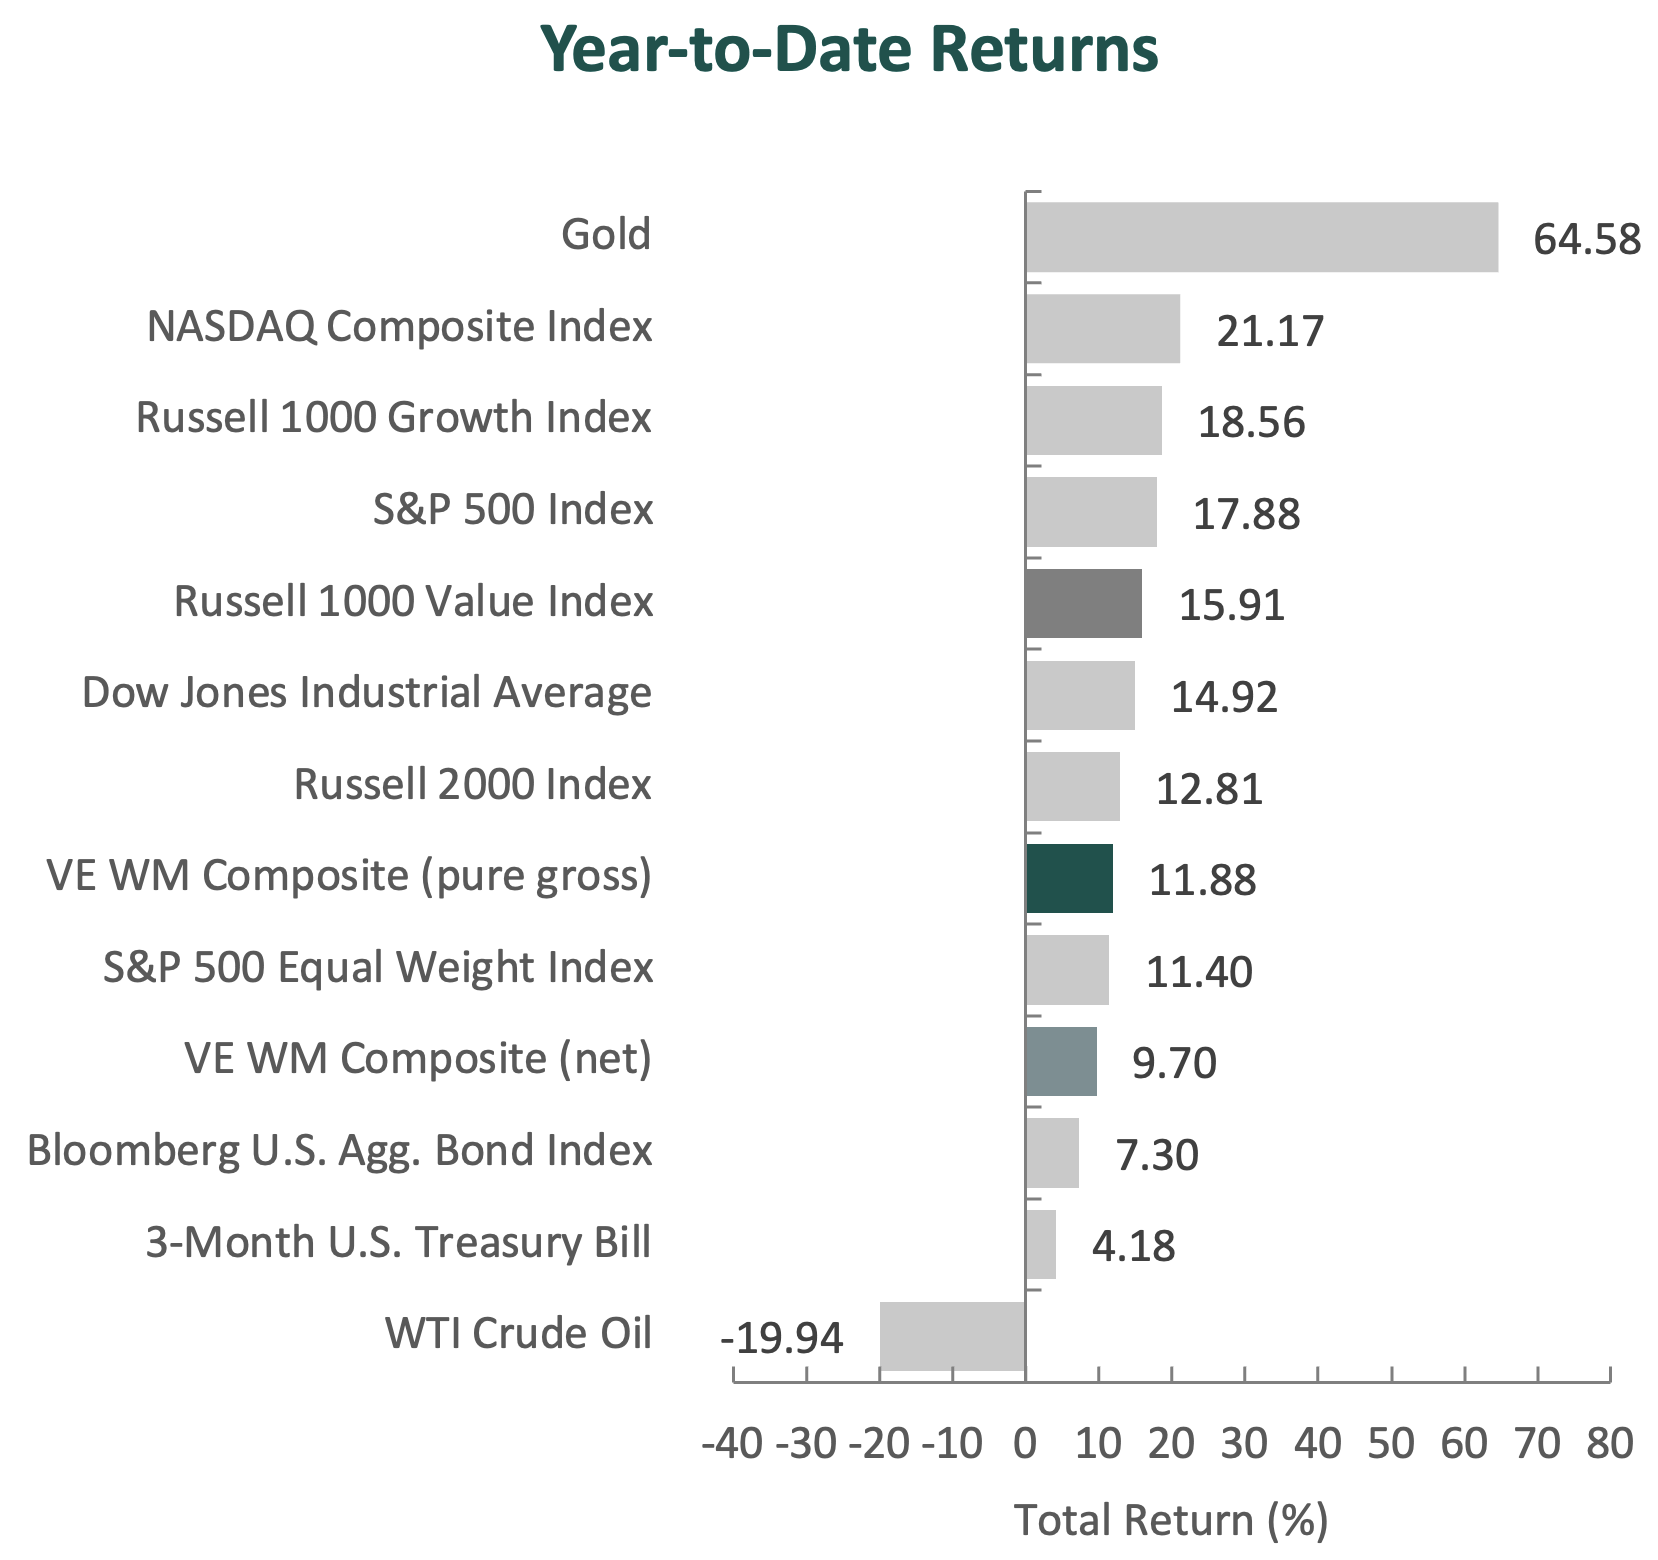
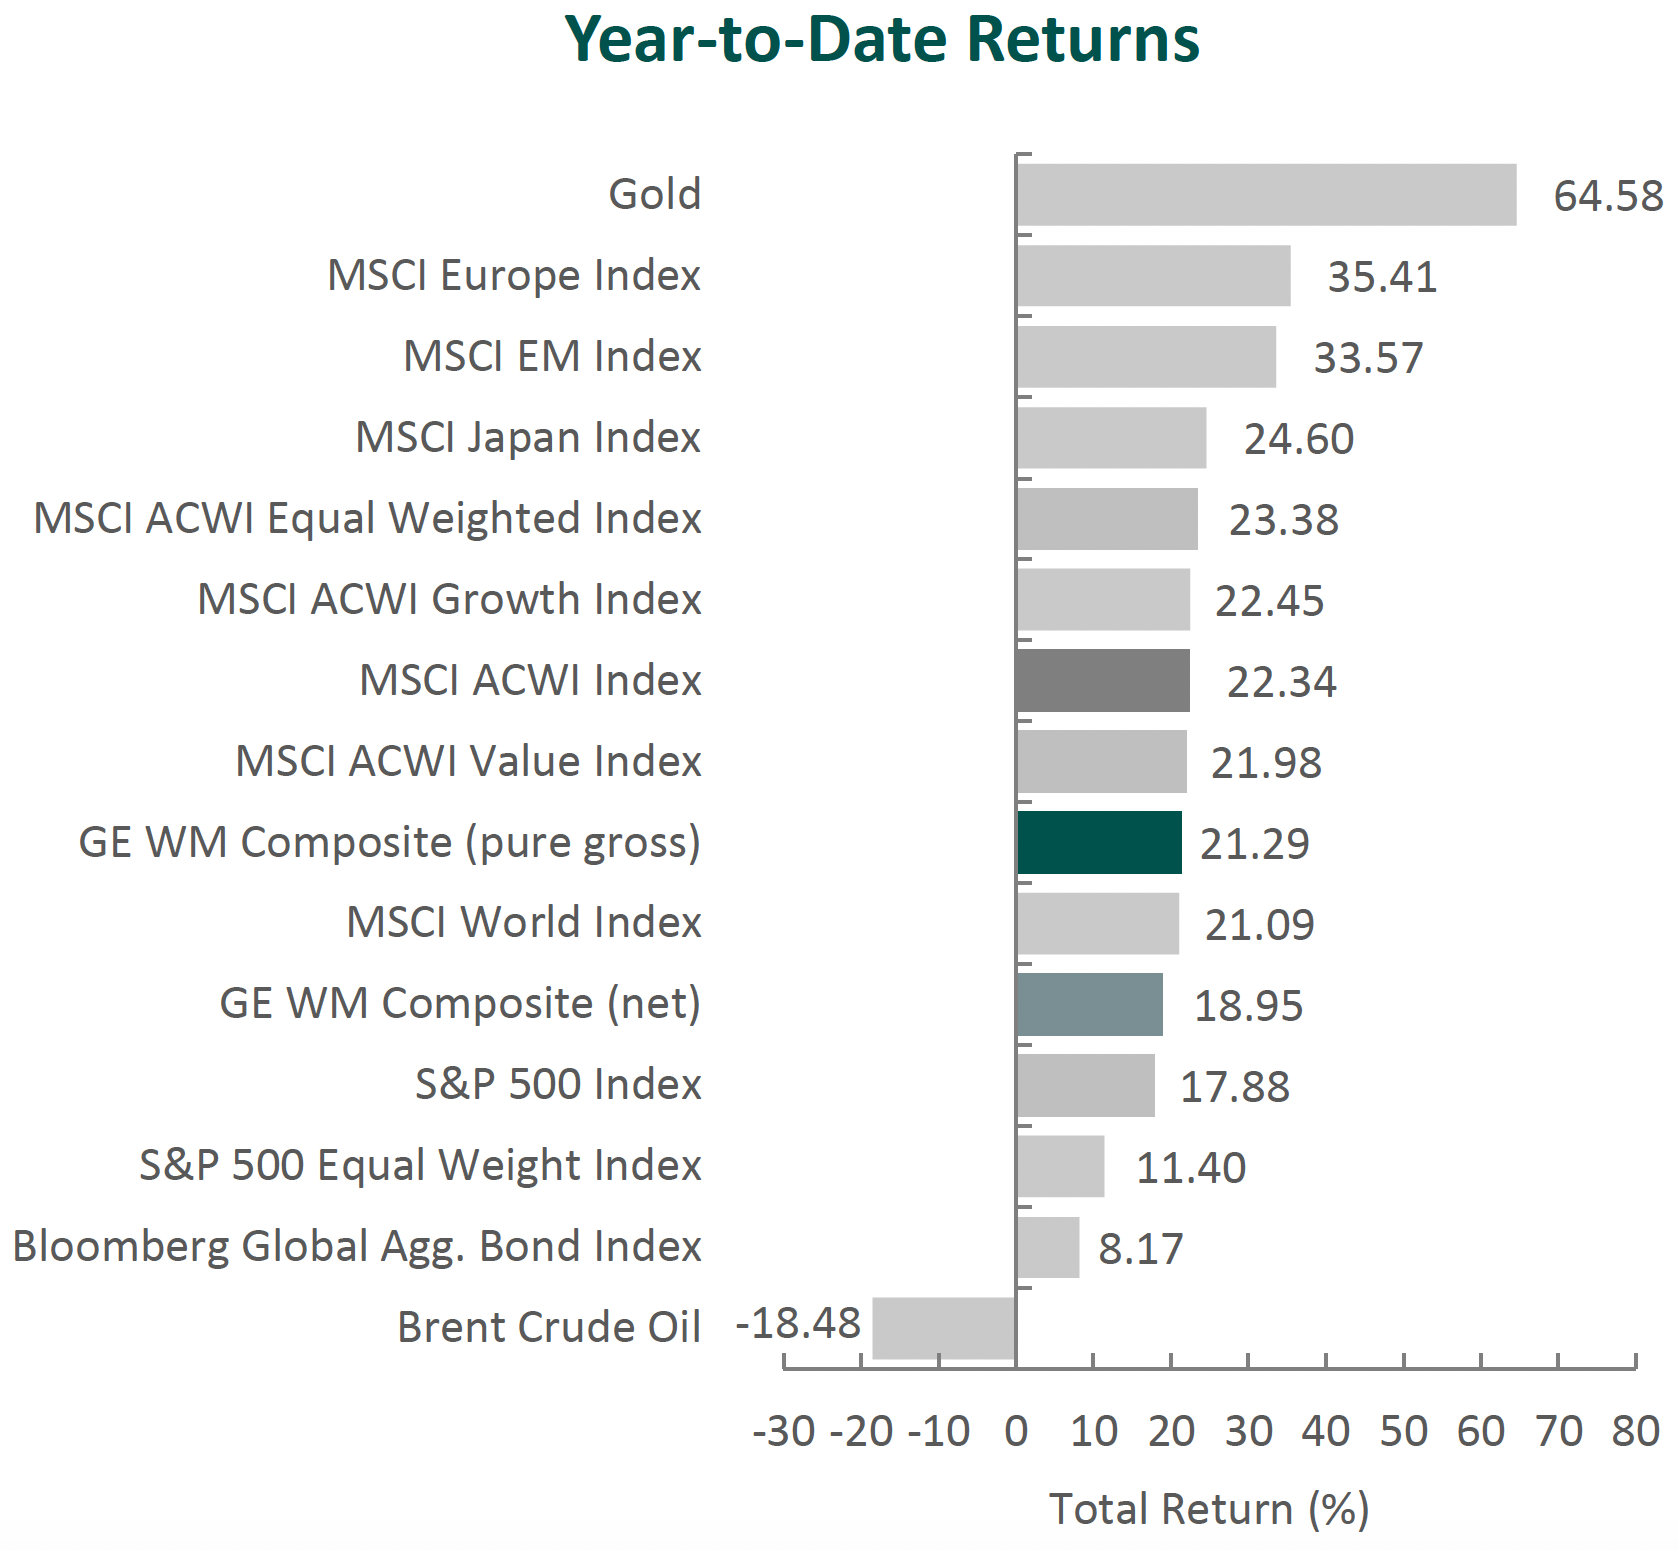
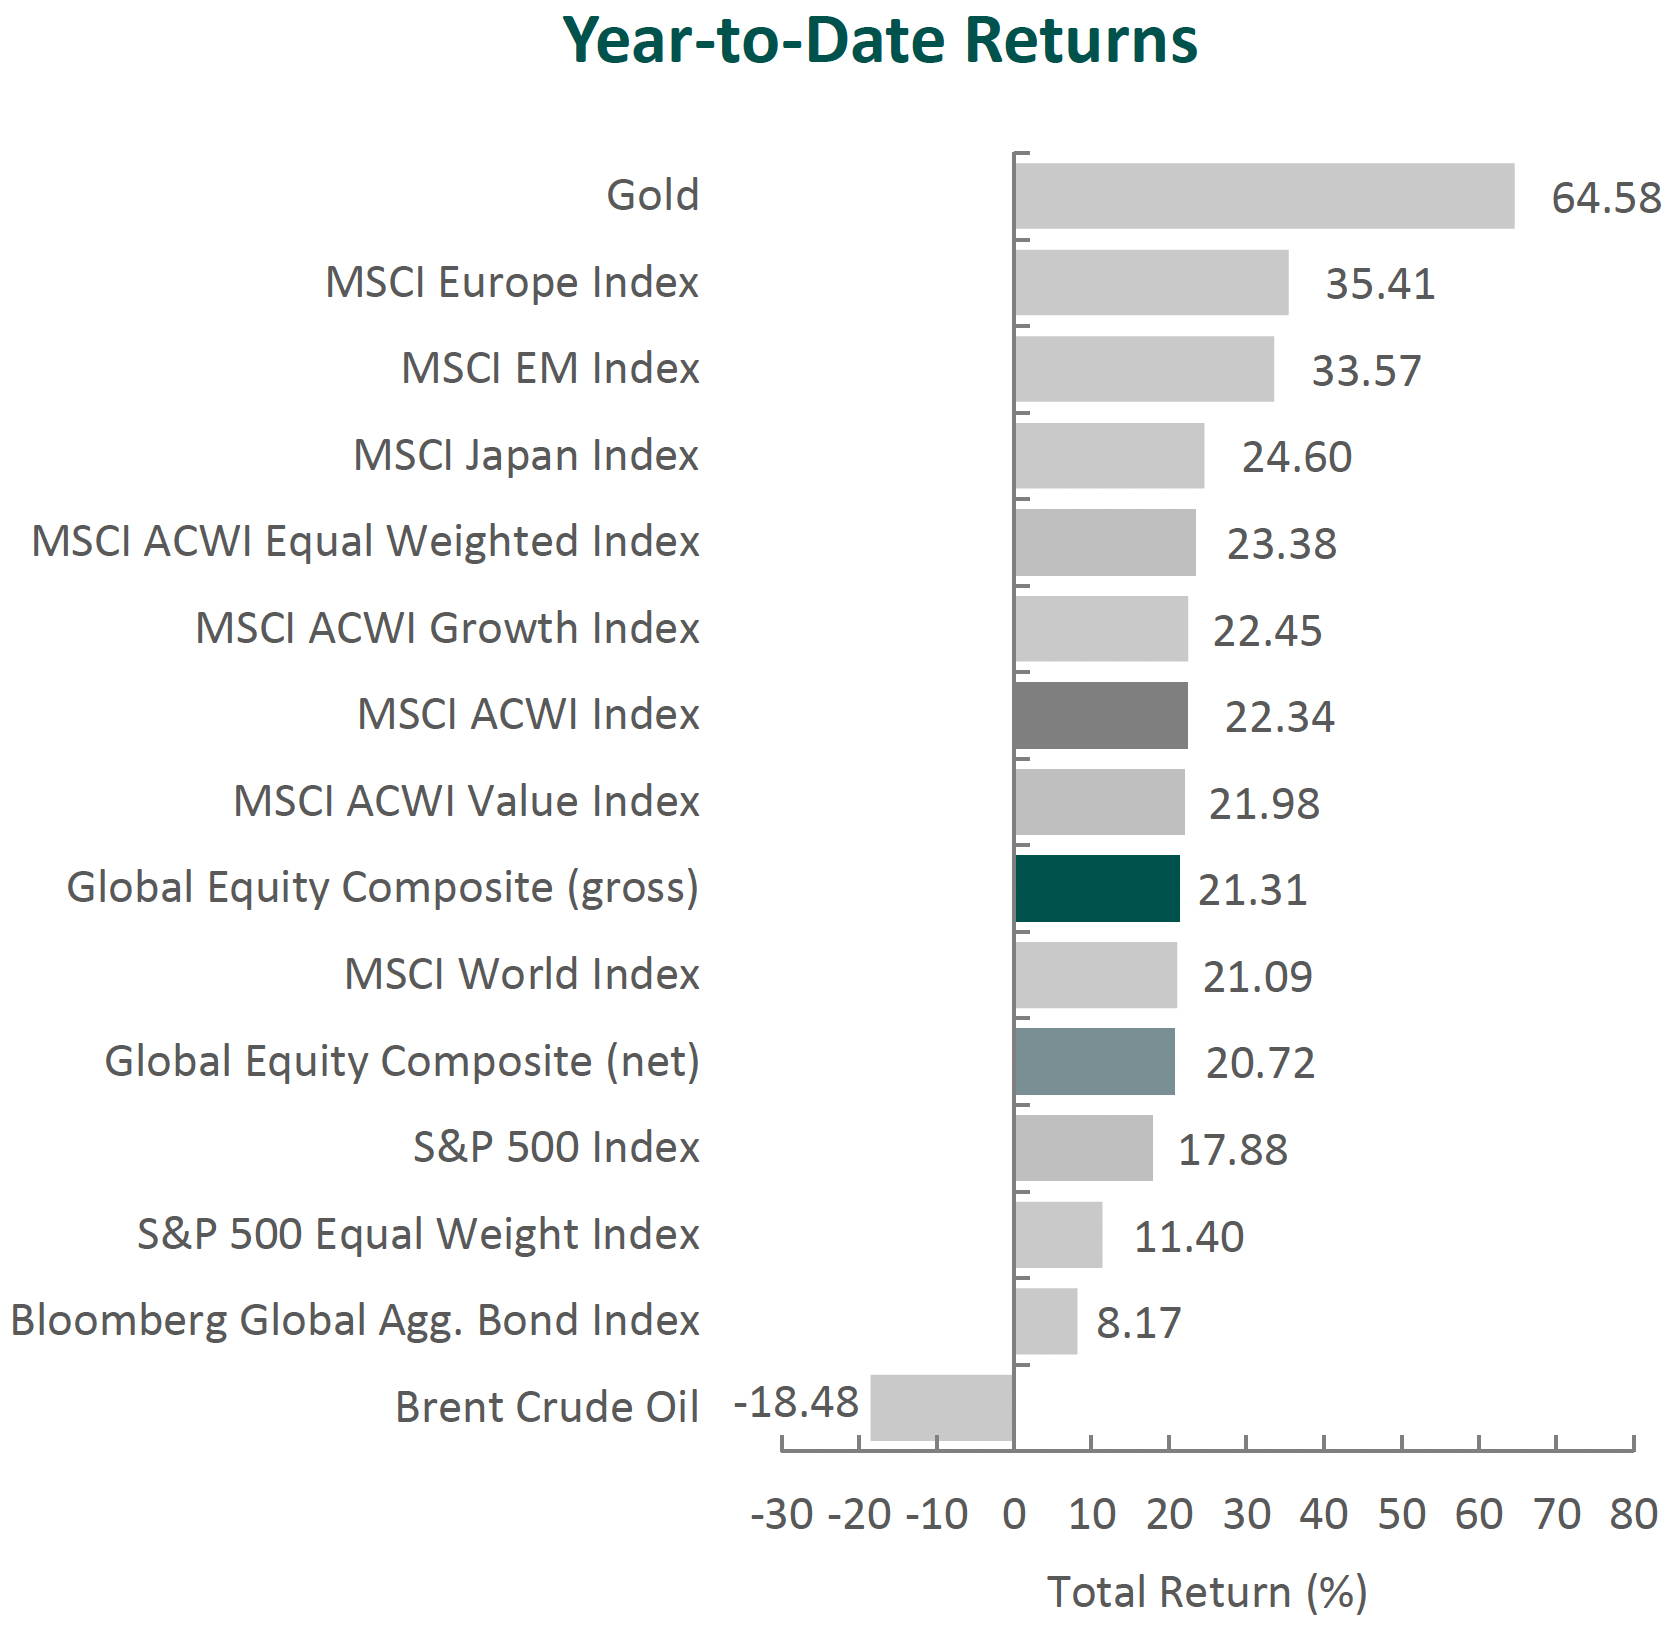
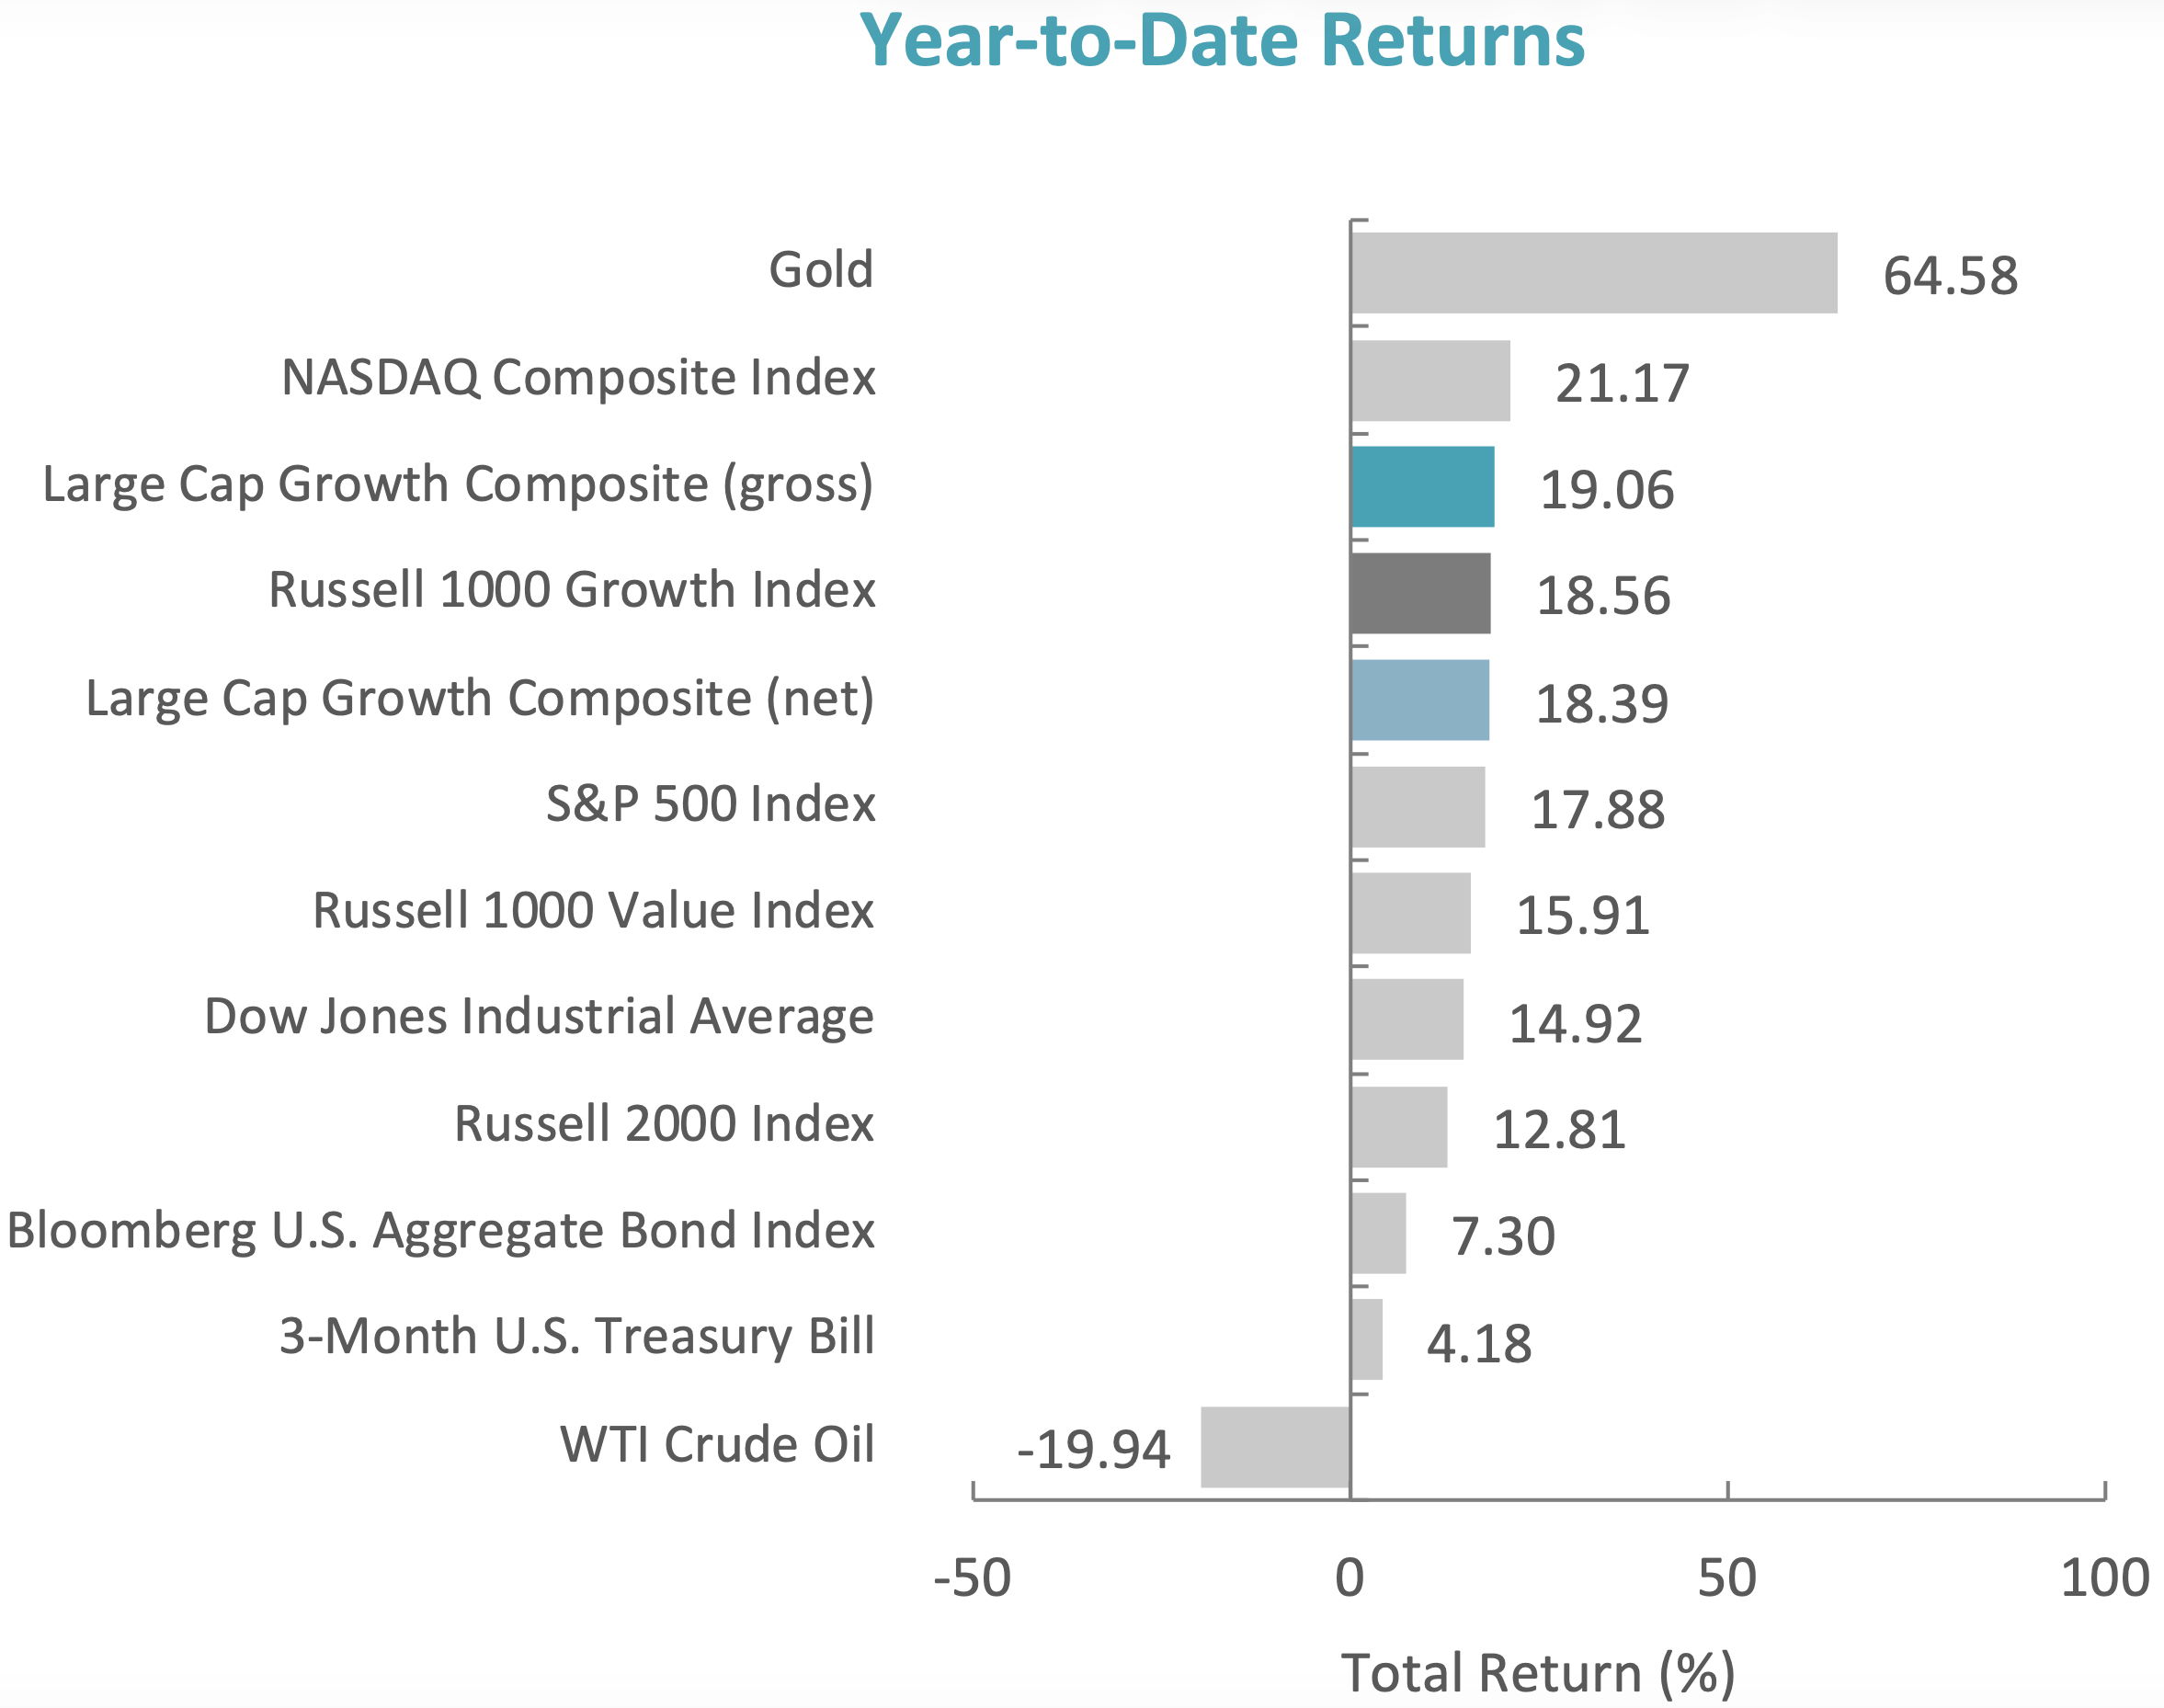
Global equity markets posted strong gains in the fourth quarter. The MSCI ACWI Index returned 3.29%, while bonds advanced in tandem (the Bloomberg Global Aggregate Bond Index increased 0.24%). Value stocks outperformed growth during the quarter, with the MSCI ACWI Value Index exceeding the MSCI ACWI Growth Index by 0.82%.
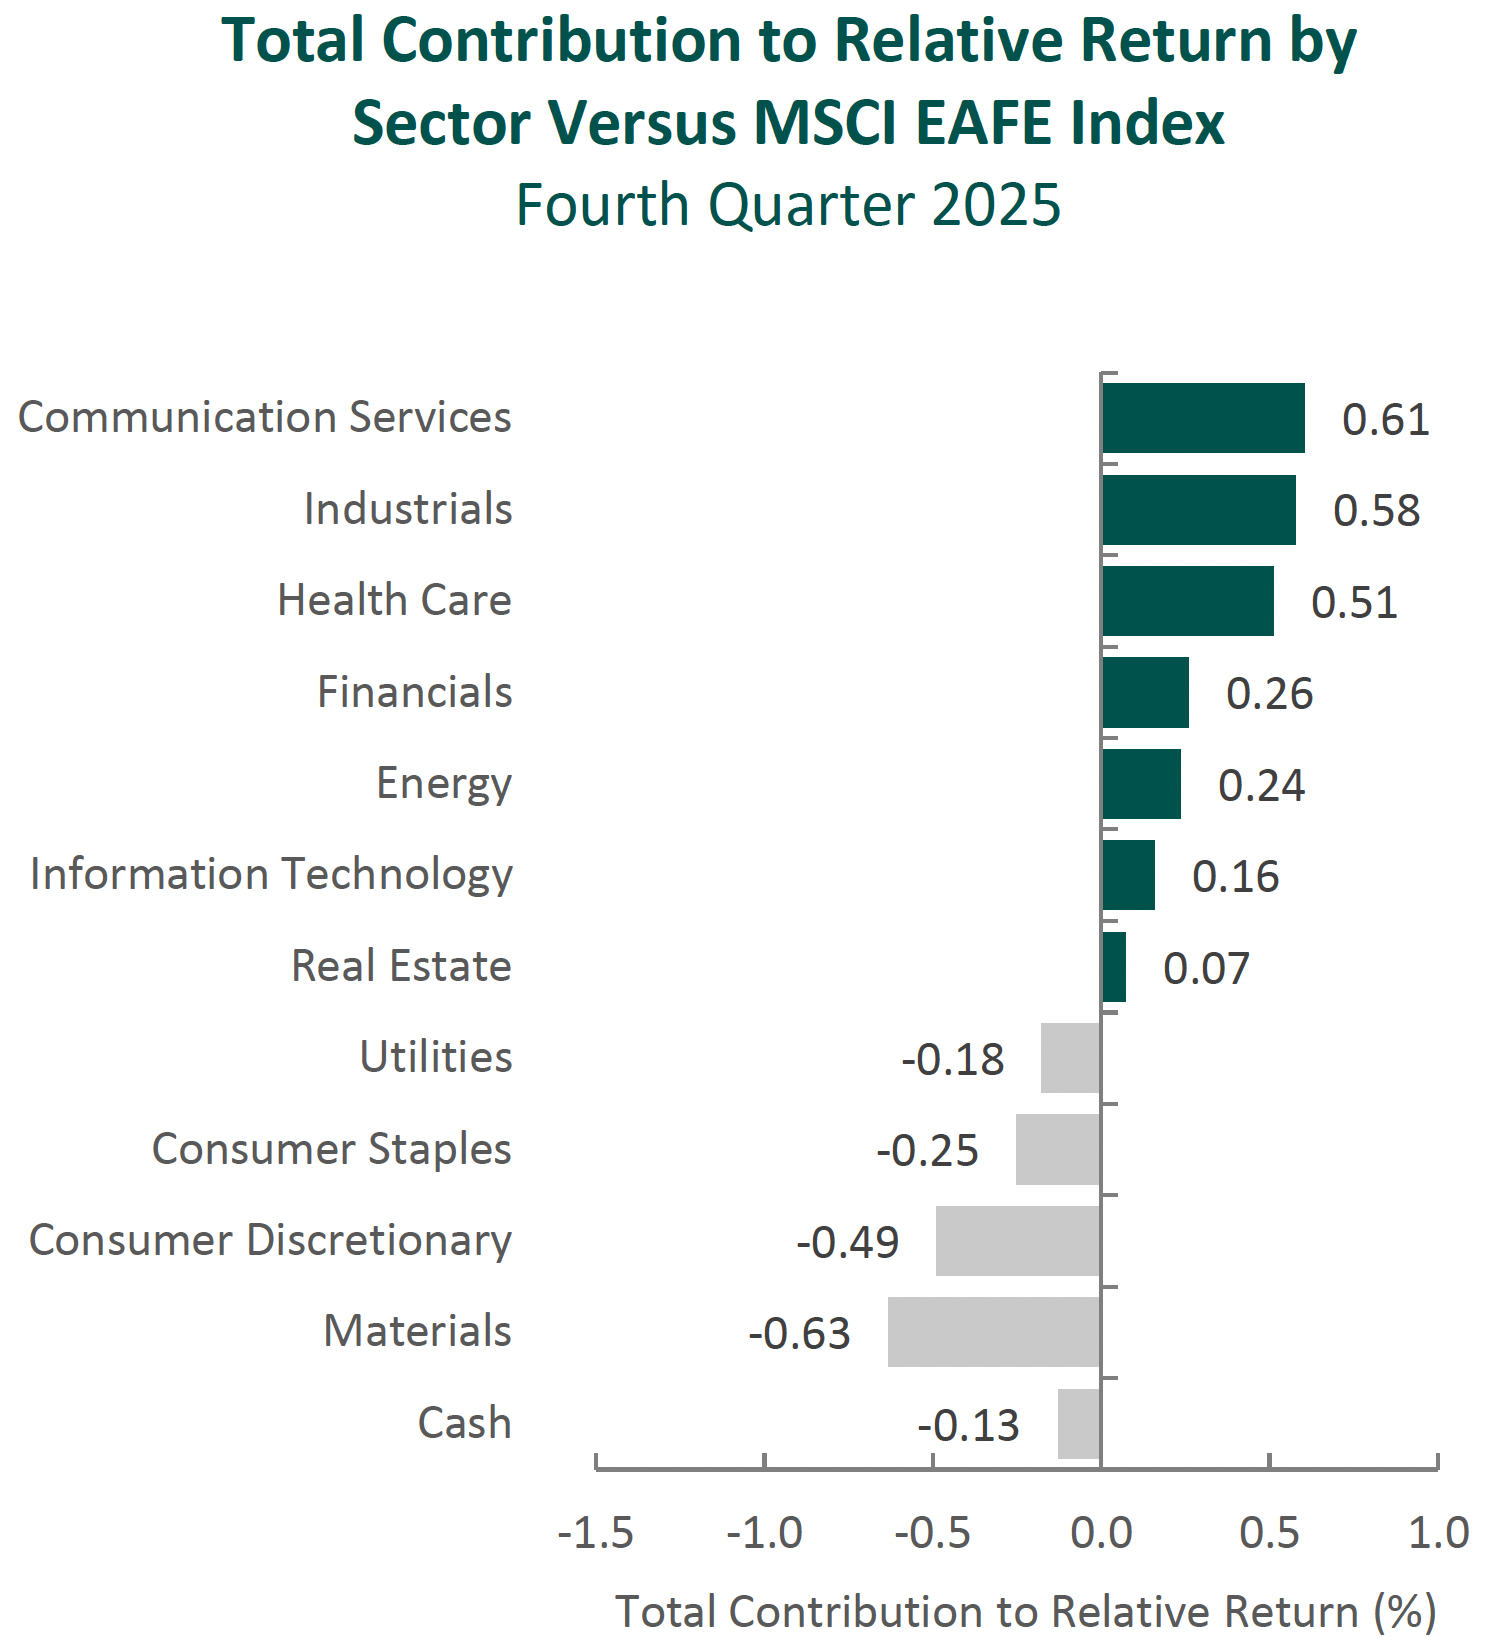
Outside the U.S., international equities delivered solid gains relative to their U.S. counterparts. The MSCI EAFE Index gained 4.86% for the quarter, while the MSCI ACWI ex USA Index returned 5.05%. Within the MSCI EAFE Index, the U.K. and Europe & Middle East were the strongest-performing markets, while Asia posted the weakest returns. From a sector perspective, ten out of the eleven sectors within the MSCI EAFE Index delivered positive returns, led by Utilities, Health Care and Financials. Conversely, Communication Services, Real Estate and Consumer Discretionary were the worst-performing sectors. In contrast to the U.S., where value stocks outperformed growth stocks for the quarter but lagged for the year, international value stocks led in both periods.
On the whole, the macroeconomic outlook continued to gradually improve in late 2025. The IMF modestly upgraded its 2025 forecast for global GDP growth to 3.2%, citing resilience in many economies. However, growth is expected to decelerate in 2026 as the world economy adjusts to the cumulative impact of new policies (such as higher tariffs and industrial policies) and as one-off boosts fade. Temporary factors that propped up activity in 2025—for example, the front-loading of imports to get ahead of tariff changes and the reconfiguration of supply chains—are likely to wane. The IMF also warned that near-term risks are tilted to the downside. Key concerns include the sustainability of the AI-driven boom (fears of a potential bubble or abrupt repricing), persistent economic struggles in China, and increased fiscal vulnerabilities in many countries (which could pressure central banks). Policymakers have been urged to shore up confidence with credible, transparent strategies, such as rebuilding fiscal buffers and preserving central bank independence.
Global inflation rates were mixed across regions but generally showed signs of easing. In the U.K., inflation unexpectedly eased to an eight-month low of 3.2%, but the unemployment rate rose to a four-year high and private-sector wage growth fell to a five-year low. As U.K. macro indicators weakened, the Bank of England cut its policy rate by 0.25% to 3.75%. In contrast, the European Central Bank left policy rates unchanged for the fourth consecutive meeting, as inflation remained near its 2% target and underlying growth proved resilient. Specifically, Germany finally showed signs of stabilization, with industrial production rising for two consecutive months (September and October), following GDP growth of 0.3% year-over-year in the third quarter. Even politically embattled France, whose Prime Minister Lecornu briefly resigned during the quarter, exceeded expectations and reported 0.9% annual growth.
In Asia, the quarter’s news cycle was dominated by the U.S.-China trade saga and evolving security postures. While tensions escalated early in the quarter, the two countries reached a one-year trade truce following a meeting between Presidents Trump and Xi at the Asia-Pacific Economic Cooperation (APEC) summit in South Korea. Under the agreement, China’s effective tariff rate declined to 47%, and export controls on critical rare earth materials were deferred. The timing may prove important, as China continues to contend with persistent deflationary pressures, declining fixed-asset investment and weak retail sales ahead of the implementation of its next Five-Year Plan in 2026. However, while relations with the U.S. improved, China’s relationship with Japan became strained after Japan’s first female prime minister, Sanae Takaichi, stated that Japan would militarily intervene if Beijing used force against Taiwan. Chinese officials warned that the comments had “severely damaged” trade cooperation, raising the risk of economic repercussions. These tensions emerged just as Japan reported its first economic contraction in six quarters. In response, Japan finalized a ¥21.3 trillion stimulus package; meanwhile, the Bank of Japan raised its policy rate to 0.75%, the highest level in three decades.
Beyond U.S.-China and Japan-China tensions, other geopolitical issues were in focus. In Europe, hopes rose for a resolution in Ukraine as diplomatic efforts intensified (with direct U.S. involvement in talks). In the Middle East, the Israel-Hamas ceasefire brokered by the U.S. in October largely held, allowing the release of all surviving Israeli hostages, an increase in humanitarian aid into Gaza and a lull in hostilities. Yet new flashpoints emerged in the Western Hemisphere: the U.S.-Venezuela confrontation escalated when the U.S. conducted a drone strike on a Venezuelan port used by cartels. While this action raised concerns about a broader conflict, analysts noted it could also embolden China in its territorial posturing (citing that U.S. actions set precedents, even though an analog in Taiwan is still seen as unlikely in the near term). In summary, by the end of 2025, many geopolitical conflicts that had unsettled markets earlier in the year showed tentative progress or containment, while new uncertainties arose that will carry into 2026.
Annual Markets Review
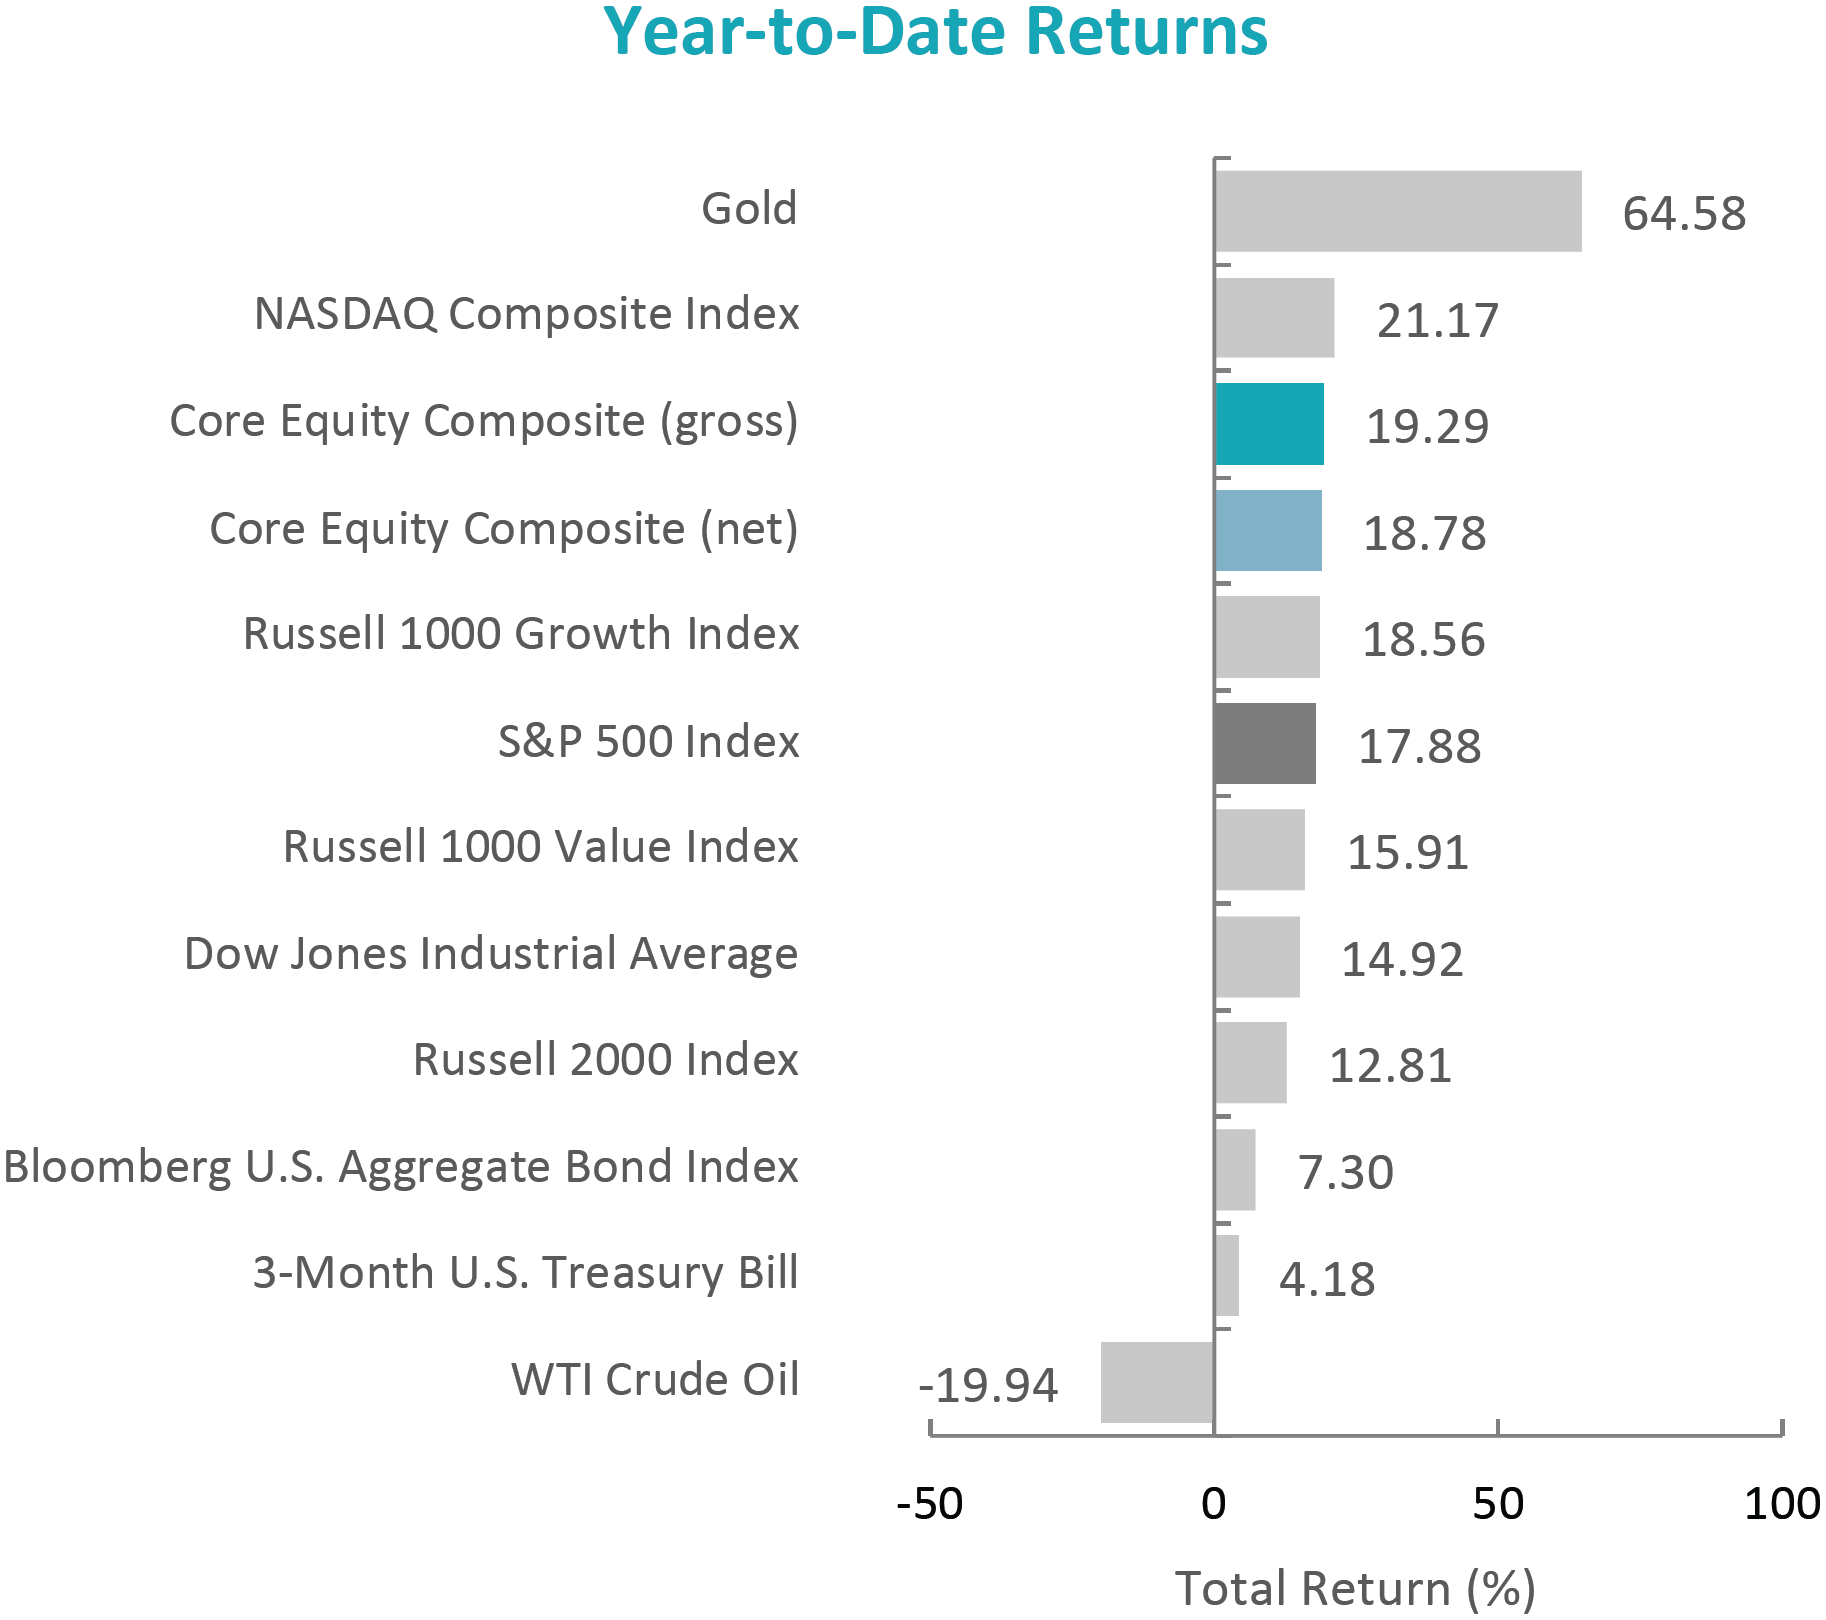
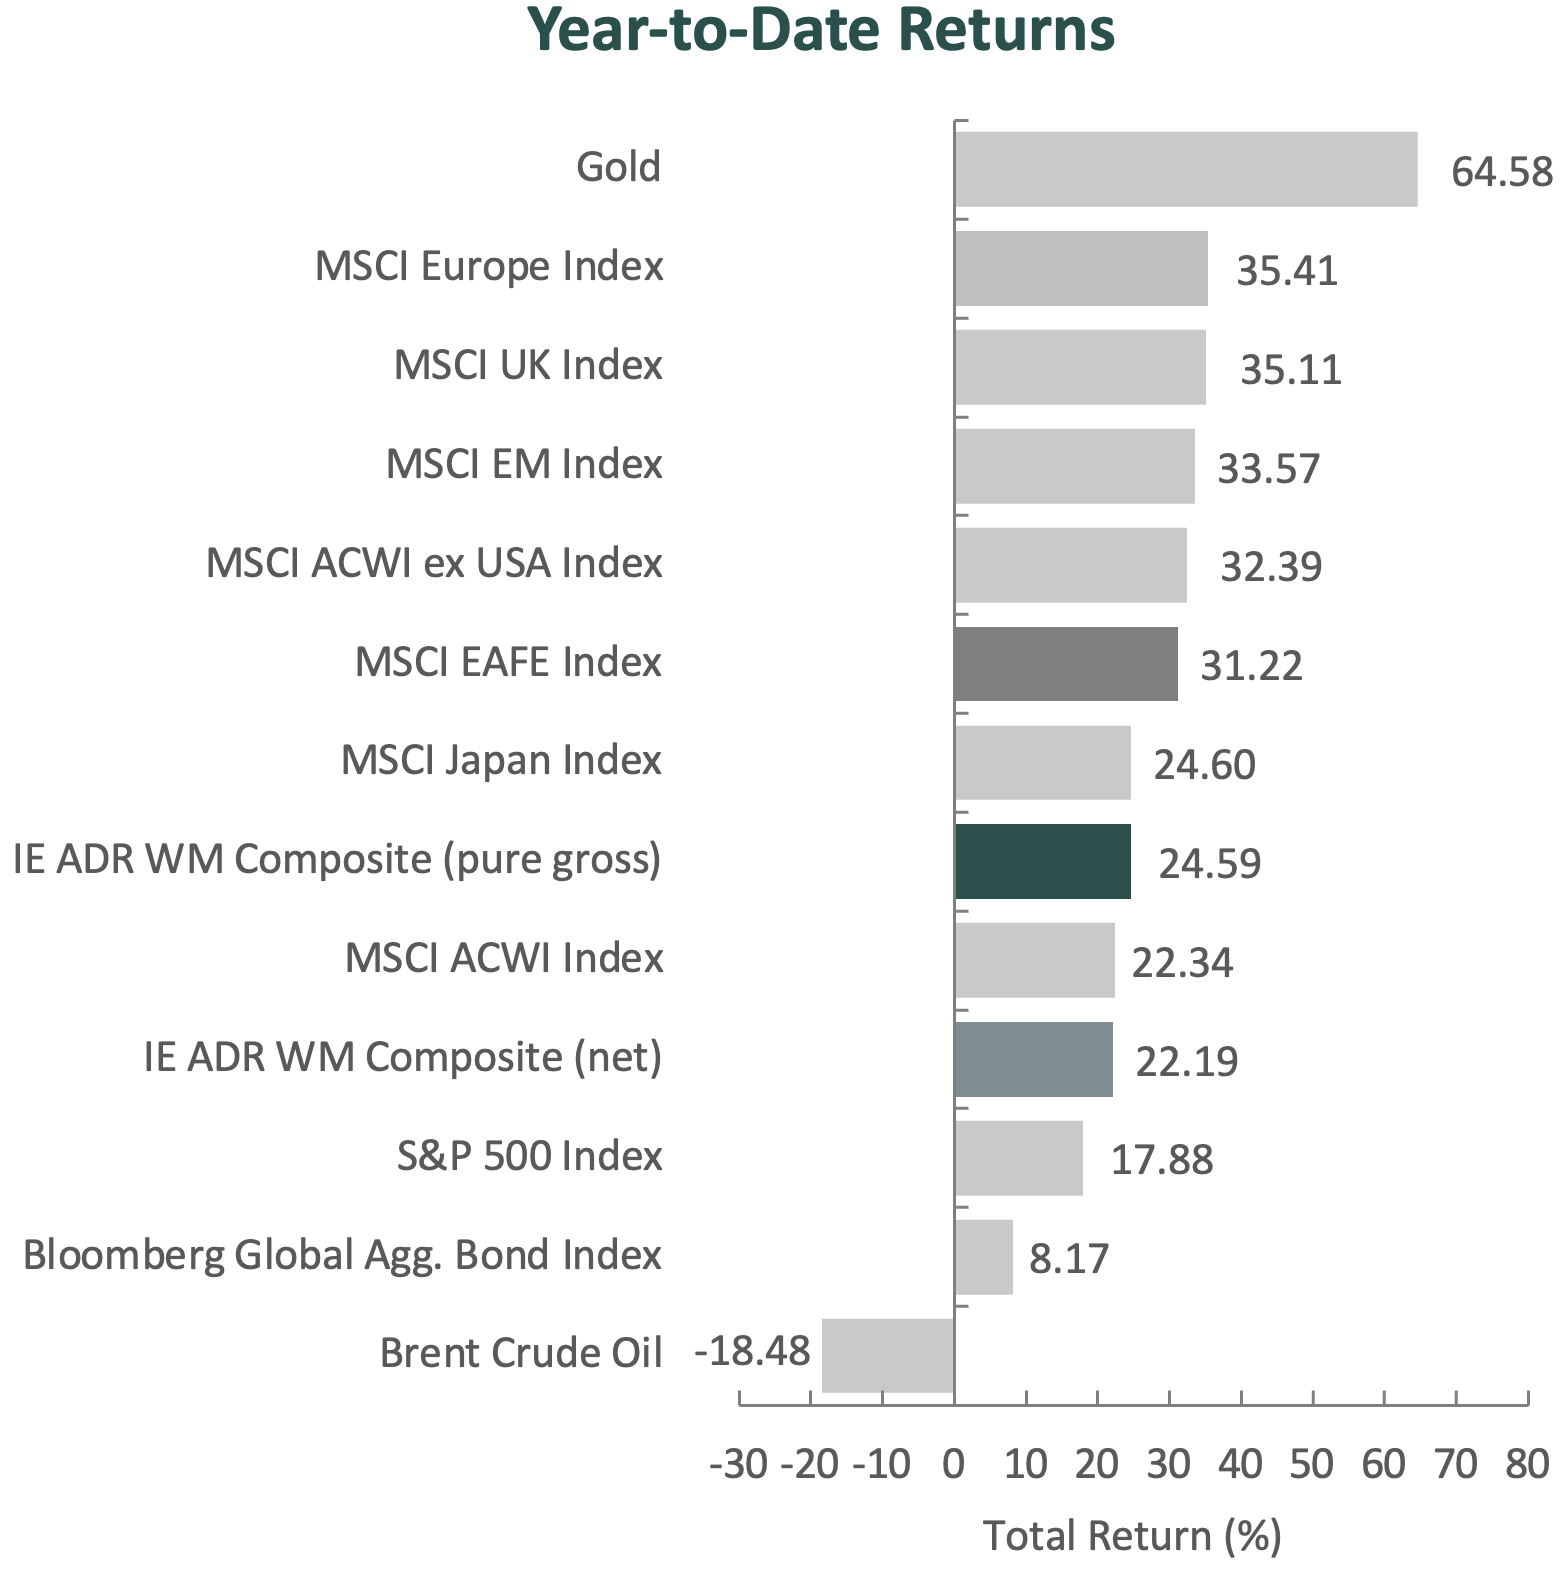
Global equity markets continued their upward trajectory in 2025, with the MSCI ACWI delivering a full-year return of 22.34%. Growth stocks outperformed value during the year, as the MSCI ACWI Growth Index exceeded the MSCI ACWI Value Index by 0.46%. Meanwhile, fixed income markets rallied, as the Bloomberg Global Aggregate Bond Index advanced 8.17%.
As markets digested new trade agreements, economic data and policy decisions by central banks, 2025 proved to be a resilient year for risk assets. However, even strong markets presented their own set of challenges. Factors such as momentum and volatility outperformed quality, and while economic indicators and corporate earnings were broadly supportive, central banks and corporate management teams struck a more cautious tone heading into 2026.
Given the risks and uncertainties surrounding macroeconomic conditions and market narratives, we believe it remains prudent to focus on individual businesses and their long-term fundamentals. By concentrating on what is analyzable, we believe our approach is well suited to navigating a range of market environments while remaining disciplined through full market cycles.
Performance and Attribution Summary
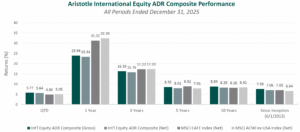
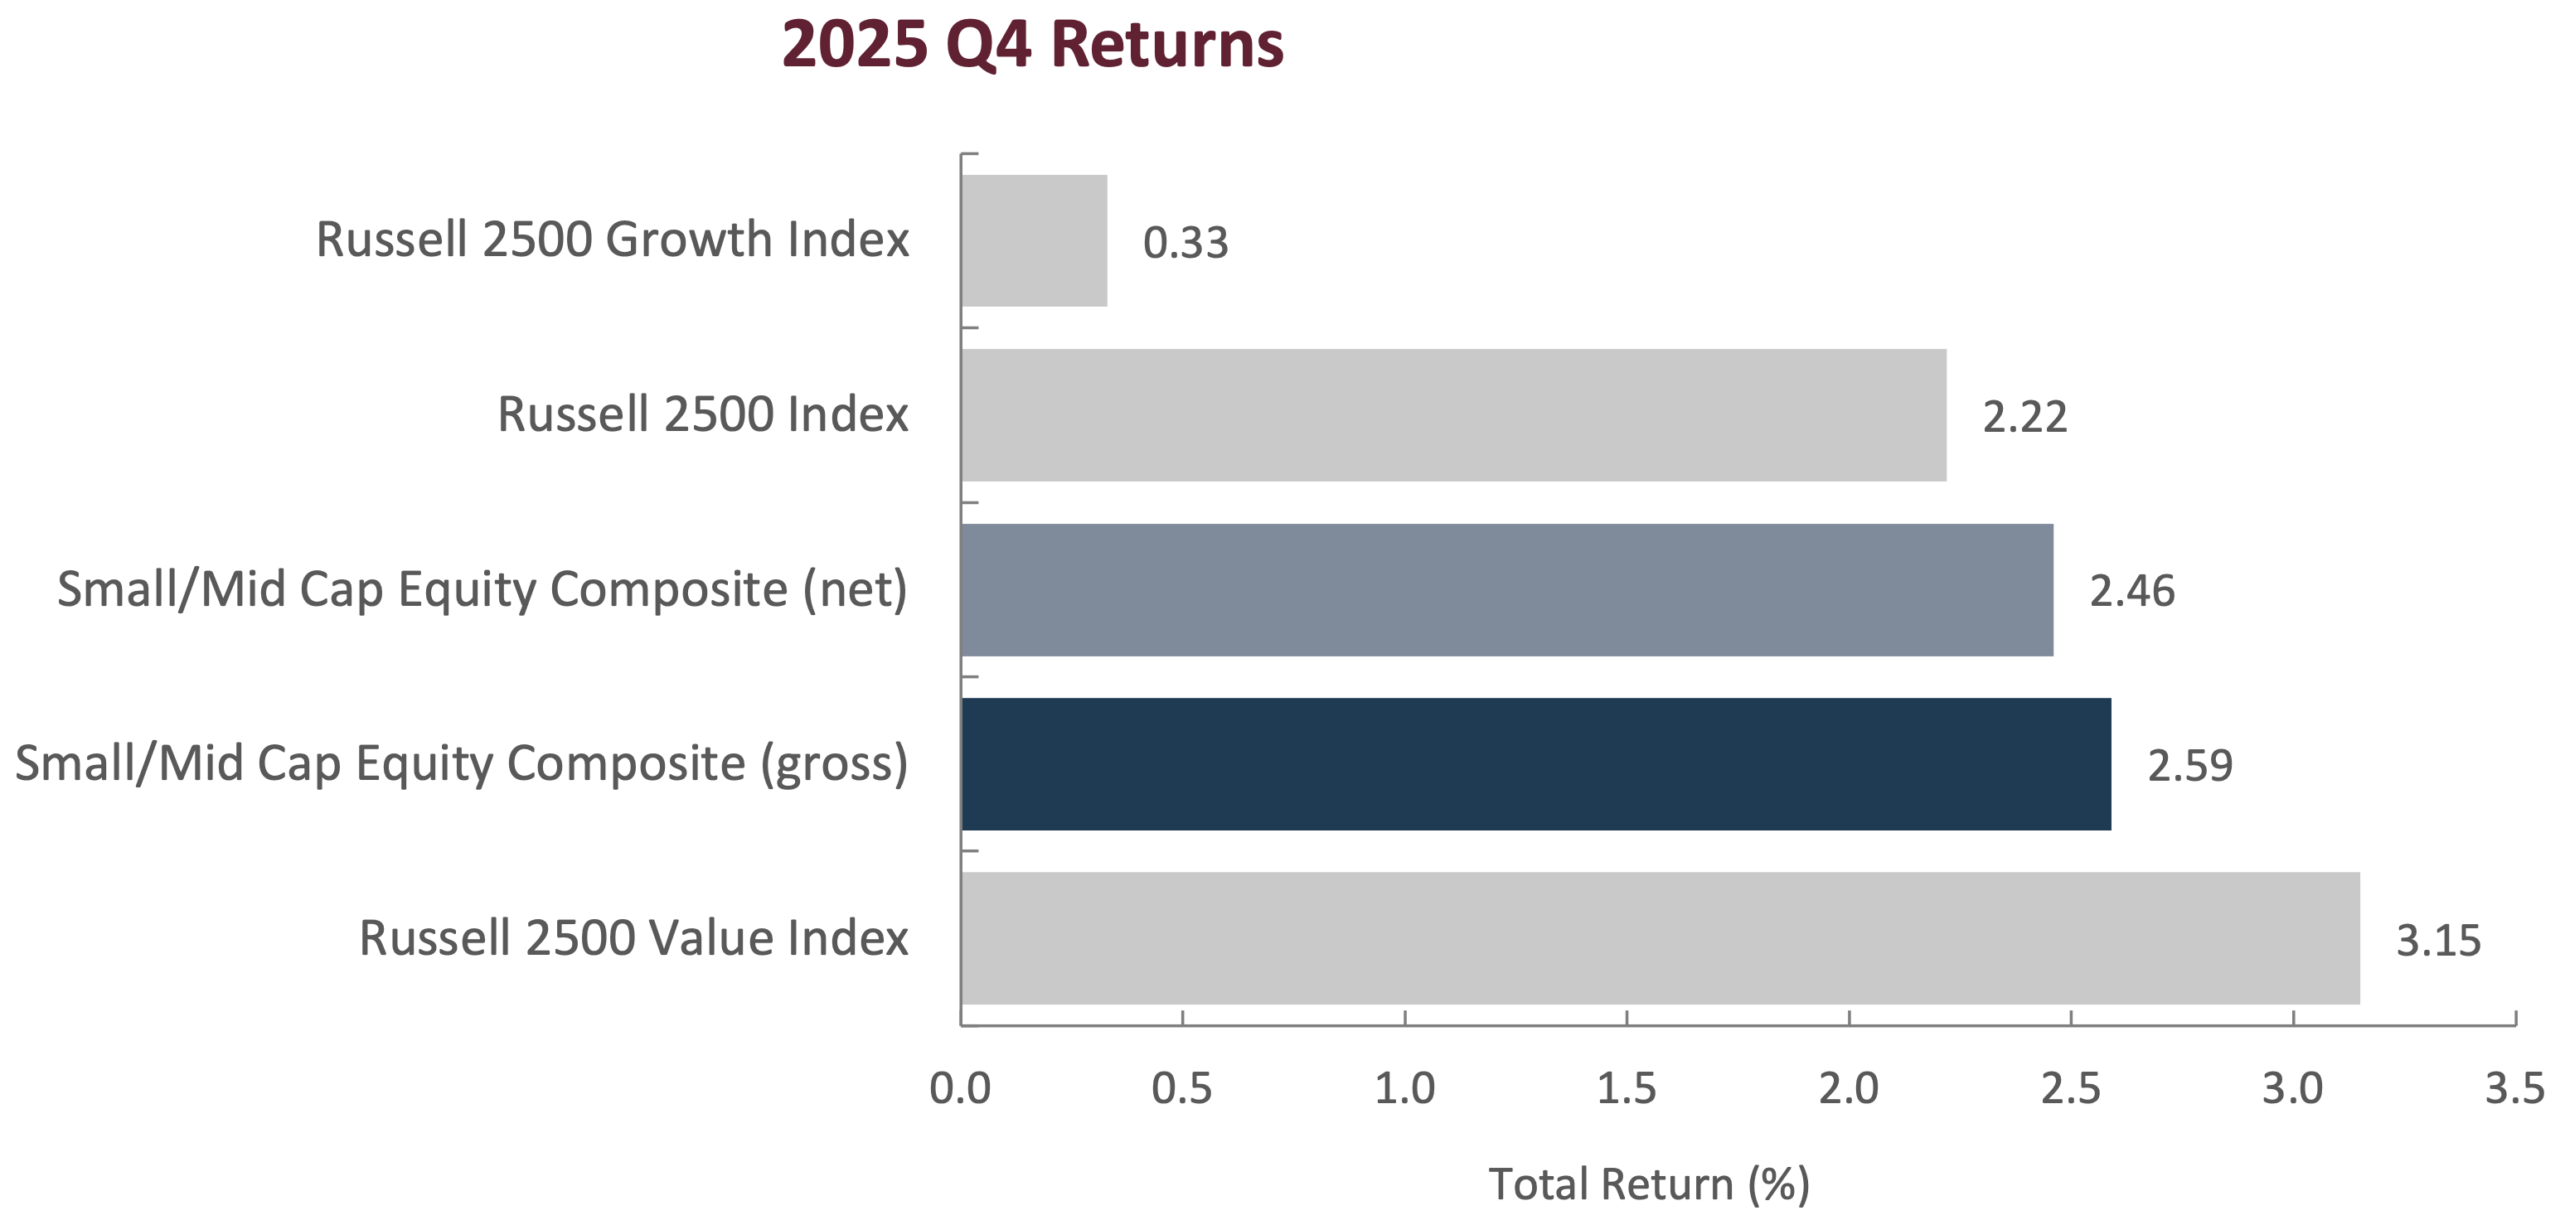
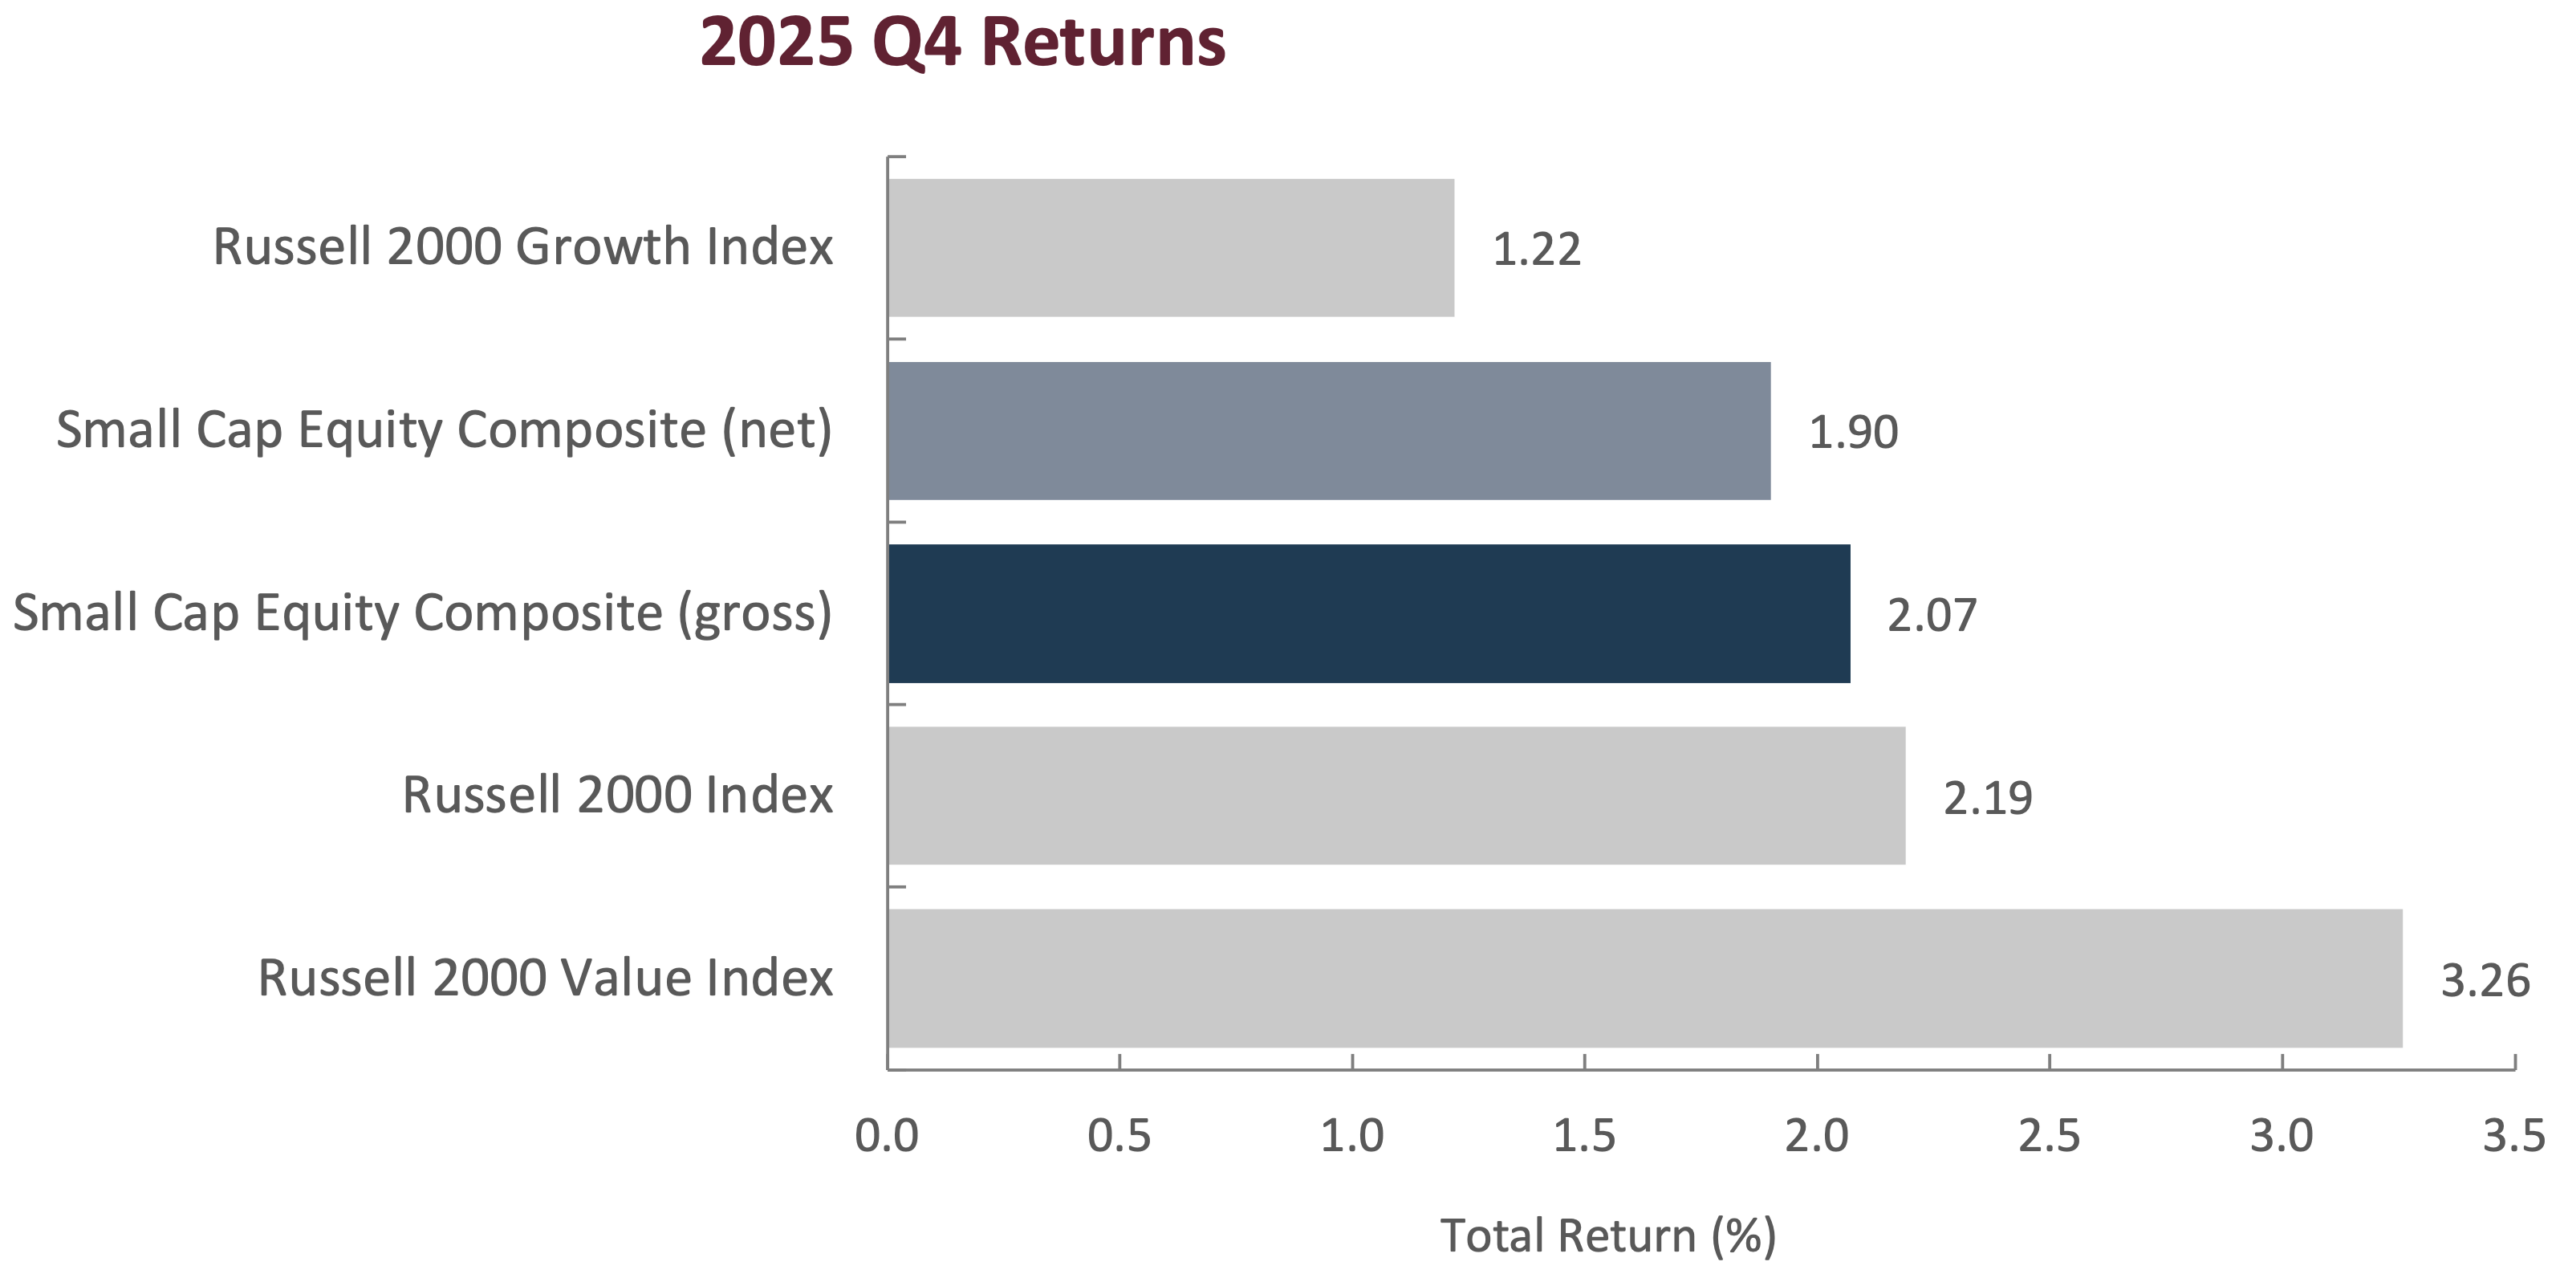
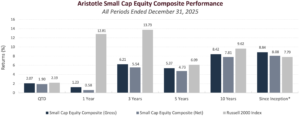
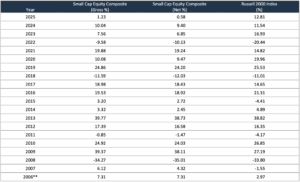
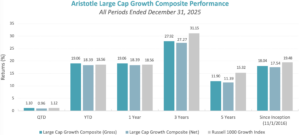
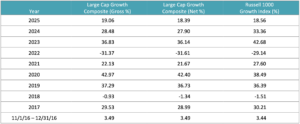
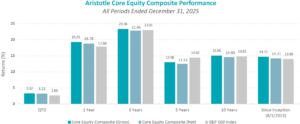
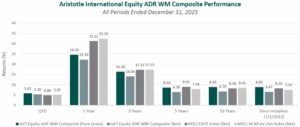
For the fourth quarter of 2025, Aristotle Capital’s International Equity ADR WM Composite posted a total return of 5.81% pure gross of fees (5.30% net of fees), outperforming the MSCI EAFE Index, which returned 4.86%, and the MSCI ACWI ex USA Index, which returned 5.05%. Please refer to the table below for detailed performance.
| Performance (%) | 4Q25 | 1 Year | 3 Years | 5 Years | 10 Years | Since Inception* |
|---|---|---|---|---|---|---|
| International Equity ADR WM Composite (pure gross) | 5.81 | 24.59 | 16.30 | 8.54 | 8.85 | 8.82 |
| International Equity ADR WM Composite (net) | 5.30 | 22.19 | 14.04 | 6.39 | 6.70 | 6.47 |
| MSCI EAFE Index (net) | 4.86 | 31.22 | 17.22 | 8.92 | 8.18 | 8.20 |
| MSCI ACWI ex USA Index (net) | 5.05 | 32.39 | 17.33 | 7.91 | 8.41 | 7.53 |
Source: FactSet
Past performance is not indicative of future results. Sector attribution shows how much of a portfolio’s overall return is directly attributable to stock selection and asset allocation decisions within the portfolio, highlighting which sectors contributed or detracted to the total return. Attribution includes the reinvestment of income. Attribution is presented gross of fees and does not include the deduction of all fees and expenses that a client or investor has paid or would have paid. Please refer to the gross and net composite returns included within to understand the overall impact of fees.
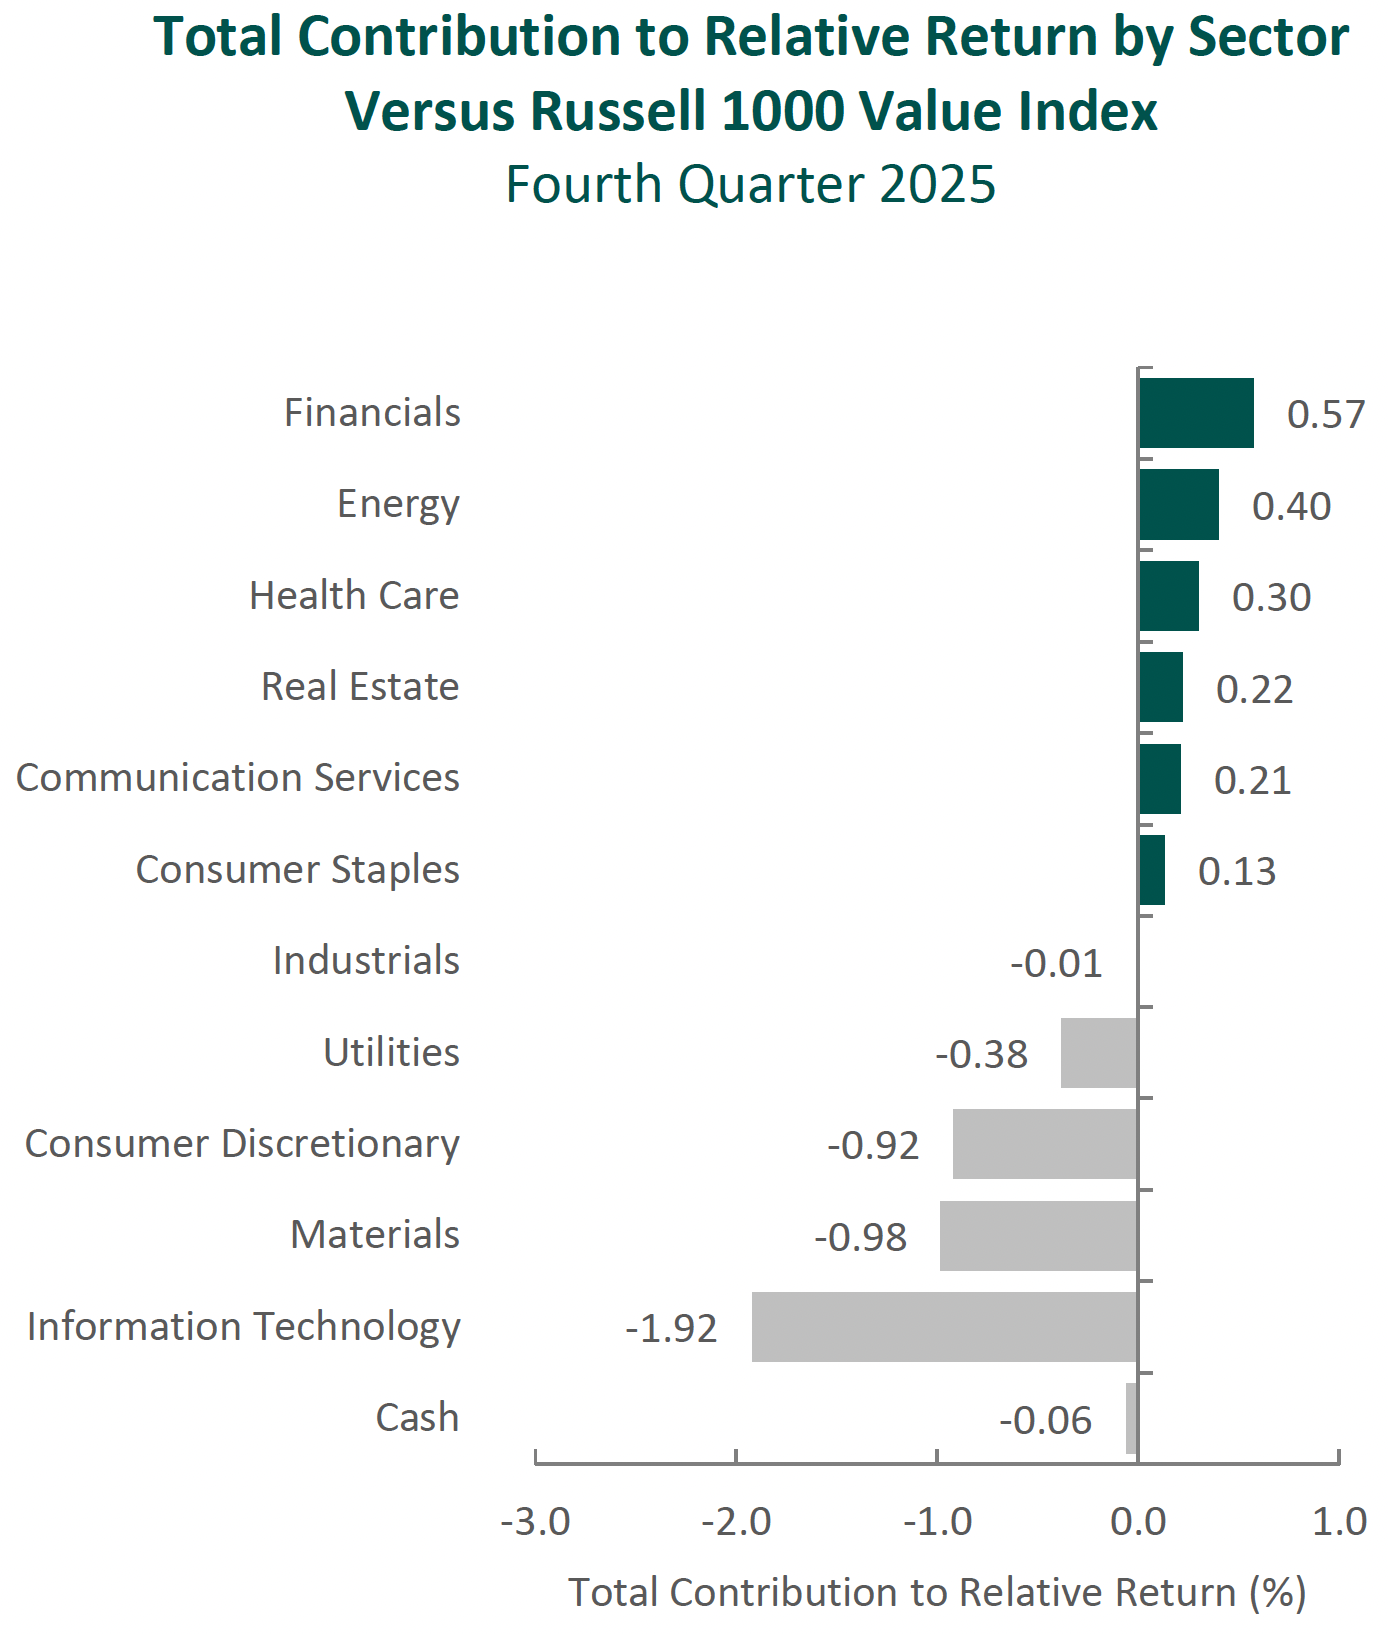
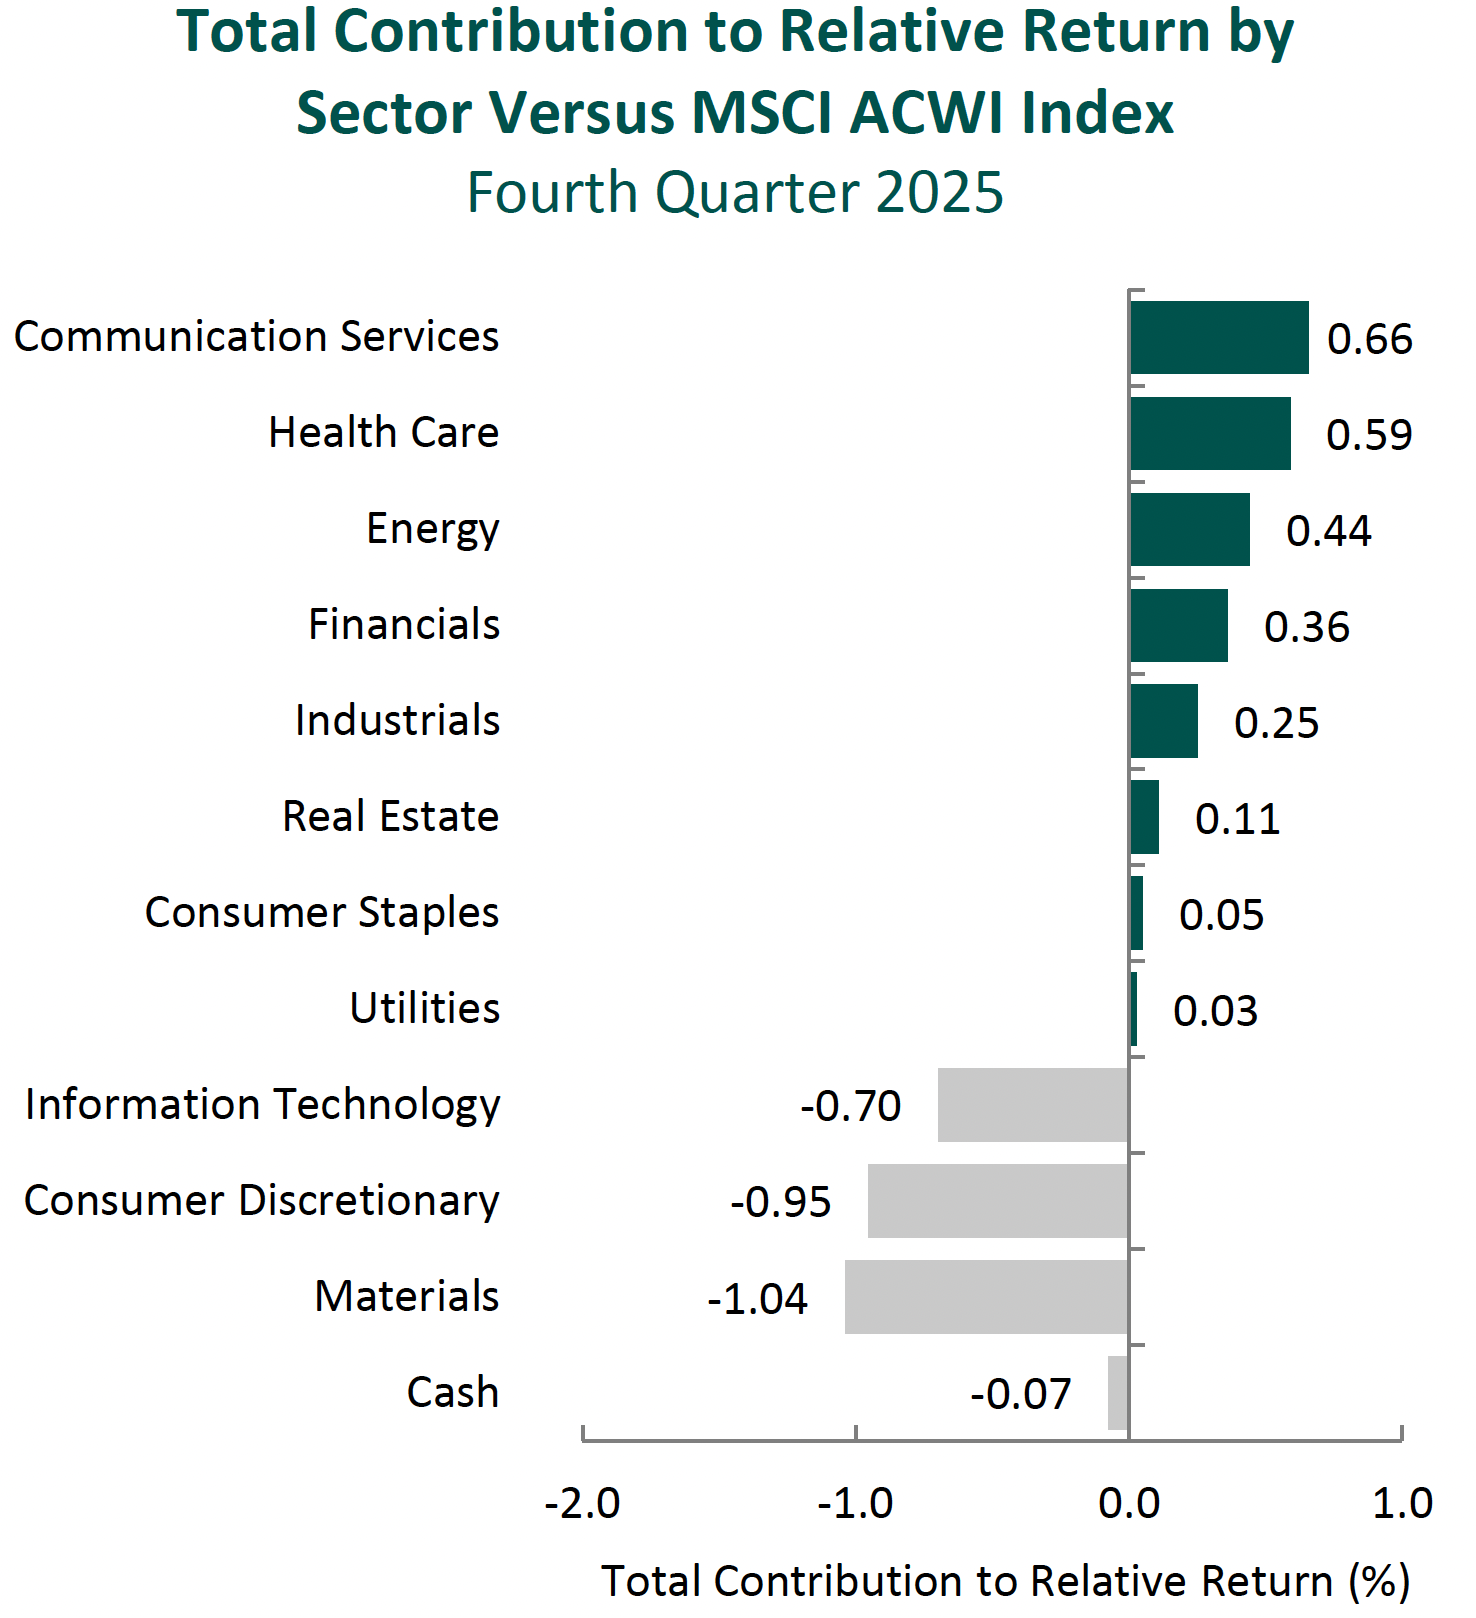
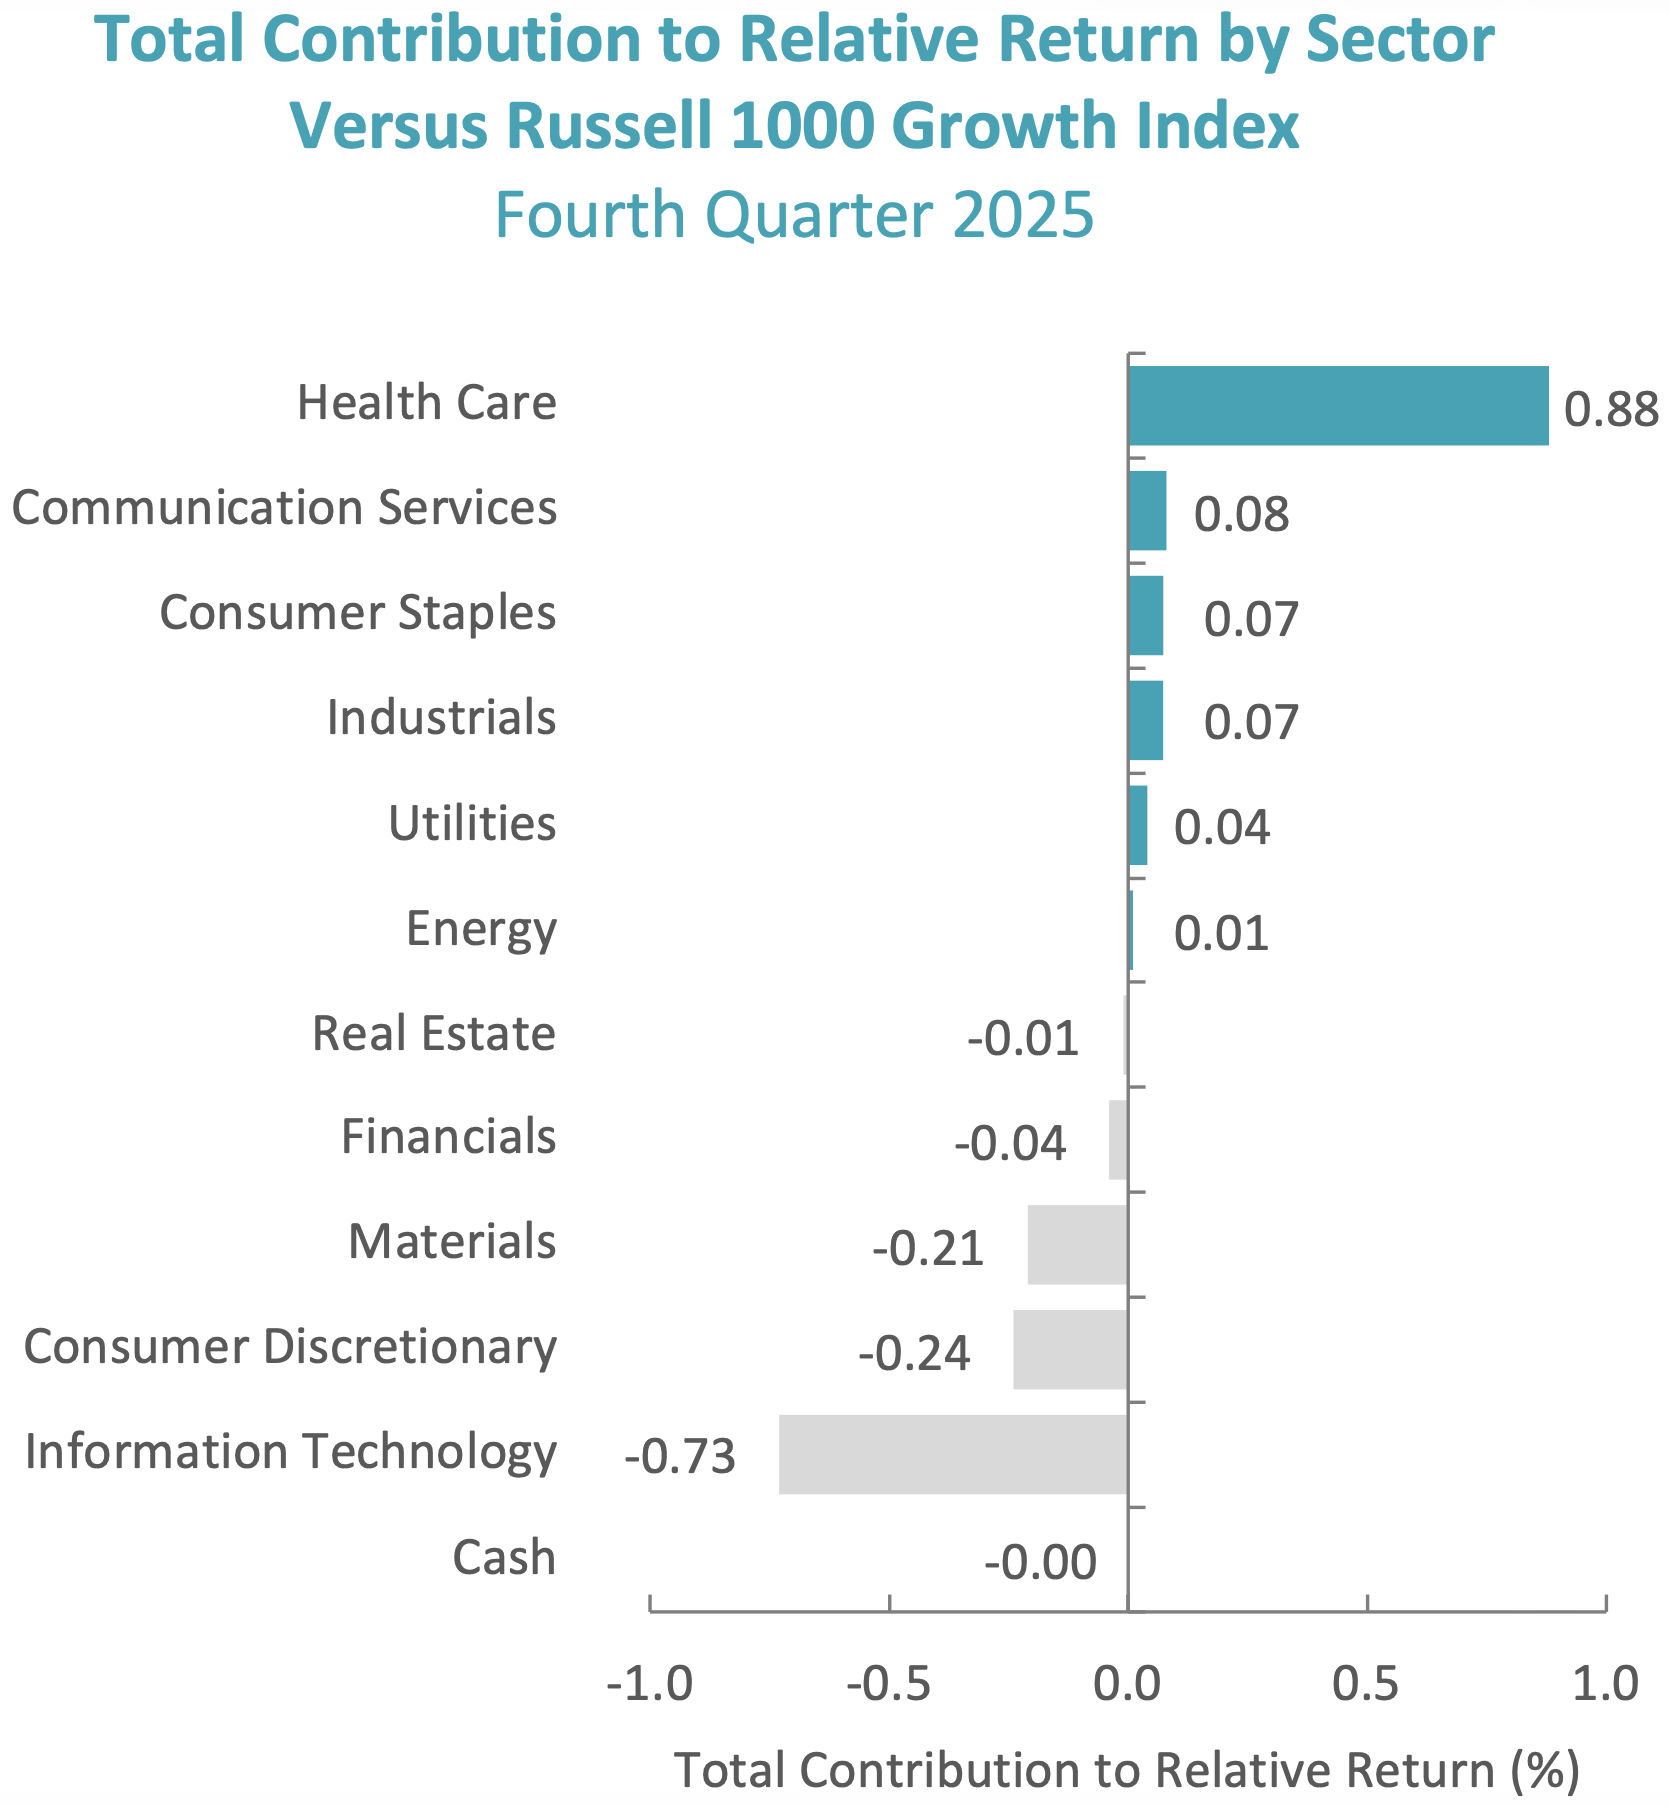
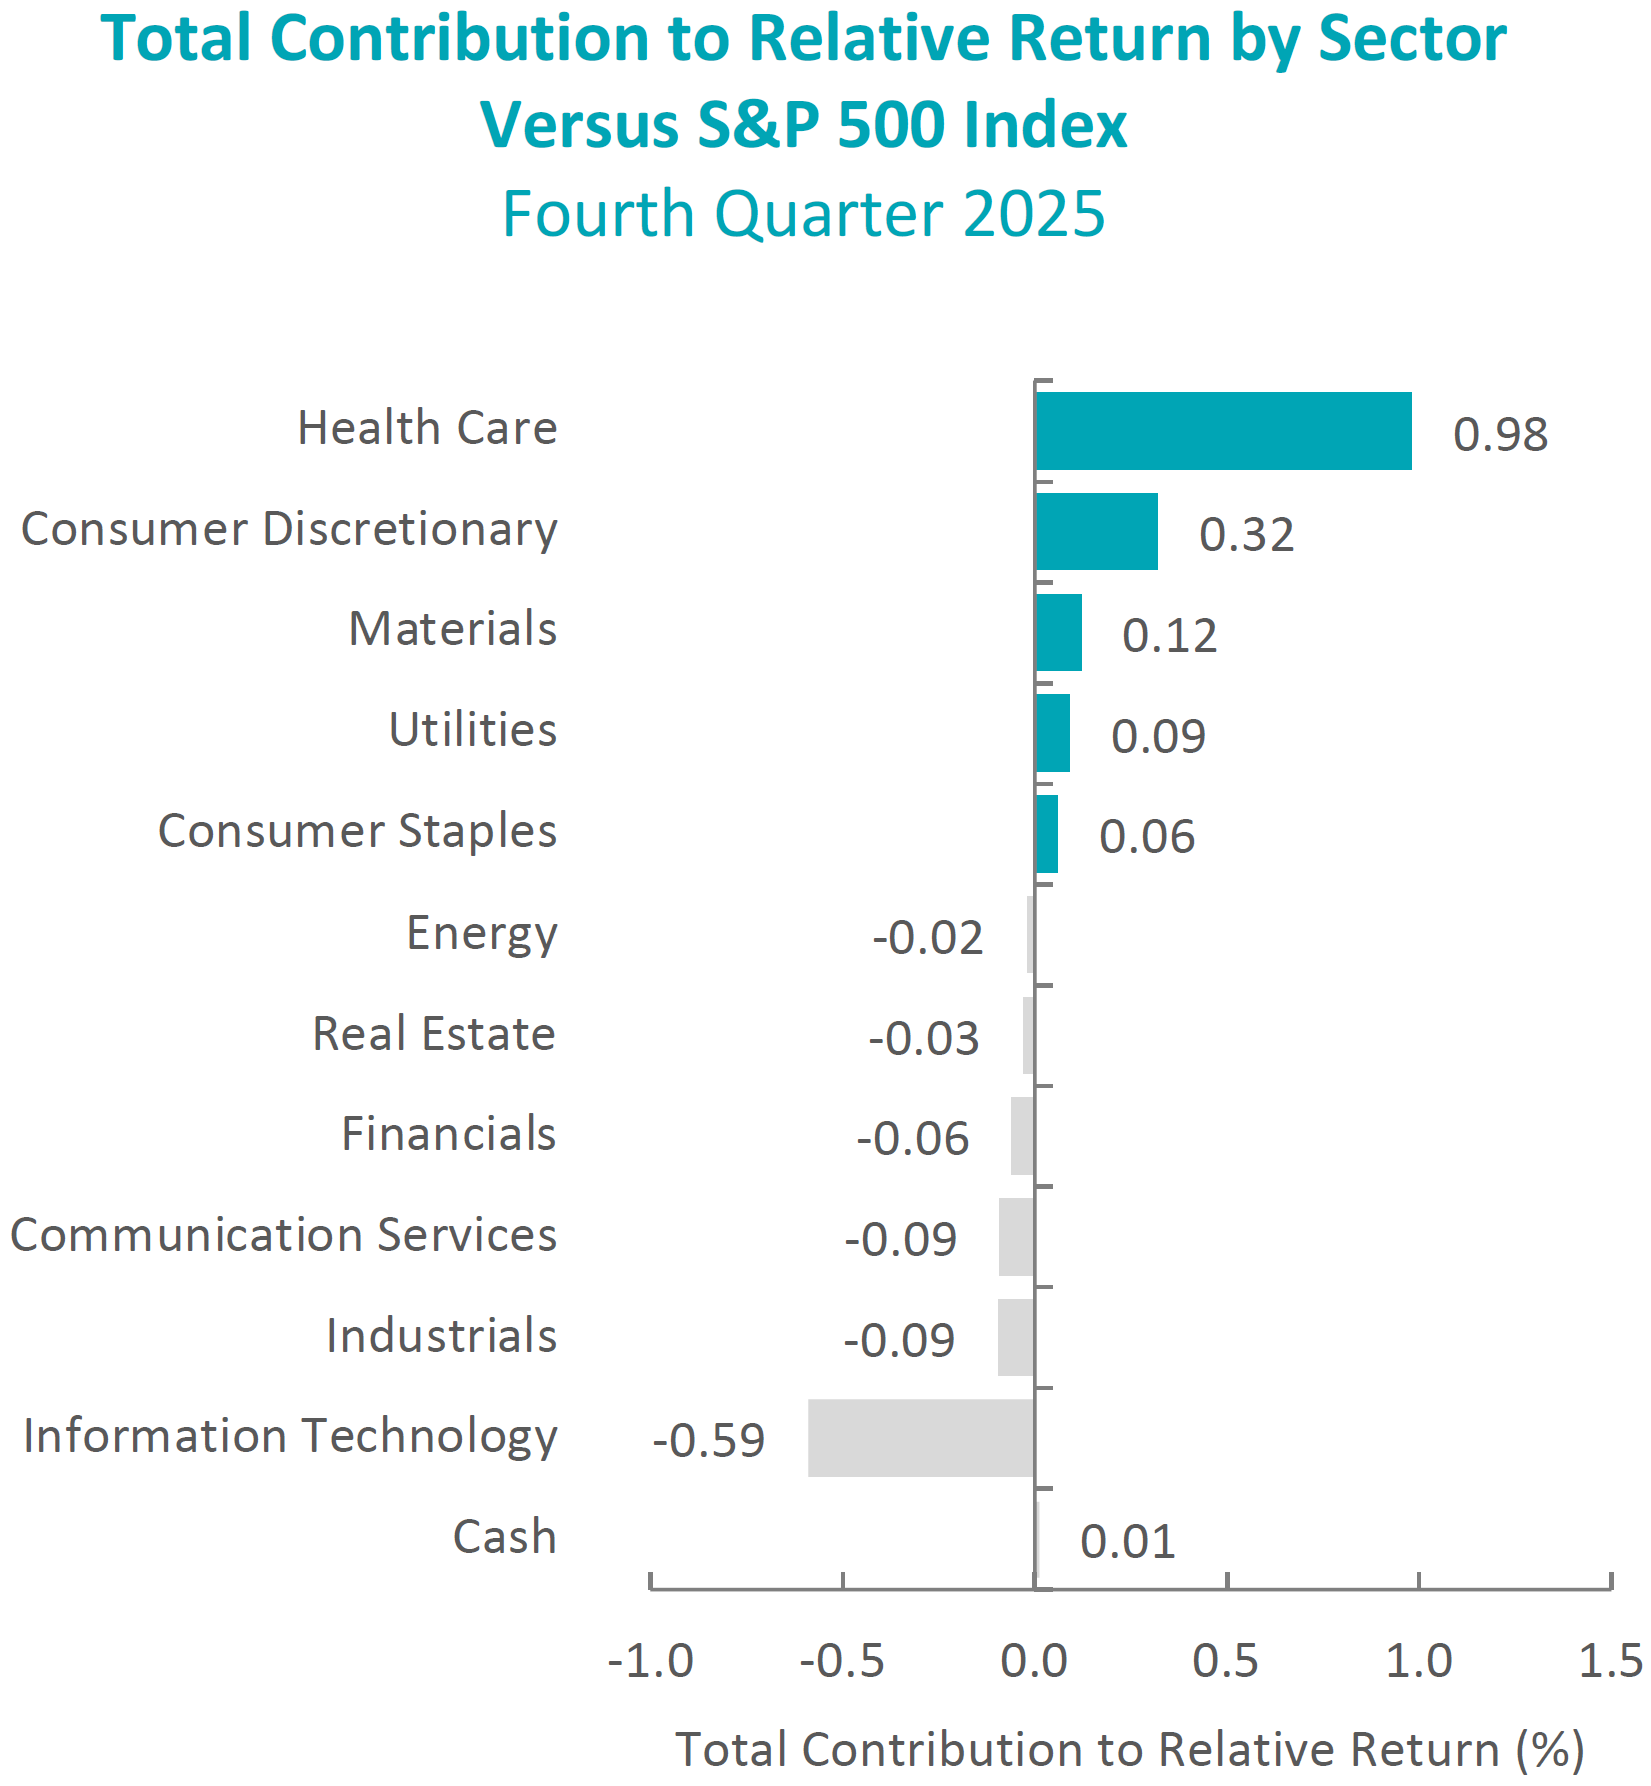
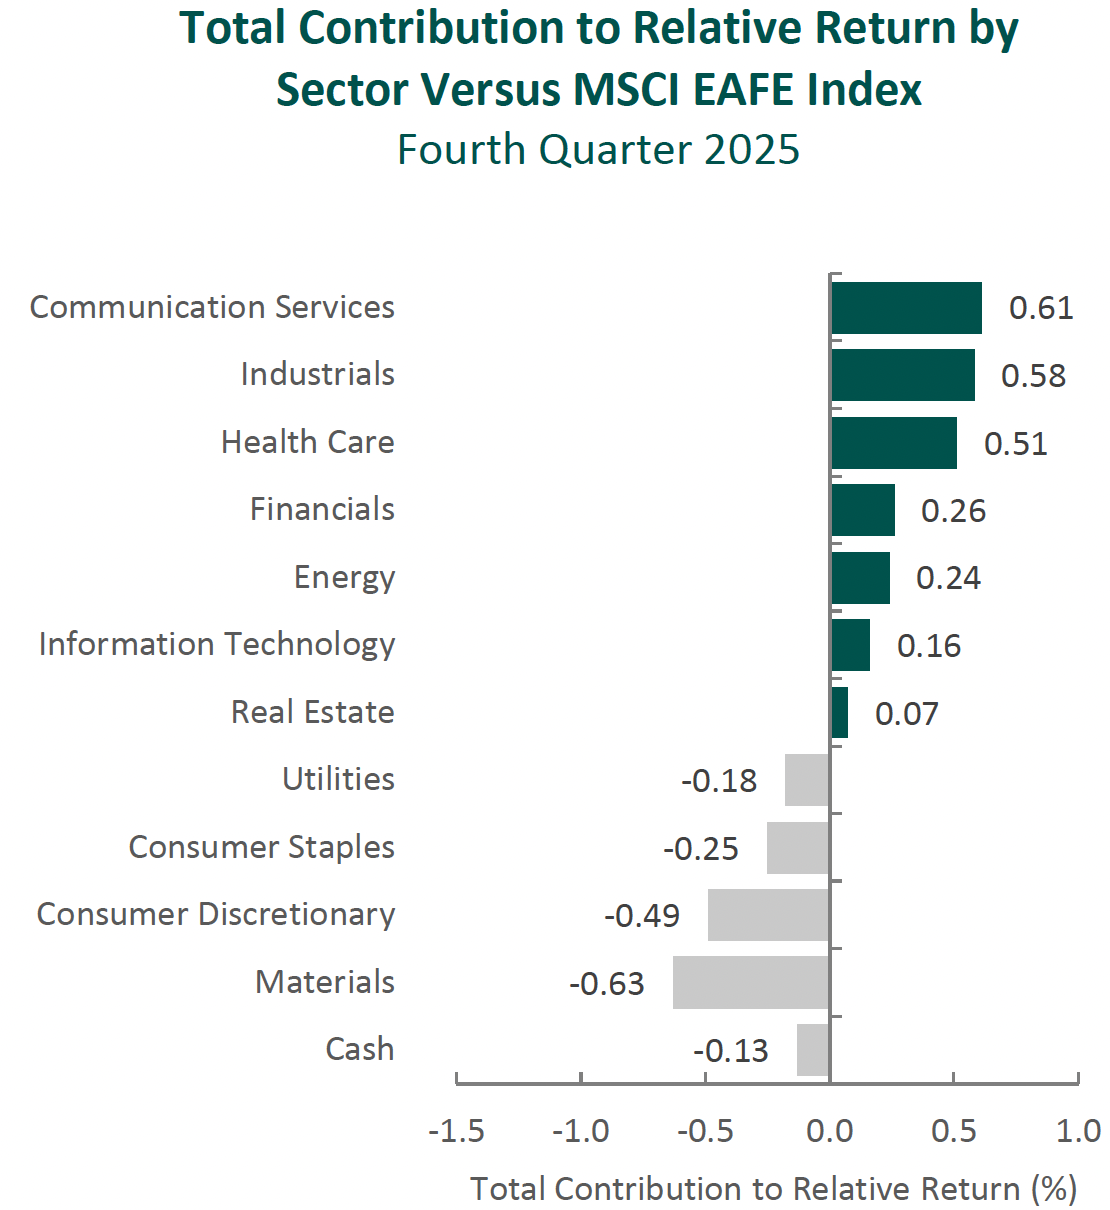
From a sector perspective, the portfolio’s outperformance relative to the MSCI EAFE Index can be attributed to both security selection and allocation effects. A lack of exposure to Communication Services, as well as security selection in Industrials and Health Care, contributed most to the portfolio’s relative performance. Conversely, security selection in Materials, Consumer Discretionary and Consumer Staples detracted from relative returns.
Regionally, both security selection and allocation effects were responsible for the portfolio’s outperformance. Security selection and an underweight to Asia contributed the most to relative performance, while an underweight to Europe & Middle East and security selection in the UK detracted.
Contributors and Detractors for 4Q 2025
| Relative Contributors | Relative Detractors |
|---|---|
| Erste Group Bank | Pan Pacific International |
| FANUC | Sony |
| Fast Retailing | Experian |
| Roche | Safran |
| DBS Group | Michelin |
Erste Group Bank, a leading retail and commercial bank in Central and Eastern Europe, was the top contributor during the quarter. The company reported strong operating performance, driven by healthy loan growth across core markets, resilient net interest income and solid fee income, with contributions from securities, asset management and payments. Its diversified, retail-oriented banking model, leading market positions across core geographies and strong deposit franchise anchored in household customers continue to support the business. During the quarter, Erste cleared key milestones related to its previously announced acquisition of a 49% stake in Santander Bank Polska. With regulatory conditions satisfied late in the quarter, the transaction is expected to close in early 2026. We view this transaction as strategically attractive, expanding Erste’s footprint into Poland, one of the region’s largest and most dynamic banking markets, while enhancing scale and diversification. More broadly, Erste’s exposure to underbanked Central and Eastern European economies positions the company to benefit as incomes rise and demand for credit, savings and financial services continues to grow. Ongoing investment in technology and digital capabilities supports efficiency, customer engagement and long-term profitability.
FANUC, the Japanese leader in factory automation and industrial robotics, was a top contributor during the quarter. The company operates across factory automation systems, industrial robots and precision machining centers, serving automotive, electronics and general industrial end markets. Results through the first half of fiscal year 2025 marked a clear inflection, with operating margin expanding to 21% as factory utilization and pricing discipline held firm. Performance was further supported by a sharp rebound in China, where robot sales grew over 80% year-over-year, more than offsetting softer demand in Europe and Japan. Beyond the cyclical recovery, FANUC continues to deepen its competitive advantages. Its dominant position in computer numerical control (CNC) systems, the “brains” of machine tools, underpins a large and highly sticky installed base. During the quarter, the company highlighted an increasingly open software strategy that allows third parties to develop applications directly on FANUC’s platform while maintaining safety and reliability at the controller level. This approach is reinforced by FANUC’s collaboration with NVIDIA, announced during the quarter and linking FANUC’s robot simulation tools with NVIDIA’s Omniverse software to enable highly accurate digital twins and accelerate deployment of AI-driven robotics. This leadership extends across its Robot and Robomachine segments, supported by an integrated hardware, software and service ecosystem that is difficult to replicate and highly valued in mission-critical applications. As global automation adoption accelerates amid labor shortages, rising wages and increasing manufacturing complexity, we believe FANUC is well-positioned to grow alongside its customers while sustaining attractive margins, supported by disciplined capital allocation and a growing mix of higher-margin service and software revenues.
Sony, the global leader in video games, image sensors, music and movies, was a primary detractor for the period. Shares declined following the recognition of a one-time, non-cash charge of approximately ¥50 billion in the Game & Network Services segment related to an impairment and accounting correction of previously capitalized development costs. Importantly, this charge was not recurring and did not reflect a deterioration in underlying operating performance. Excluding this item, operating income would have increased approximately 23% year-over-year, supported by healthy gaming engagement, continued growth in network services and software sales, and strong results in the Music segment driven by streaming growth and recent theatrical releases. The company’s image sensor business also benefited from a favorable product mix and steady end-market demand. Looking ahead, we continue to see opportunity for Sony to capitalize on its unique position as both a content creator and platform owner. The company’s ability to integrate gaming, music, anime and film—and to leverage IP across its ecosystem—supports sustained engagement and recurring revenue. In addition, the recent spinoff of Sony’s Financial Services segment further sharpens management’s focus on its core content, technology and entertainment operations. We believe Sony’s industry leadership and continued focus on operational execution position the company well for long-term value creation.
Experian, one of the world’s largest credit bureau companies, was a primary detractor during the quarter. Shares declined despite continued solid execution in the core business. Results in North America remained strong, with broad-based growth across financial services, consumer, automotive and health verticals, but performance in certain international markets, particularly Latin America, was constrained by high interest rates and elevated consumer indebtedness, which tempered near-term revenue growth expectations. We continue to view Experian as a uniquely advantaged big data and analytics business with a durable competitive position. The company maintains credit and identity data on approximately 1.5 billion consumers and about 200 million businesses globally, a depth and breadth that would be extremely difficult to replicate. This scale underpins powerful network effects, high switching costs and limited competition in its core markets. Importantly, the cost of Experian’s data is negligible relative to the financial risk it helps clients manage, supporting strong pricing power and resilient margins across credit cycles. Over our more than 15-year ownership period, Experian has consistently expanded beyond its traditional bureau roots by monetizing its proprietary datasets through software, analytics, fraud prevention and direct-to-consumer offerings. We believe the company will continue to benefit from rising penetration of its higher-value decisioning and analytics platforms, expanding consumer engagement, new monetization of “positive” data in markets such as Brazil, and the continued rollout of data-driven solutions into adjacent verticals, including healthcare, automotive and marketing services.
Recent Portfolio Activity
| Buys | Sells |
|---|---|
| Kubota | |
| Nidec | |
| Sony Financial |
During the quarter, we sold our positions in Kubota, Nidec and Sony Financial.
We first invested in Kubota, the maker of tractors and construction machinery, during the second quarter of 2015. During our holding period, the company gained share in small tractors and construction machinery in North America, expanded in Southeast Asia, and restructured its water and environment segment. While Kubota maintains strong market positions in Japan, the U.S. and Thailand, share gains in these markets appear to be maturing. More recently, the industry has become increasingly promotional, requiring greater use of customer financing, which has raised capital intensity and pressured margins as interest rates have increased. Meanwhile, India remains an attractive long-term tractor market, but Kubota has yet to demonstrate an ability to take meaningful share. We exited the position in favor of what we considered to be a more compelling opportunity but continue to view Kubota as a high-quality company.
We invested in Nidec more than a decade ago, initially attracted by the company’s position as a global leader in precision motors, its strong market share across hard disk drive, its growing presence in industrial and automotive applications, and its ability to consolidate a fragmented industry while generating attractive margins and returns on invested capital. Over our holding period, Nidec maintained leadership in several core motor categories and benefited from long-term demand for energy-efficient solutions across industrial, appliance and data center markets. However, several anticipated catalysts were slower to materialize. The company’s expansion into electric vehicle traction motors proved more competitive and less profitable than expected, while frequent leadership changes, strategic shifts and, more recently, manufacturing and accounting issues introduced persistent uncertainty. Despite efforts to improve discipline and profitability, ongoing investigations and questions around business quality and controls reduced the clarity and predictability of the business. Given these unresolved issues, we concluded that Nidec no longer offered an attractive risk-adjusted return and exited the position.
We received shares of Sony Financial Group following its spin-off from our long-term holding, Sony Group, in October 2025. Sony Financial is a Japan-based financial services company with operations in life insurance, banking and digital payments. While we view Sony Financial as an attractive, well-managed business, we already have meaningful exposure to the global insurance industry through holdings such as AIA Group and Munich Re. Given our existing positioning, we elected to sell the shares received in the spinoff.
Conclusion
Markets and economic conditions will continue to evolve, often in ways that are difficult to anticipate. While we remain attentive to these developments, our work is ultimately centered on understanding individual businesses—how they compete, how they allocate capital and how their economics change over time. We recognize that progress in business fundamentals and investment outcomes do not always align over shorter periods. Thus, we approach our investment process with patience and a willingness to reassess our views as circumstances change. Rather than react impulsively to every macro headline or try to time short-term market moves, we focus on what is analyzable and enduring: the long-term fundamentals of the companies we own. We believe this careful, fundamental approach remains the most reliable way to add value for our clients over the long run, across a wide range of market environments.
The opinions expressed herein are those of Aristotle Capital Management, LLC (Aristotle Capital) and are subject to change without notice. Past performance is not a guarantee or indicator of future results. This material is not financial advice or an offer to buy or sell any product. You should not assume that any of the securities transactions, sectors or holdings discussed in this report were or will be profitable, or that recommendations Aristotle Capital makes in the future will be profitable or equal the performance of the securities listed in this report. The portfolio characteristics shown relate to the Aristotle International Equity ADR strategy. Not every client’s account will have these characteristics. Aristotle Capital reserves the right to modify its current investment strategies and techniques based on changing market dynamics or client needs. There is no assurance that any securities discussed herein will remain in an account’s portfolio at the time you receive this report or that securities sold have not been repurchased. The securities discussed may not represent an account’s entire portfolio and, in the aggregate, may represent only a small percentage of an account’s portfolio holdings. The performance attribution presented is of a representative account from Aristotle Capital’s International Equity ADR Strategy. The representative account is a discretionary client account which was chosen to most closely reflect the investment style of the strategy. The criteria used for representative account selection is based on the account’s period of time under management and its similarity of holdings in relation to the strategy. Recommendations made in the last 12 months are available upon request.
Composite returns are presented pure gross and net of the maximum wrap fee and include the reinvestment of all income. Pure gross returns do not reflect the deduction of any trading costs or other fees and are supplemental to the net returns. Net returns are calculated by subtracting the highest applicable wrap/SMA fee, which includes trading costs and custodial fees, from the pure gross composite return. (From inception to 12/31/2015, the highest applicable wrap/SMA fee is 3.00% on an annual basis, or 0.75% quarterly. From 1/1/2016 to 12/31/2023, the highest applicable wrap/SMA fee is 2.00% on an annual basis, or 0.50% quarterly and 0.17% monthly from 1/1/2024 to present.)
All investments carry a certain degree of risk, including the possible loss of principal. Investments are also subject to political, market, currency and regulatory risks or economic developments. International investments involve special risks that may in particular cause a loss in principal, including currency fluctuation, lower liquidity, different accounting methods and economic and political systems, and higher transaction costs. These risks typically are greater in emerging markets. While Large-capitalization companies may have more stable prices than smaller, less established companies, they are still subject to equity securities risk. In addition, large-capitalization equity security prices may not rise as much as prices of equity securities of small-capitalization companies. Securities of small- and medium-sized companies tend to have a shorter history of operations and be more volatile and less liquid. Value stocks can perform differently from the market as a whole and other types of stocks. The material is provided for informational and/or educational purposes only and is not intended to be and should not be construed as investment, legal or tax advice and/or a legal opinion. Investors should consult their financial and tax adviser before making investments. The opinions referenced are as of the date of publication, may be modified due to changes in the market or economic conditions, and may not necessarily come to pass. Information and data presented has been developed internally and/or obtained from sources believed to be reliable. Aristotle Capital does not guarantee the accuracy, adequacy or completeness of such information.
Aristotle Capital Management, LLC is an independent registered investment adviser under the Advisers Act of 1940, as amended. Registration does not imply a certain level of skill or training. More information about Aristotle Capital, including our investment strategies, fees and objectives, can be found in our Form ADV Part 2, which is available upon request. ACM-2601-100
Sources: CAPS CompositeHubTM, MSCI
Composite returns for all periods ended December 31, 2025 are preliminary pending final account reconciliation.
Past performance is not indicative of future results. The information provided should not be considered financial advice or a recommendation to purchase or sell any particular security or product. Performance results for periods greater than one year have been annualized.
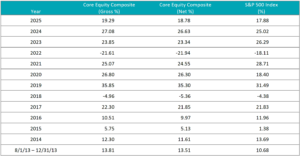
The Aristotle International Equity ADR WM Composite has an inception date of 7/1/2012. As of 1/1/2024, the Composite was renamed from the International Equity ADR Wrap Composite.
Composite returns are presented pure gross and net of the maximum wrap fee and include the reinvestment of all income. Pure gross returns do not reflect the deduction of any trading costs or other fees and are supplemental to the net returns. Net returns are calculated by subtracting the highest applicable wrap/SMA fee, which includes trading costs and custodial fees, from the pure gross composite return. (From inception to 12/31/2015, the highest applicable wrap/SMA fee is 3.00% on an annual basis, or 0.75% quarterly. From 1/1/2016 to 12/31/2023, the highest applicable wrap/SMA fee is 2.00% on an annual basis, or 0.50% quarterly and 0.17% monthly from 1/1/2024 to present.)
The MSCI EAFE Index (Europe, Australasia, Far East) is a free float-adjusted market capitalization-weighted index that is designed to measure the equity market performance of developed markets, excluding the United States and Canada. The MSCI EAFE Index consists of the following 21 developed market country indexes: Australia, Austria, Belgium, Denmark, Finland, France, Germany, Hong Kong, Ireland, Israel, Italy, Japan, the Netherlands, New Zealand, Norway, Portugal, Singapore, Spain, Sweden, Switzerland and the United Kingdom. The MSCI ACWI captures large and mid-cap representation across 23 developed market countries and 24 emerging markets countries. With approximately 2,500 constituents, the Index covers approximately 85% of the global investable equity opportunity set. The MSCI ACWI Growth Index captures large and mid-cap securities exhibiting overall growth style characteristics across 23 developed markets countries and 24 emerging markets countries. The MSCI ACWI Value Index captures large and mid-cap securities exhibiting overall value style characteristics across 23 developed markets countries and 24 emerging markets countries. The MSCI ACWI ex USA Index captures large and mid-cap representation across 22 of 23 developed markets countries (excluding the United States) and 24 emerging markets countries. With approximately 2,000 constituents, the Index covers approximately 85% of the global equity opportunity set outside the United States. The MSCI Emerging Markets Index is a free float-adjusted market capitalization-weighted index that is designed to measure the equity market performance of emerging markets. The MSCI Emerging Markets Index consists of the following 24 emerging market country indexes: Brazil, Chile, China, Colombia, Czech Republic, Egypt, Greece, Hungary, India, Indonesia, Korea, Kuwait, Malaysia, Mexico, Peru, Philippines, Poland, Qatar, Saudi Arabia, South Africa, Taiwan, Thailand, Turkey and United Arab Emirates. The S&P 500® Index is the Standard & Poor’s Composite Index of 500 stocks and is a widely recognized, unmanaged index of common stock prices. The Brent Crude Oil Index is a major trading classification of sweet light crude oil that serves as a major benchmark price for purchases of oil worldwide. The MSCI Japan Index is designed to measure the performance of the large and mid-cap segments of the Japanese market. With approximately 200 constituents, the Index covers approximately 85% of the free float-adjusted market capitalization in Japan. The Bloomberg Global Aggregate Bond Index is a flagship measure of global investment grade debt from 27 local currency markets. This multi-currency benchmark includes treasury, government-related, corporate and securitized fixed-rate bonds from both developed and emerging markets issuers. The MSCI United Kingdom Index is designed to measure the performance of the large and mid-cap segments of the U.K. market. With nearly 100 constituents, the Index covers approximately 85% of the free float-adjusted market capitalization in the United Kingdom. The MSCI Europe Index captures large and mid-cap representation across 15 developed markets countries in Europe. With approximately 400 constituents, the Index covers approximately 85% of the free float-adjusted market capitalization across the European developed markets equity universe. These indexes have been selected as the benchmarks and are used for comparison purposes only. The volatility (beta) of the Composite may be greater or less than the respective benchmarks. It is not possible to invest directly in these indexes.