Commentary
Core Equity 4Q 2023
Markets Review
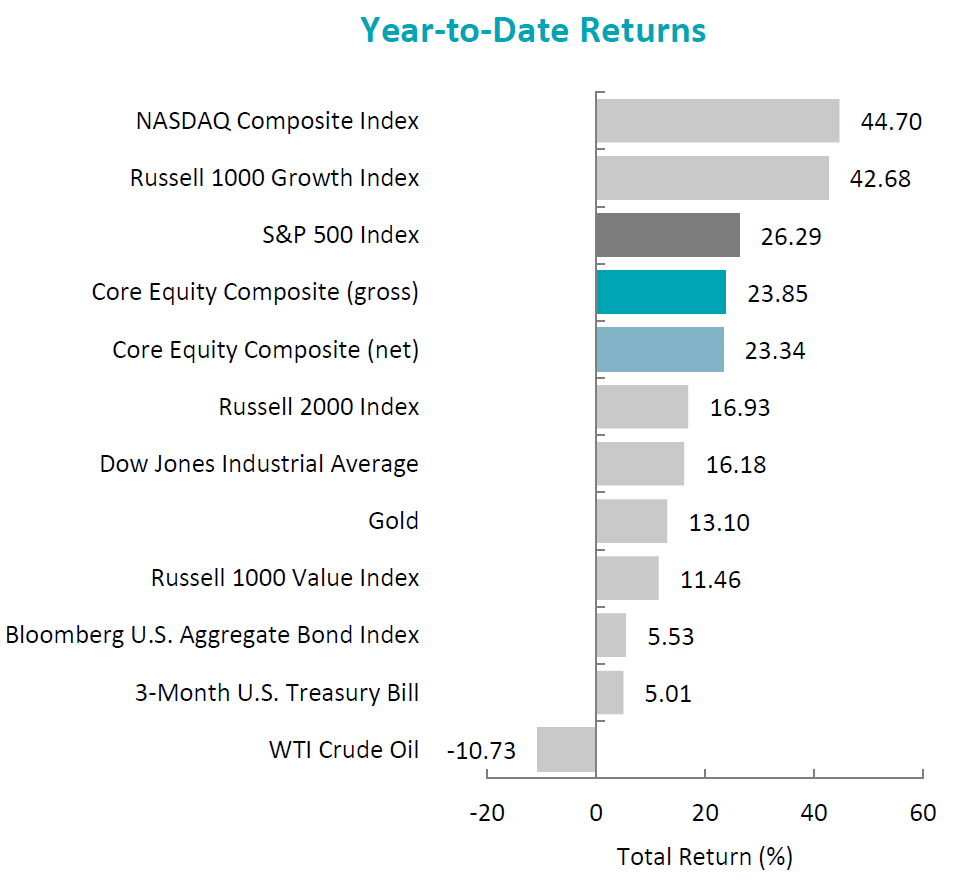
The U.S. equity market rebounded, as the S&P 500 Index rose 11.69% during the period. Concurrently, the Bloomberg U.S. Aggregate Bond Index rallied, increasing 6.82% for the quarter. In terms of style, the Russell 1000 Value Index underperformed its growth counterpart by 4.66%.
Gains were broad-based, as ten out of the eleven sectors within the S&P 500 Index finished higher. Real Estate, Financials and Information Technology were the best-performing sectors. Meanwhile, Energy was the only sector to finish in the red, while Consumer Staples and Health Care gained the least.
Sources: CAPS CompositeHubTM, Bloomberg
Past performance is not indicative of future results. Aristotle Atlantic Core Equity Composite returns are presented gross and net of investment advisory fees and include the reinvestment of all income. Gross returns will be reduced by fees and other expenses that may be incurred in the management of the account. Net returns are presented net of actual investment advisory fees and after the deduction of all trading expenses. Aristotle Atlantic Composite returns are preliminary pending final account reconciliation. Please see important disclosures at the end of this document.
Data released during the period showed that the U.S. economy had accelerated in the third quarter, with real GDP rising at an annual rate of 4.9%—the fastest pace of growth in nearly two years. The robust results were driven by increases in consumer spending and inventory investment. Additionally, single-family housing starts rose 18% month-over-month in November, and the labor market remained tight with 3.7% unemployment. Meanwhile, inflation continued its downward trend, as the annual CPI fell from 3.7% in September to 3.1% in November. The drop was primarily driven by softening energy prices, as both WTI and Brent fell below $80 a barrel. These developments combined to send longer-term interest rates lower, with the 10-year U.S. Treasury yield falling over 70 basis points during the quarter to finish at 3.88%.
As a result of easing inflation, combined with potentially slowing economic activity and a strong but moderating job market, the Federal Reserve (Fed) held the benchmark federal funds rate steady during the quarter. Chair Jerome Powell stated that the central bank’s policy rate is likely at or near its peak for the current tightening cycle, while the Federal Open Market Committee members’ median estimates indicate three quarter-point cuts in 2024.
On the corporate earnings front, results were strong, as 82% of S&P 500 companies exceeded EPS estimates, leading to 4.7% growth in earnings for the Index. Looking forward, analysts expect earnings to accelerate in 2024, with growth of 11.5% year-over-year.
Lastly, in U.S. politics, after backing a bipartisan stopgap funding bill to stave off a partial government shutdown, Congressman Kevin McCarthy was removed as speaker of the United States House of Representatives. This marked the first time in American history that a speaker of the House was ousted through a motion to vacate. Subsequently, Congressman Mike Johnson was elected as McCarthy’s replacement.
Annual Markets Review
After a tumultuous year in 2022, the U.S. equity market rallied in 2023, as the S&P 500 Index posted a full-year return of 26.29%. The increase was primarily driven by the performance of the seven largest companies in the Index, which were responsible for 62% of the S&P 500’s gains. Additionally, after underperforming value last year by the largest amount since 2000, growth recovered, as the Russell 1000 Growth Index outperformed the Russell 1000 Value Index by 31.22% for the year. Meanwhile, the fixed income market also rebounded, as the Bloomberg U.S. Aggregate Bond Index rose 5.53% in 2023.
Macroeconomic news was dominated by inflation, central bank policies, regional bank failures and geopolitical conflicts, while other topics, such as artificial intelligence and congressional politics, made headlines as well. Economic data points were mixed throughout the year, and corporate earnings were just as unpredictable.
Performance and Attribution Summary
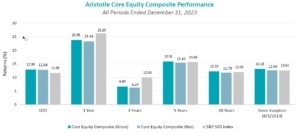
For the fourth quarter of 2023, Aristotle Atlantic’s Core Equity Composite posted a total return of 12.95% gross of fees (12.84% net of fees), outperforming the S&P 500 Index, which recorded a total return of 11.69%.
| Performance (%) | 4Q23 | 1 Year | 3 Years | 5 Years | 10 Years | Since Inception* |
|---|---|---|---|---|---|---|
| Core Equity Composite (gross) | 12.95 | 23.85 | 6.69 | 15.91 | 12.30 | 13.18 |
| Core Equity Composite (net) | 12.84 | 23.34 | 6.24 | 15.43 | 11.79 | 12.66 |
| S&P 500 Index | 11.69 | 26.29 | 10.00 | 15.68 | 12.03 | 12.61 |
Source: FactSet
Past performance is not indicative of future results. Attribution results are based on sector returns which are gross of investment advisory fees. Attribution is based on performance that is gross of investment advisory fees and includes the reinvestment of income. Please see important disclosures at the end of this document.
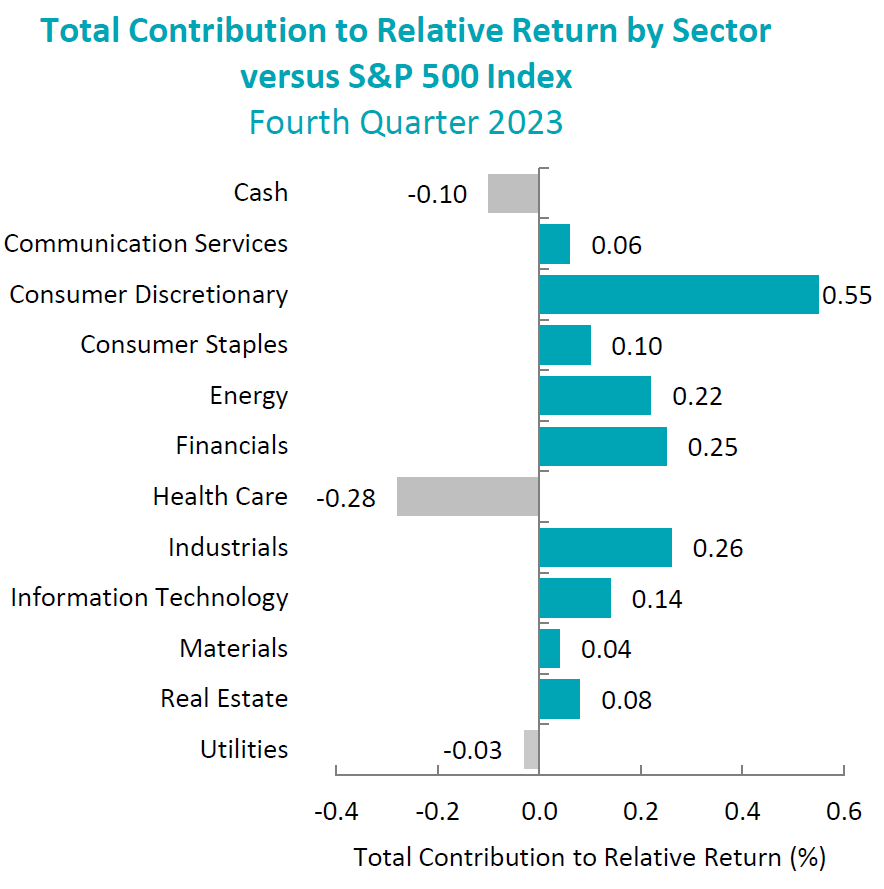
During the fourth quarter, the portfolio’s outperformance relative to the S&P 500 Index was due to both security selection and allocation effects. Security selection in Consumer Discretionary and Financials, as well as an underweight in Energy, contributed the most to relative performance. Conversely, security selection and an overweight in Health Care, as well as security selection in Energy, detracted from relative performance.
Contributors and Detractors for 4Q 2023
| Relative Contributors | Relative Detractors |
|---|---|
| Broadcom | Halliburton |
| Spirit AeroSystems | Becton, Dickinson & Company |
| Expedia | Chart Industries |
| ServiceNow | Darling Ingredients |
| Teleflex | Antero Resources |
Contributors
Broadcom
Broadcom contributed to portfolio outperformance during the quarter, as the company reported fourth quarter results which continued to show strength in its AI business segments. With the VMware acquisition having closed at the end of November, the company also provided positive fiscal year 2024 guidance on its earnings call that included synergy target goals ahead of schedule and a more positive revenue ramp for the combined businesses.
Spirit AeroSystems
Spirit AeroSystems contributed to portfolio outperformance in the fourth quarter. The company replaced the CEO, following a series of manufacturing incidents which resulted in delays in deliveries of fuselages. Additionally, Spirit also came to an agreement with Boeing regarding pricing for the troubled 787 program, which previously was unprofitable. The company also issued equity, which we believe will improve the company’s balance sheet.
Detractors
Haliburton
Halliburton detracted from portfolio performance, as shares were weak in the fourth quarter due to lower global commodity prices amid concerns about excess oil and natural gas supply levels resulting from slowing global economic activity.
Becton, Dickinson & Company
Becton Dickinson & Company detracted from portfolio performance in the quarter, as the company announced lower-than-expected guidance for fiscal year 2024. The weaker guidance was mainly driven by adverse moves in foreign exchange markets; however, the guidance seemed to surprise investors, even though we believe the underlying business trends remain solid.
Recent Portfolio Activity
The table below shows all buys and sells completed during the quarter, followed by a brief rationale.
| Buys | Sells |
|---|---|
| Eli Lilly | Bristol-Myers |
| Vertex Pharmaceuticals | PepsiCo |
Buys
Eli Lilly & Company
Eli Lilly & Company is a leading pharmaceutical company that develops diabetes, oncology, immunology and neuroscience medicines. The company generates over half of its revenue in the U.S. from its top-selling drugs Trulicity, Verzenio and Taltz. The company operates in a single business segment, Human pharmaceutical products.
Eli Lilly has a deep pipeline in treatment areas focused on metabolic disorders, oncology, immunology and central nervous system disorders. Currently, there are two phase three assets, Orforglipron, an oral GLP-1 and retatrutide, a triple incretin agonist, which have the potential to expand upon the potential success of Mounjaro. We believe that Mounjaro has the potential to commercialize beyond type 2 diabetes and obesity, potentially in the areas mentioned above of heart disease, sleep apnea, fatty liver disease and chronic kidney disease. We belief the premium valuation is supported by this outsized growth profile.
Vertex Pharmaceuticals
Vertex Pharmaceuticals develops drugs for treating cystic fibrosis, cancer, inflammatory bowel, autoimmune disease and neurological disorders. The biotechnology company has four commercial drugs used to treat cystic fibrosis. Vertex has other drugs in development, including additional cystic fibrosis treatments and medications addressing sickle cell disease, beta thalassemia, alpha-1 antitrypsin deficiency and pain.
Vertex is the global leader in treating cystic fibrosis and has additionally built a robust pipeline in several therapeutic areas. Late-stage studies in acute and neuropathic pain are expected to be another catalyst for the company. We believe Vertex’s valuation is attractive and at a discount relative to their 5-year historical average. Additionally, the company is well capitalized, with roughly $12.5 billion in net cash on its balance sheet.
Sells
Bristol-Myers
We sold our position in Bristol-Myers, following the third quarter earnings report where the company reduced the medium-term guidance on the new product portfolio and lowered its 2025 target. Given the large amount of revenue associated with drugs going off-patent, the new product portfolio was key to the company’s ability to change investor perception. Certain launches are not performing as expected, and others are taking longer to scale. Additionally, Bristol-Myers reduced medium-term operating margin guidance to invest in its commercial drugs and the research and development (R&D) pipeline. We do not believe that the company exhibited the level of defensiveness in the strategy we expected given the low valuation.
PepsiCo
We sold PepsiCo based on our belief that the inflation and interest rate cycle has peaked, and the company may have difficulty maintaining the recent organic growth trends which were driven mainly by price increases. Furthermore, the market appears to be shifting away from defensive names and into a more cyclical positioning which could cause PepsiCo to lag.
Outlook
Major equity markets in the fourth quarter were positively impacted by a sharp decline in interest rates. The move in interest rates reflects the view that the tightening cycle implemented by the Fed to curb inflation may have run its course. Expectations for 2024 include rate reductions by the Fed and a high single-digit increase in S&P 500 earnings. Along with this positive view, we also expect a broadening of performance relative to the AI-focused returns in 2023. The sizable move in equity markets in the fourth quarter has left equity valuations at the upper end of historical levels, which could limit the upside, absent positive earnings revisions. The increased geopolitical tensions and a pending U.S. Presidential election may also weigh on markets in 2024. Our focus will continue to be at the company level, with an emphasis on seeking to invest in companies with secular tailwinds or strong product-driven cycles.
The opinions expressed herein are those of Aristotle Atlantic Partners, LLC (Aristotle Atlantic) and are subject to change without notice. Past performance is not a guarantee or indicator of future results. This material is not financial advice or an offer to purchase or sell any product. You should not assume that any of the securities transactions, sectors or holdings discussed in this report were or will be profitable, or that recommendations Aristotle Atlantic makes in the future will be profitable or equal the performance of the securities listed in this report. The portfolio characteristics shown relate to the Aristotle Atlantic Core Equity strategy. Not every client’s account will have these characteristics. Aristotle Atlantic reserves the right to modify its current investment strategies and techniques based on changing market dynamics or client needs. There is no assurance that any securities discussed herein will remain in an account’s portfolio at the time you receive this report or that securities sold have not been repurchased. The securities discussed may not represent an account’s entire portfolio and, in the aggregate, may represent only a small percentage of an account’s portfolio holdings. The performance attribution presented is of a representative account from Aristotle Atlantic’s Core Equity Composite. The representative account is a discretionary client account which was chosen to most closely reflect the investment style of the strategy. The criteria used for representative account selection is based on the account’s period of time under management and its similarity of holdings in relation to the strategy. Recommendations made in the last 12 months are available upon request.
Returns are presented gross and net of investment advisory fees and include the reinvestment of all income. Gross returns will be reduced by fees and other expenses that may be incurred in the management of the account. Net returns are presented net of actual investment advisory fees and after the deduction of all trading expenses.
All investments carry a certain degree of risk, including the possible loss of principal. Investments are also subject to political, market, currency and regulatory risks or economic developments. International investments involve special risks that may in particular cause a loss in principal, including currency fluctuation, lower liquidity, different accounting methods and economic and political systems, and higher transaction costs. These risks typically are greater in emerging markets. Securities of small‐ and medium‐sized companies tend to have a shorter history of operations, be more volatile and less liquid. Value stocks can perform differently from the market as a whole and other types of stocks.
The material is provided for informational and/or educational purposes only and is not intended to be and should not be construed as investment, legal or tax advice and/or a legal opinion. Investors should consult their financial and tax adviser before making investments. The opinions referenced are as of the date of publication, may be modified due to changes in the market or economic conditions, and may not necessarily come to pass. Information and data presented has been developed internally and/or obtained from sources believed to be reliable. Aristotle Atlantic does not guarantee the accuracy, adequacy or completeness of such information.
Aristotle Atlantic Partners, LLC is an independent registered investment adviser under the Advisers Act of 1940, as amended. Registration does not imply a certain level of skill or training. More information about Aristotle Atlantic, including our investment strategies, fees and objectives, can be found in our Form ADV Part 2, which is available upon request. AAP-2401-30
Sources: CAPS Composite Hub, Russell Investments
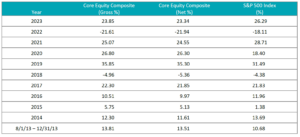
Composite returns for all periods ended December 31, 2023 are preliminary pending final account reconciliation.
The Aristotle Core Equity Composite has an inception date of August 1, 2013 at a predecessor firm. During this time, Mr. Fitzpatrick had primary responsibility for managing the strategy. Performance starting November 1, 2016 was achieved at Aristotle Atlantic.
Past performance is not indicative of future results. Performance results for periods greater than one year have been annualized. Returns are presented gross and net of investment advisory fees and include the reinvestment of all income. Gross returns will be reduced by fees and other expenses that may be incurred in the management of the account. Net returns are presented net of actual investment advisory fees and after the deduction of all trading expenses.
The Russell 1000® Growth Index measures the performance of the large cap growth segment of the U.S. equity universe. It includes those Russell 1000 companies with higher price-to-book ratios and higher forecasted growth values. This index has been selected as the benchmark and is used for comparison purposes only. The Russell 1000® Value Index measures the performance of the large cap value segment of the U.S. equity universe. It includes those Russell 1000 companies with lower price-to-book ratios and lower expected growth values. The S&P 500® Index is the Standard & Poor’s Composite Index of 500 stocks and is a widely recognized, unmanaged index of common stock prices. The Dow Jones Industrial Average® is a price-weighted measure of 30 U.S. blue-chip companies. The Index covers all industries except transportation and utilities. The NASDAQ Composite Index measures all NASDAQ domestic and international based common type stocks listed on The NASDAQ Stock Market. The NASDAQ Composite includes over 3,000 companies, more than most other stock market indices. The Bloomberg U.S. Aggregate Bond Index is an unmanaged index of domestic investment grade bonds, including corporate, government and mortgage-backed securities. The WTI Crude Oil Index is a major trading classification of sweet light crude oil that serves as a major benchmark price for oil consumed in the United States. The Brent Crude Oil Index is a major trading classification of sweet light crude oil that serves as a major benchmark price for purchases of oil worldwide. The 3-Month U.S. Treasury Bill is a short-term debt obligation backed by the U.S. Treasury Department with a maturity of three months. The Consumer Price Index (CPI) is a measure of the average change over time in the prices paid by urban consumers for a market basket of consumer goods and services. While stock selection is not governed by quantitative rules, a stock typically is added only if the company has an excellent reputation, demonstrates sustained growth and is of interest to a large number of investors. The volatility (beta) of the Composite may be greater or less than its respective benchmarks. It is not possible to invest directly in these indices.