ARISTOTLE CAPITAL BOSTON, LLC
Markets Review
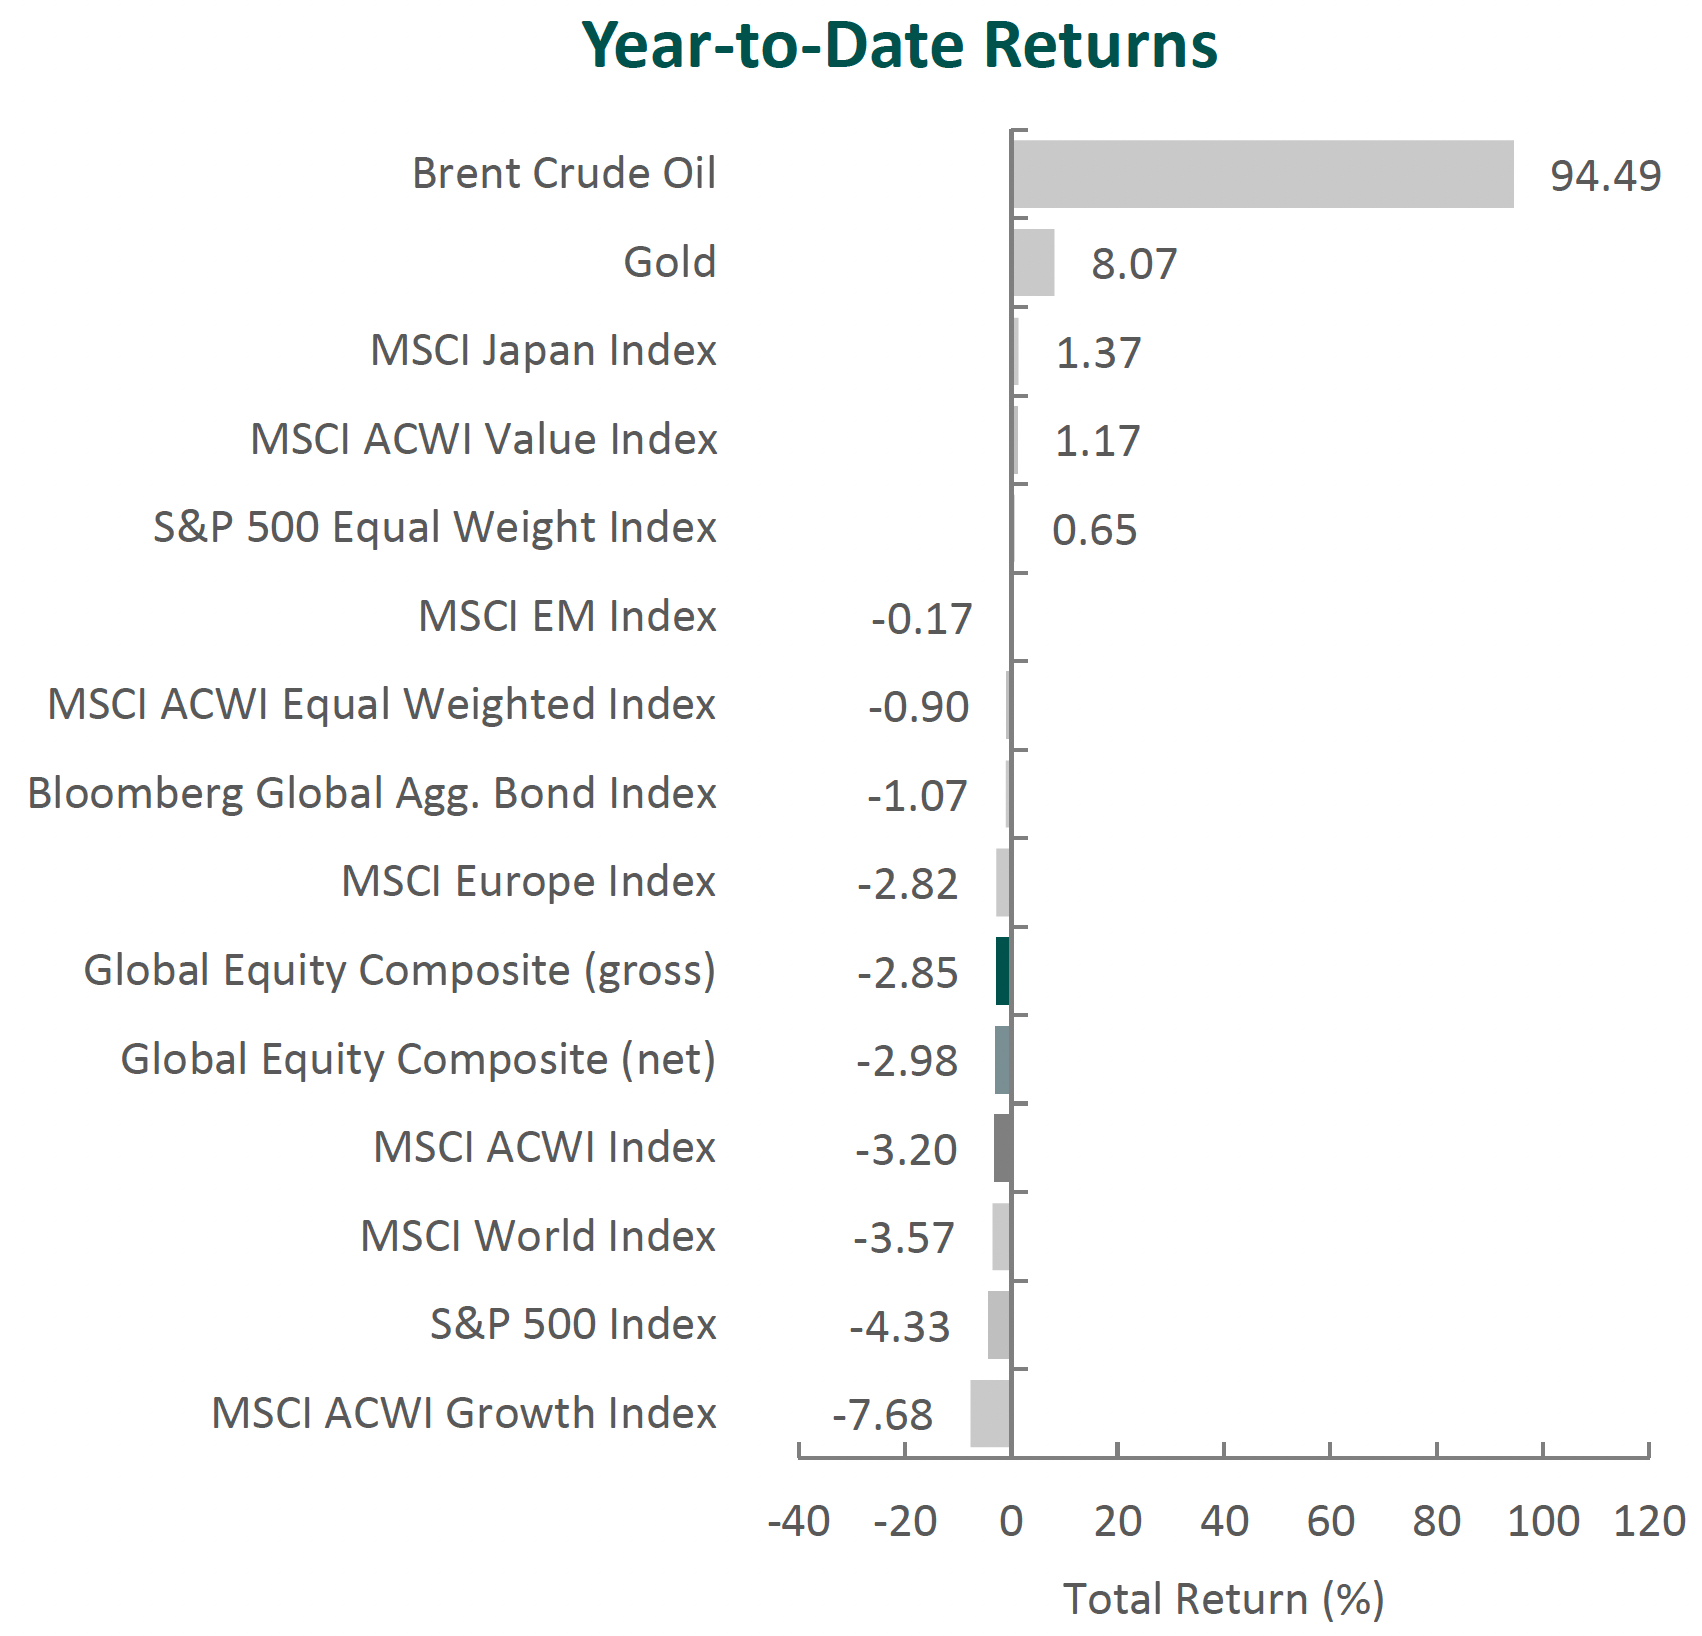
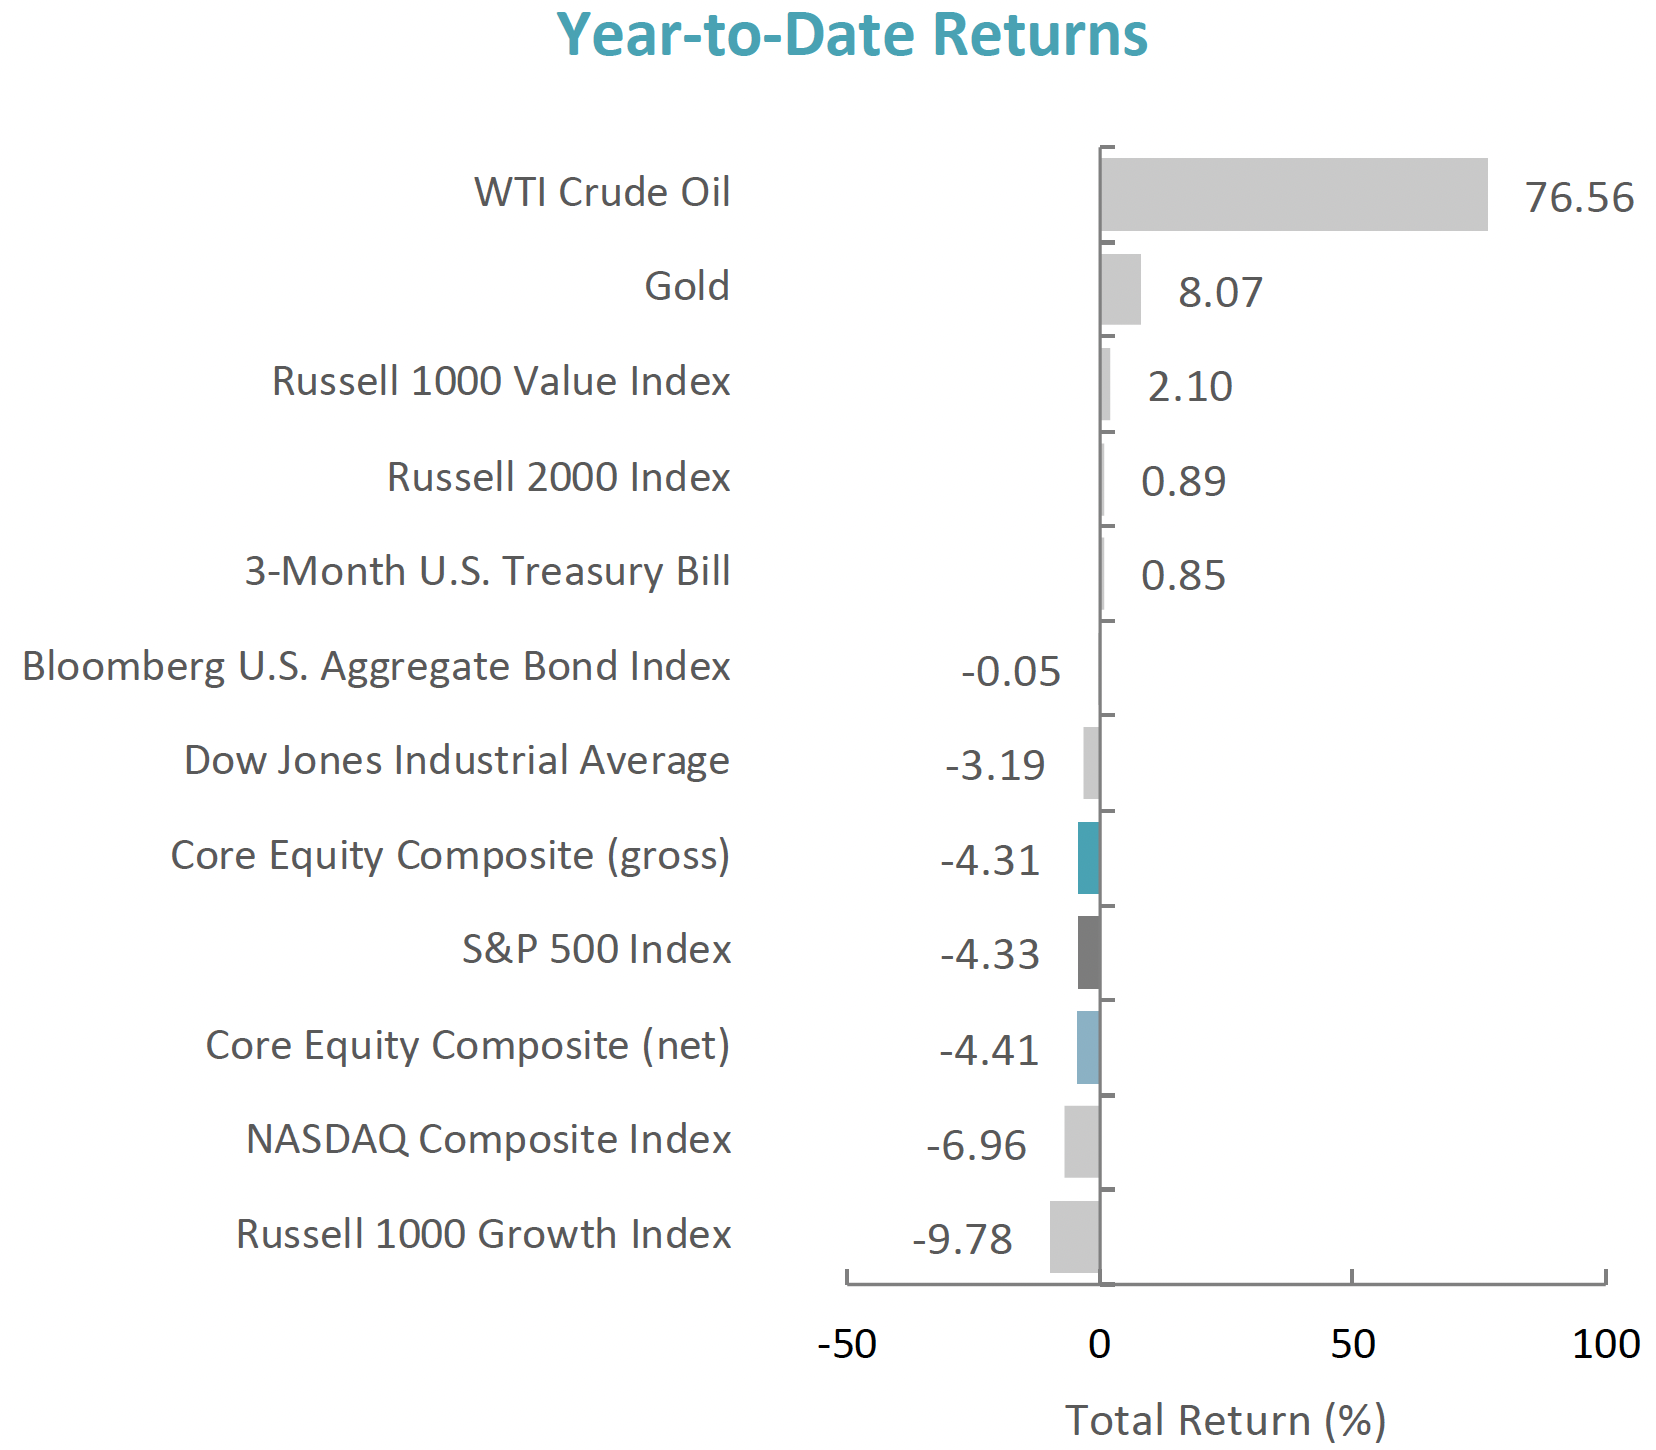
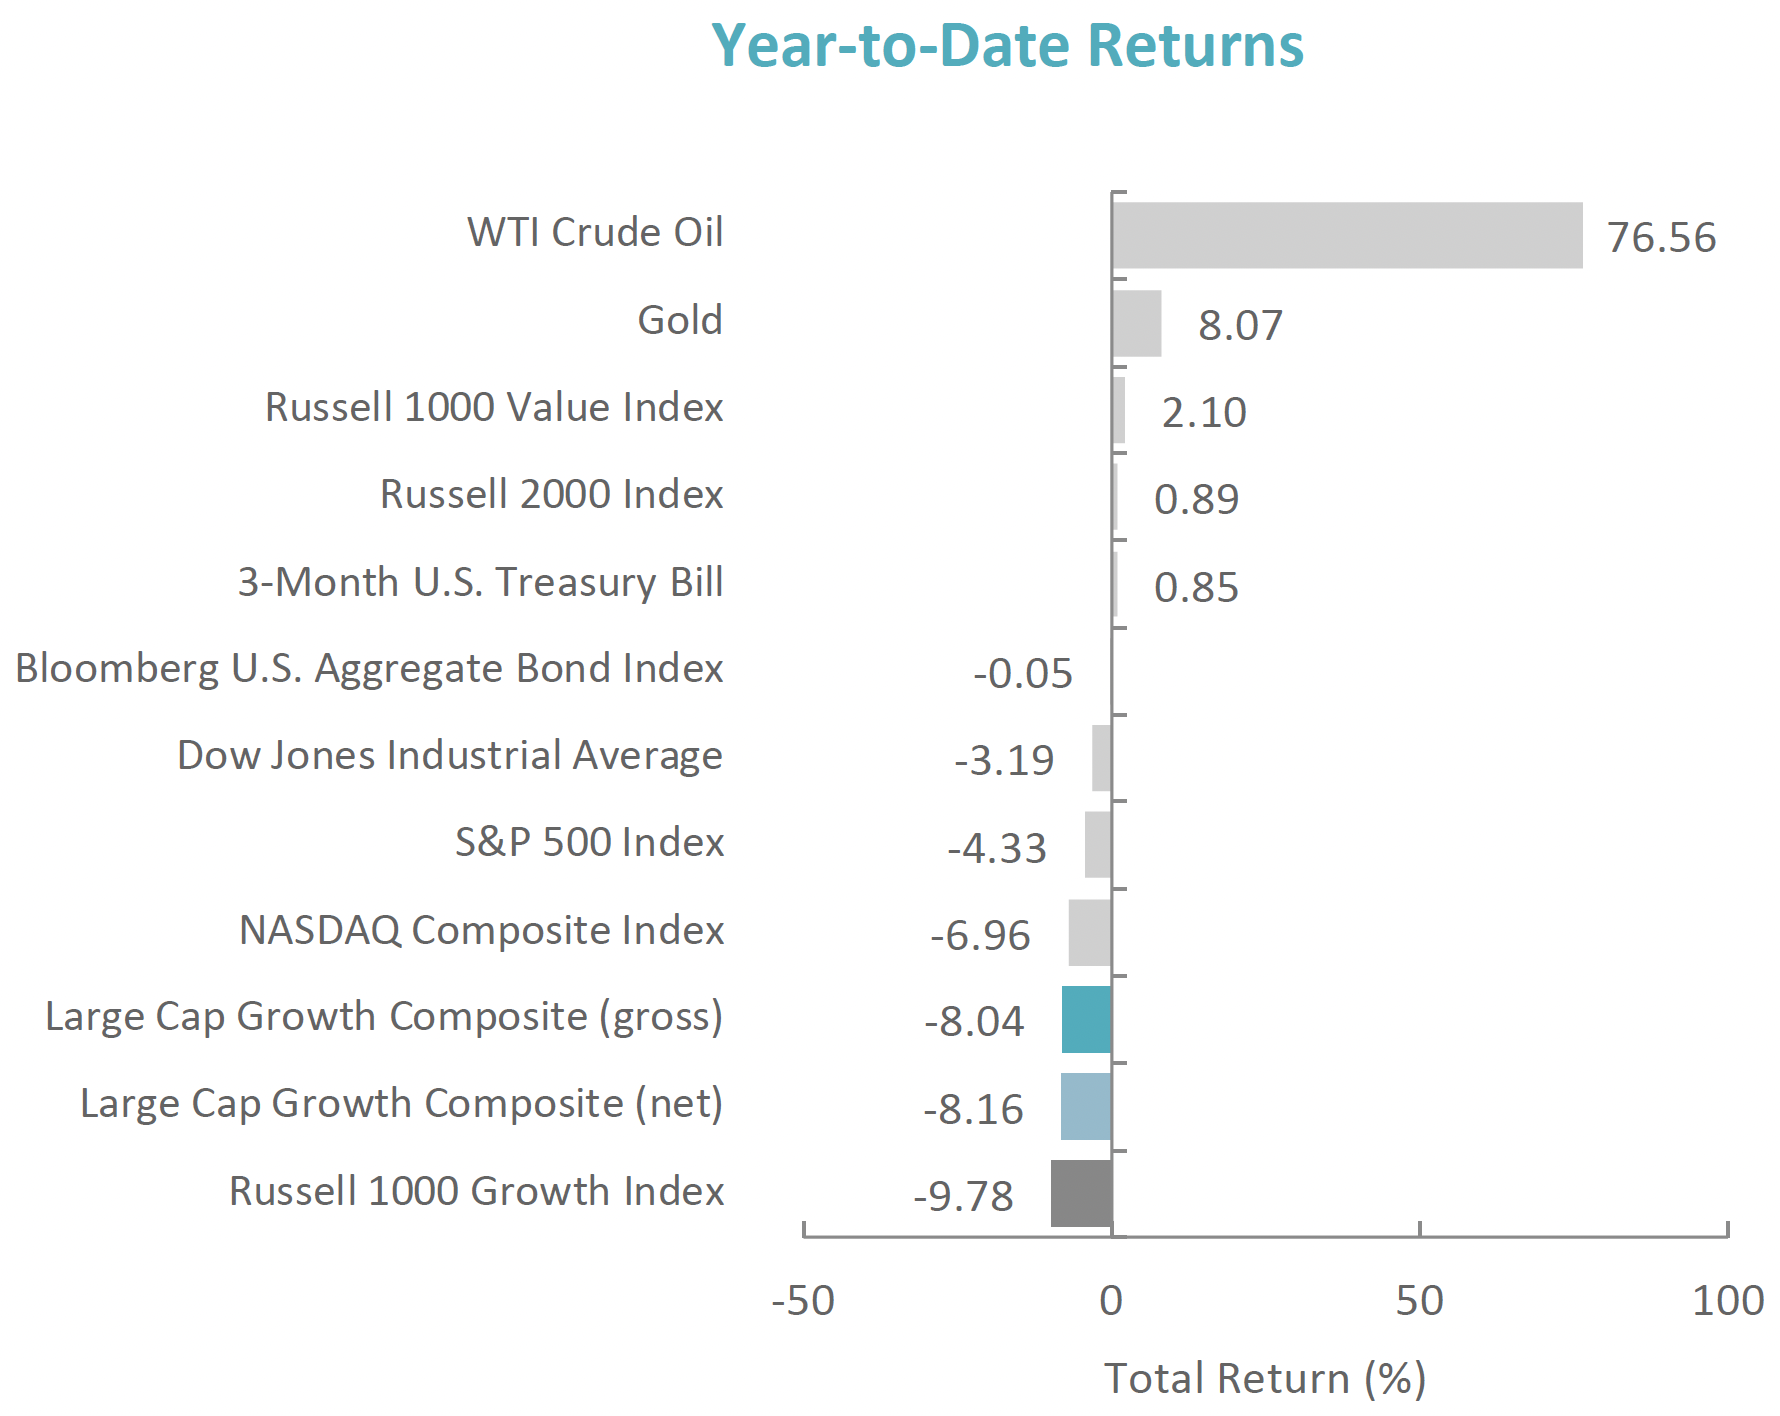
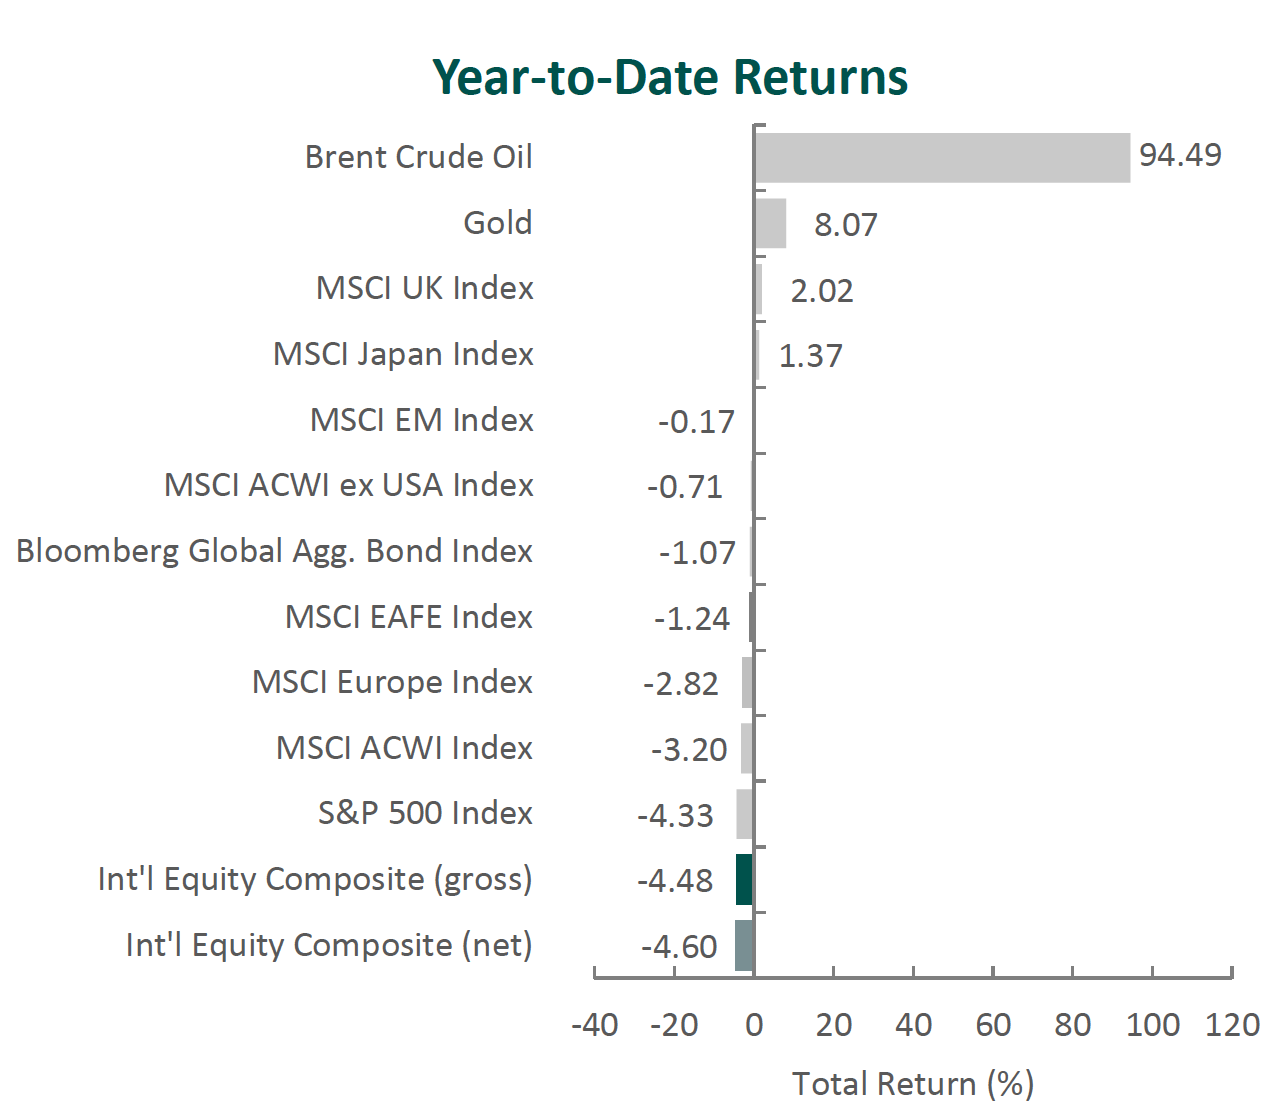
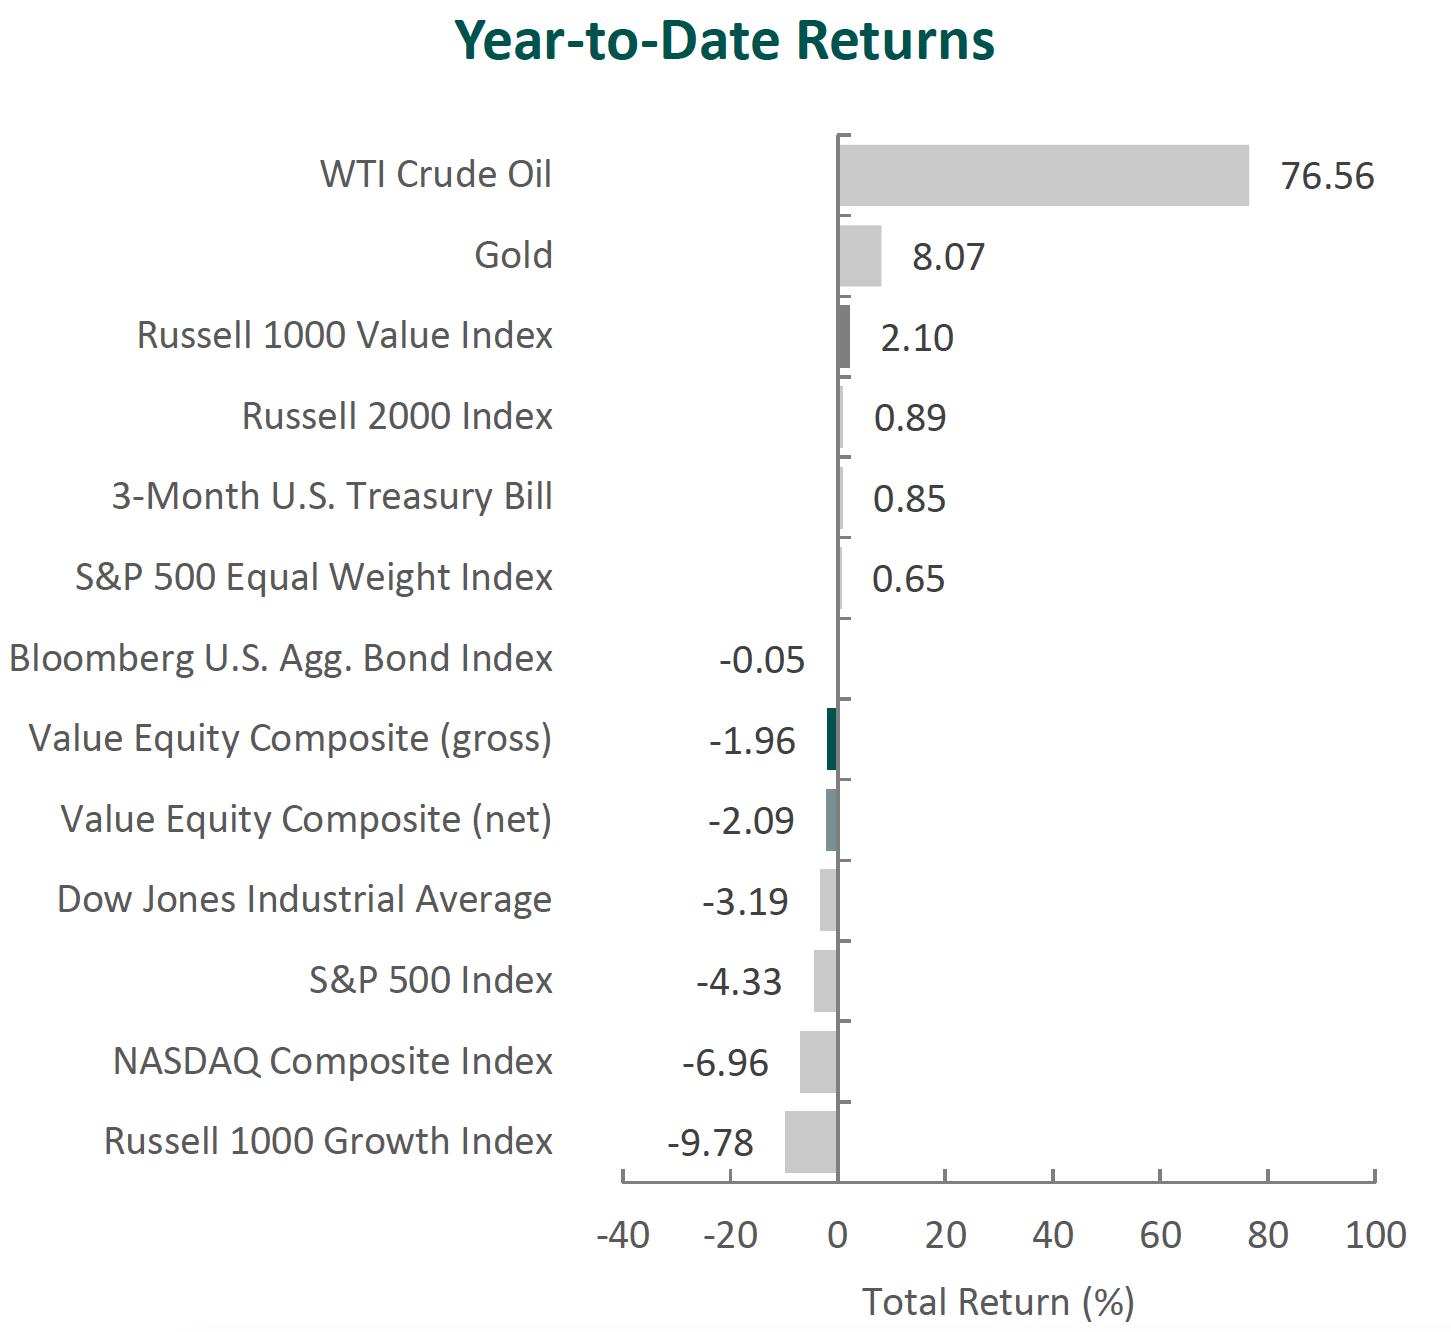
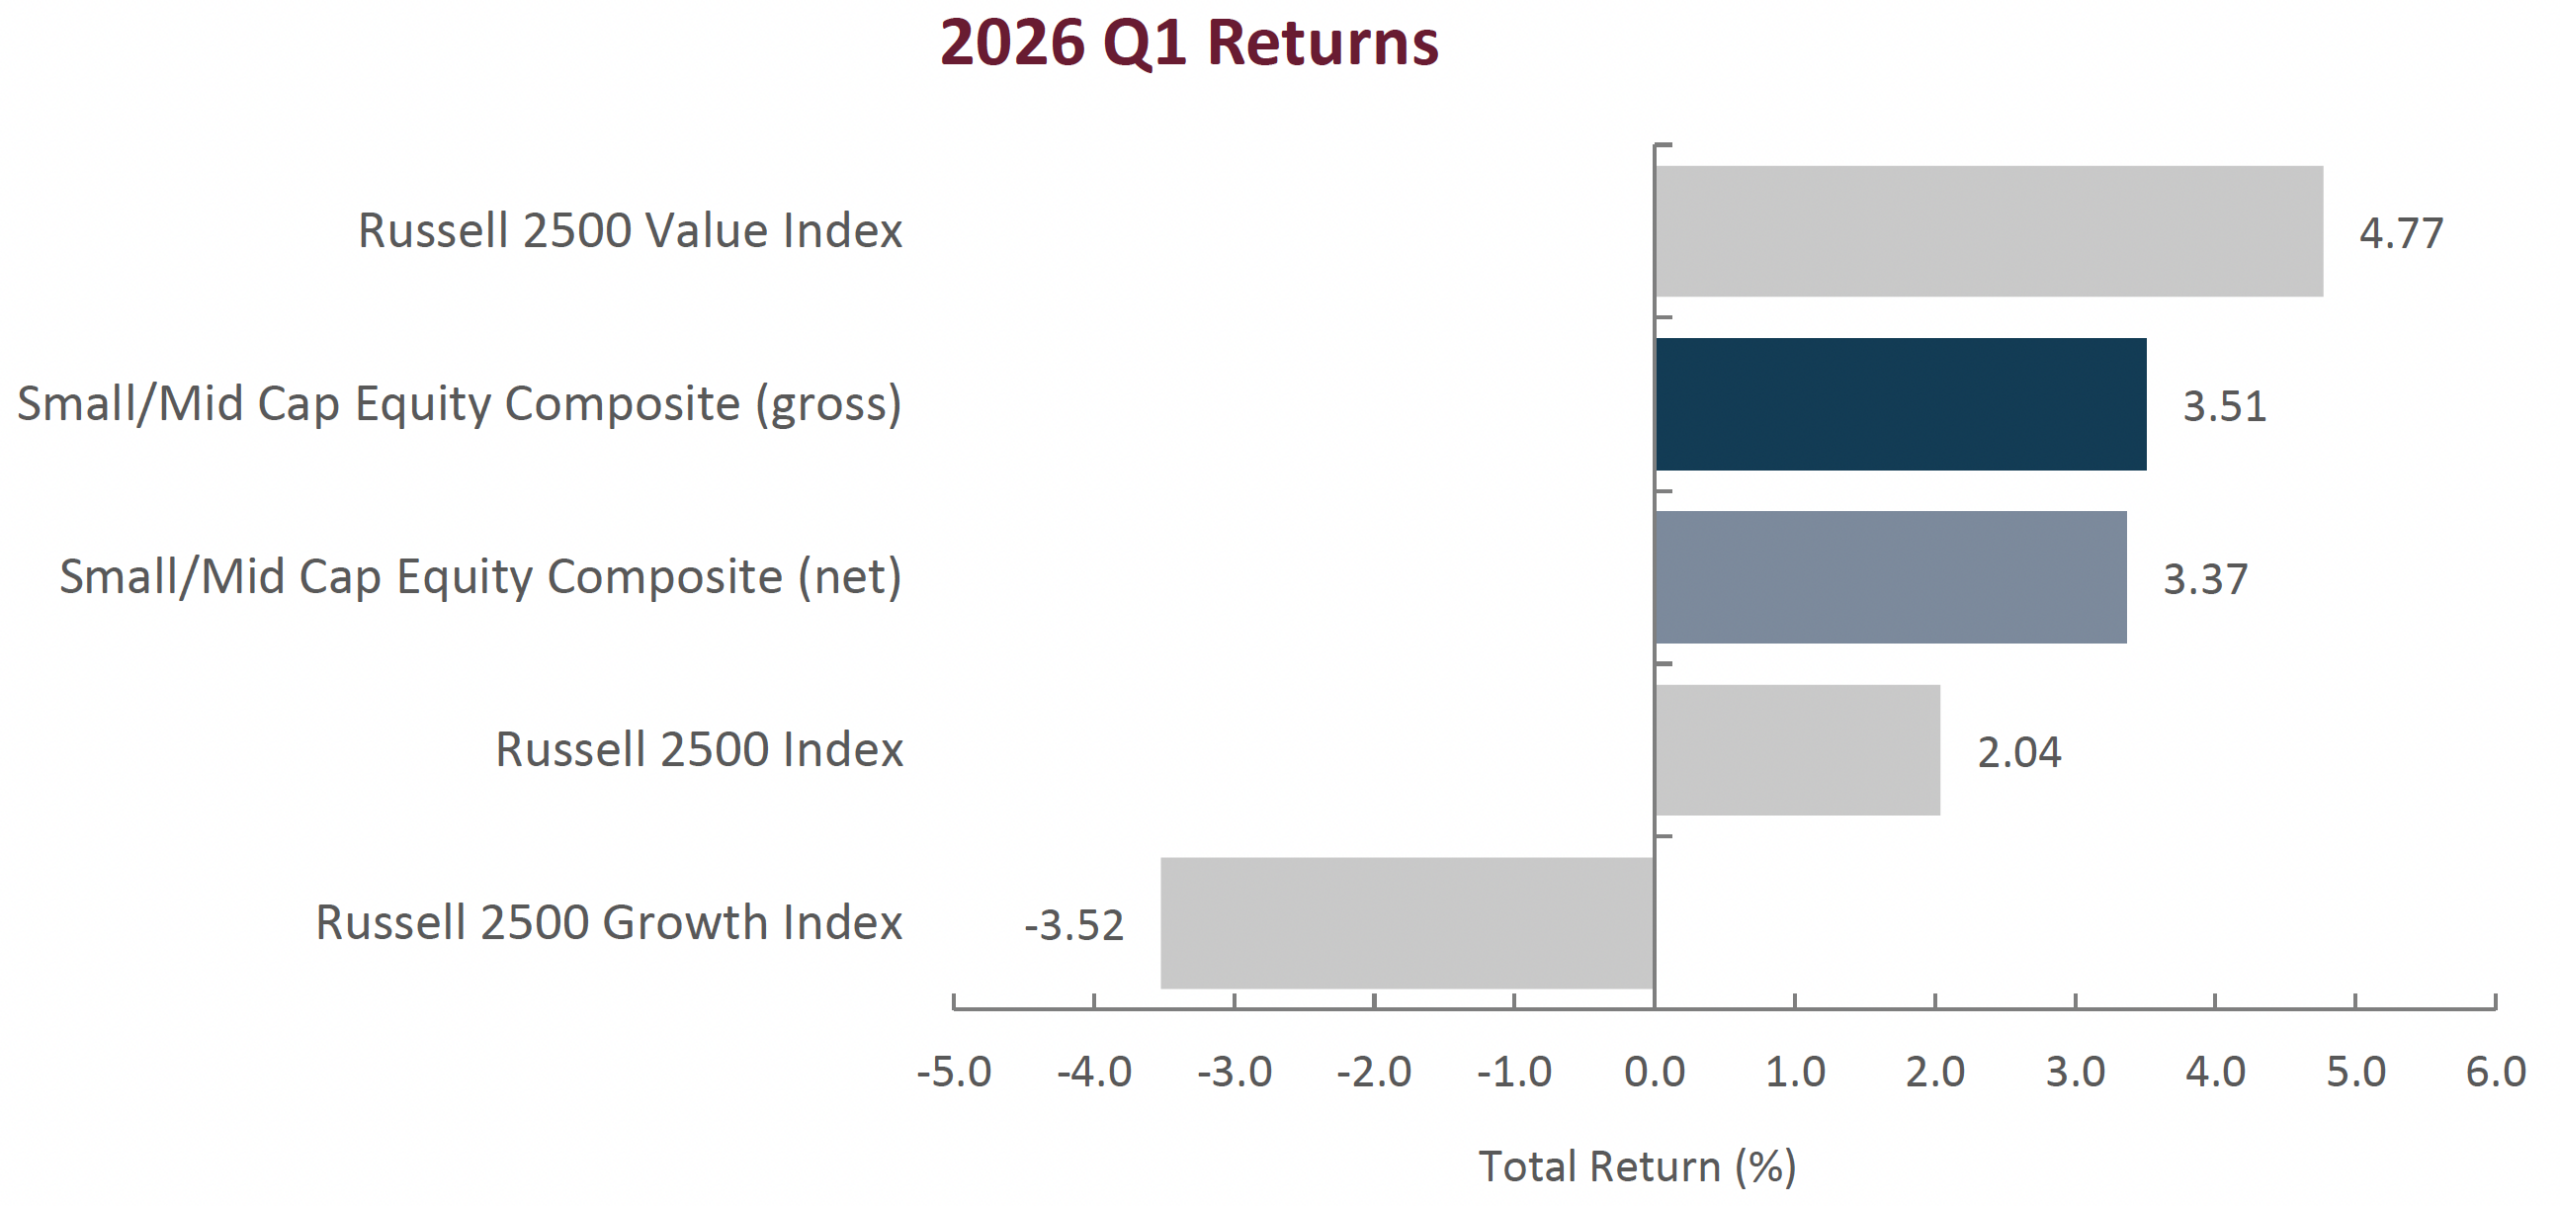
U.S. small/mid cap equities demonstrated notable resilience during the first quarter of 2026, navigating a volatile macroeconomic and geopolitical backdrop more effectively than large cap stocks. While broader U.S. equity markets declined amid rising oil prices, renewed inflation concerns, and escalating conflict in the Middle East, small- and mid-caps modestly outperformed, supported by improving earnings momentum, attractive relative valuations, and greater exposure to domestically focused areas of the economy. The Russell 2500 Index gained 2.04% for the quarter, contrasting with a -4.33% decline in the S&P 500 and marking a rare instance in which small- and mid-caps posted gains during a down quarter for large caps. Performance leadership favored value oriented and domestically focused companies, while mega cap growth stocks experienced valuation pressure as investors rotated away from highly concentrated market leadership. The quarter was shaped by heightened macro uncertainty, though U.S. economic growth remained positive, with GDP advancing at an annualized pace near 2.4% and labor markets showing early signs of stabilization despite a modest rise in unemployment. Inflation remained slightly above the Federal Reserve’s 2% target and intensified late in the quarter following a surge in energy prices tied to the conflict in Iran and disruptions to oil flows through the Strait of Hormuz. Monetary policy remained unchanged with the federal funds rate holding steady at 3.50%-3.75% while continuing to signal the potential for a rate cut later in 2026; an environment that tends to benefit smaller companies with higher floating rate debt exposure as financial conditions ease.
Stylistically, value stocks outperformed their growth counterparts during the quarter as the Russell 2500 Value Index returned 4.77% compared to the -3.52% return of the Russell 2500 Growth index. Performance was highly concentrated, as Energy outperformed the Russell 2500 Index by over 36%, and the top five stocks contributed over 100% of the benchmark’s return. From a factor perspective, higher quality companies outperformed lower quality companies during the quarter. Factors that had the strongest payoffs were low variability, low leverage, low volatility, ROIC, ROE, and profitability.
At the sector level, there was mixed performance between cyclical and defensive stocks. The best performing sectors were Energy (+38.72%), Consumer Staples (+6.73%), and Industrials (+6.52%), while the worst performing sectors were Financials (-6.10%), Consumer Discretionary (-5.30%), and Health Care (-3.29%).
Sources: CAPS Composite Hub, Russell Investments
Past performance is not indicative of future results. Returns are presented gross and net of investment advisory fees and include the reinvestment of all income. Gross returns will be reduced by fees and other expenses that may be incurred in the management of the account. Net returns are presented net of actual investment advisory fees and after the deduction of all trading expenses. Please see important disclosures at the end of this document.
Performance Review
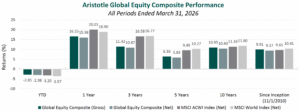
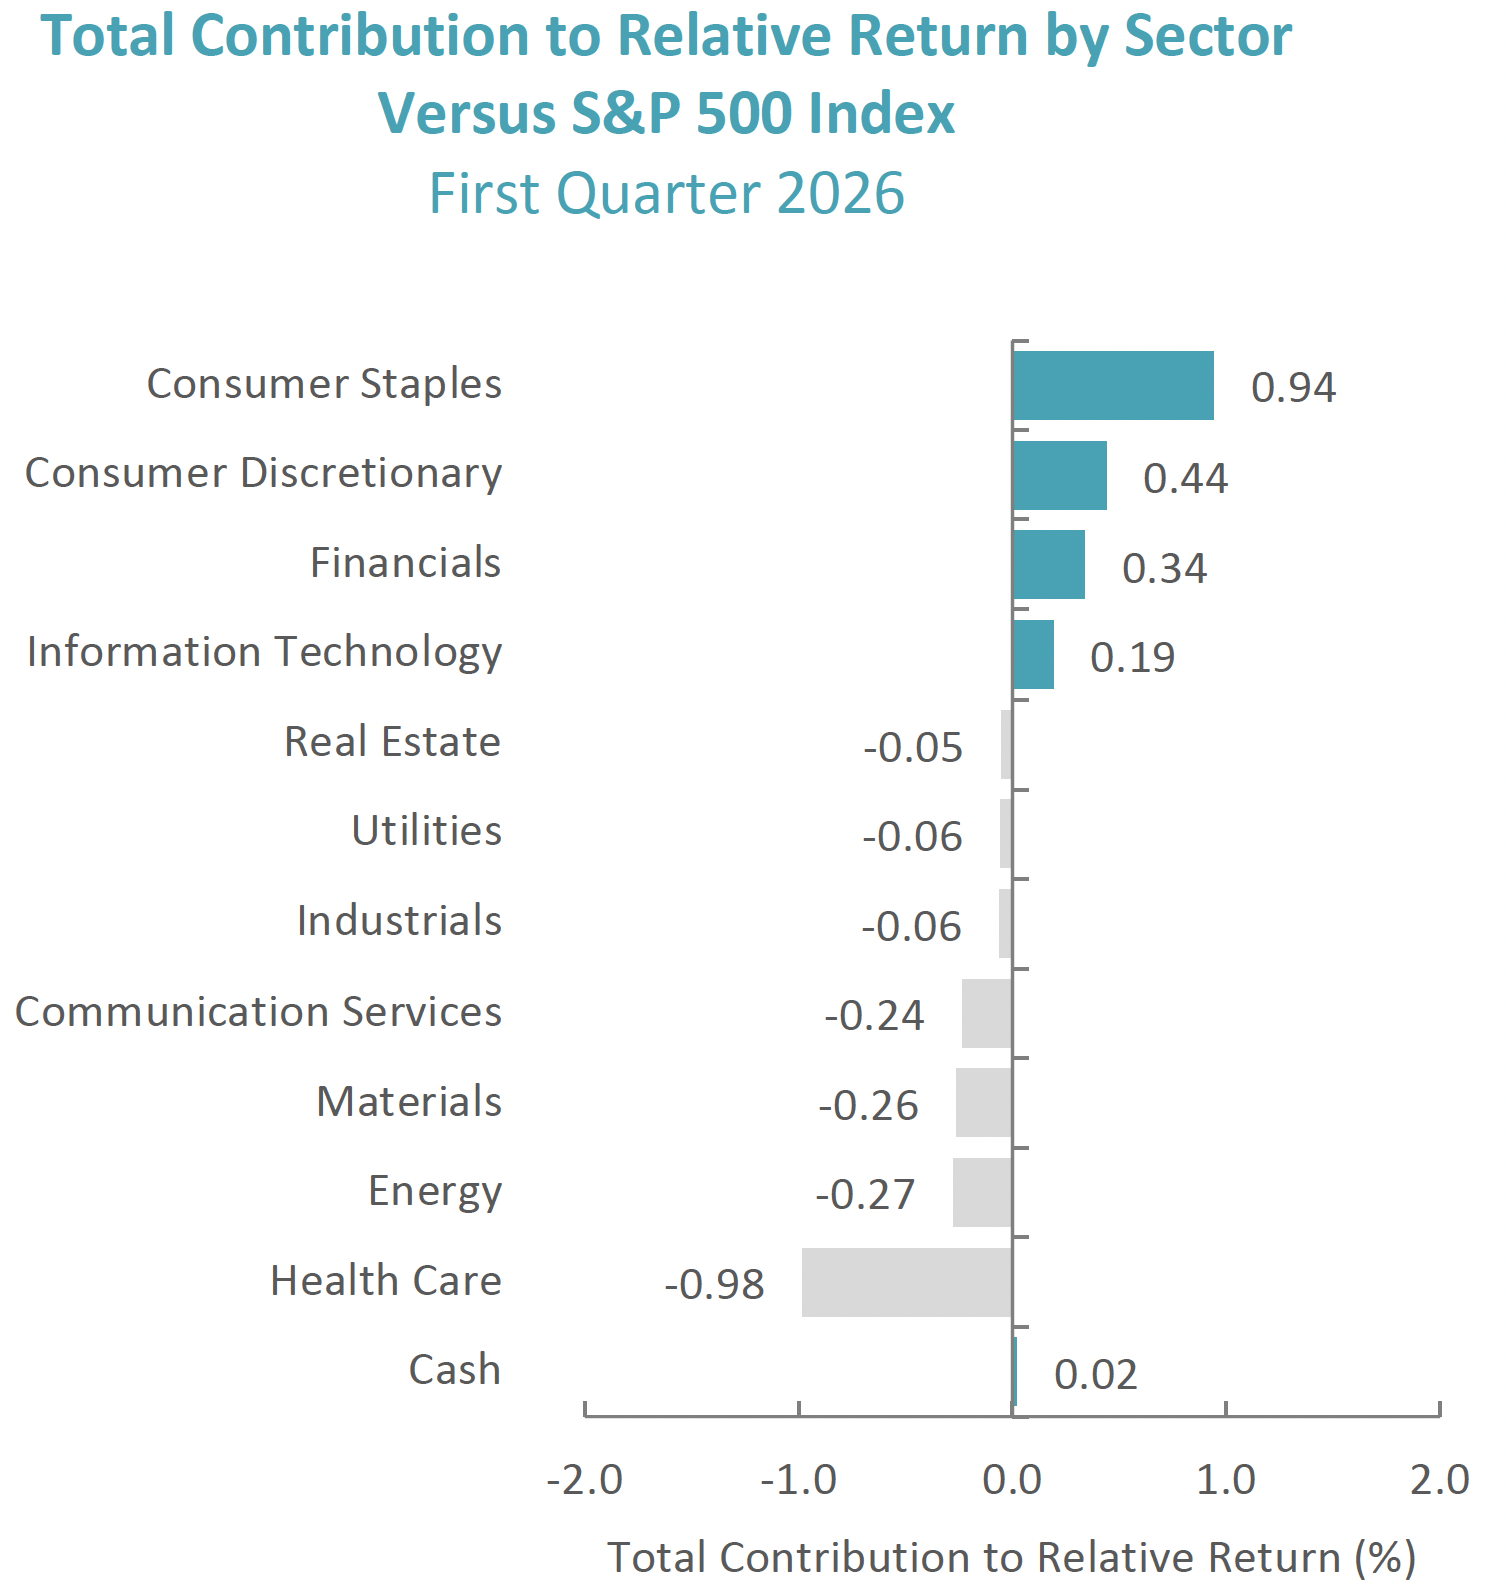
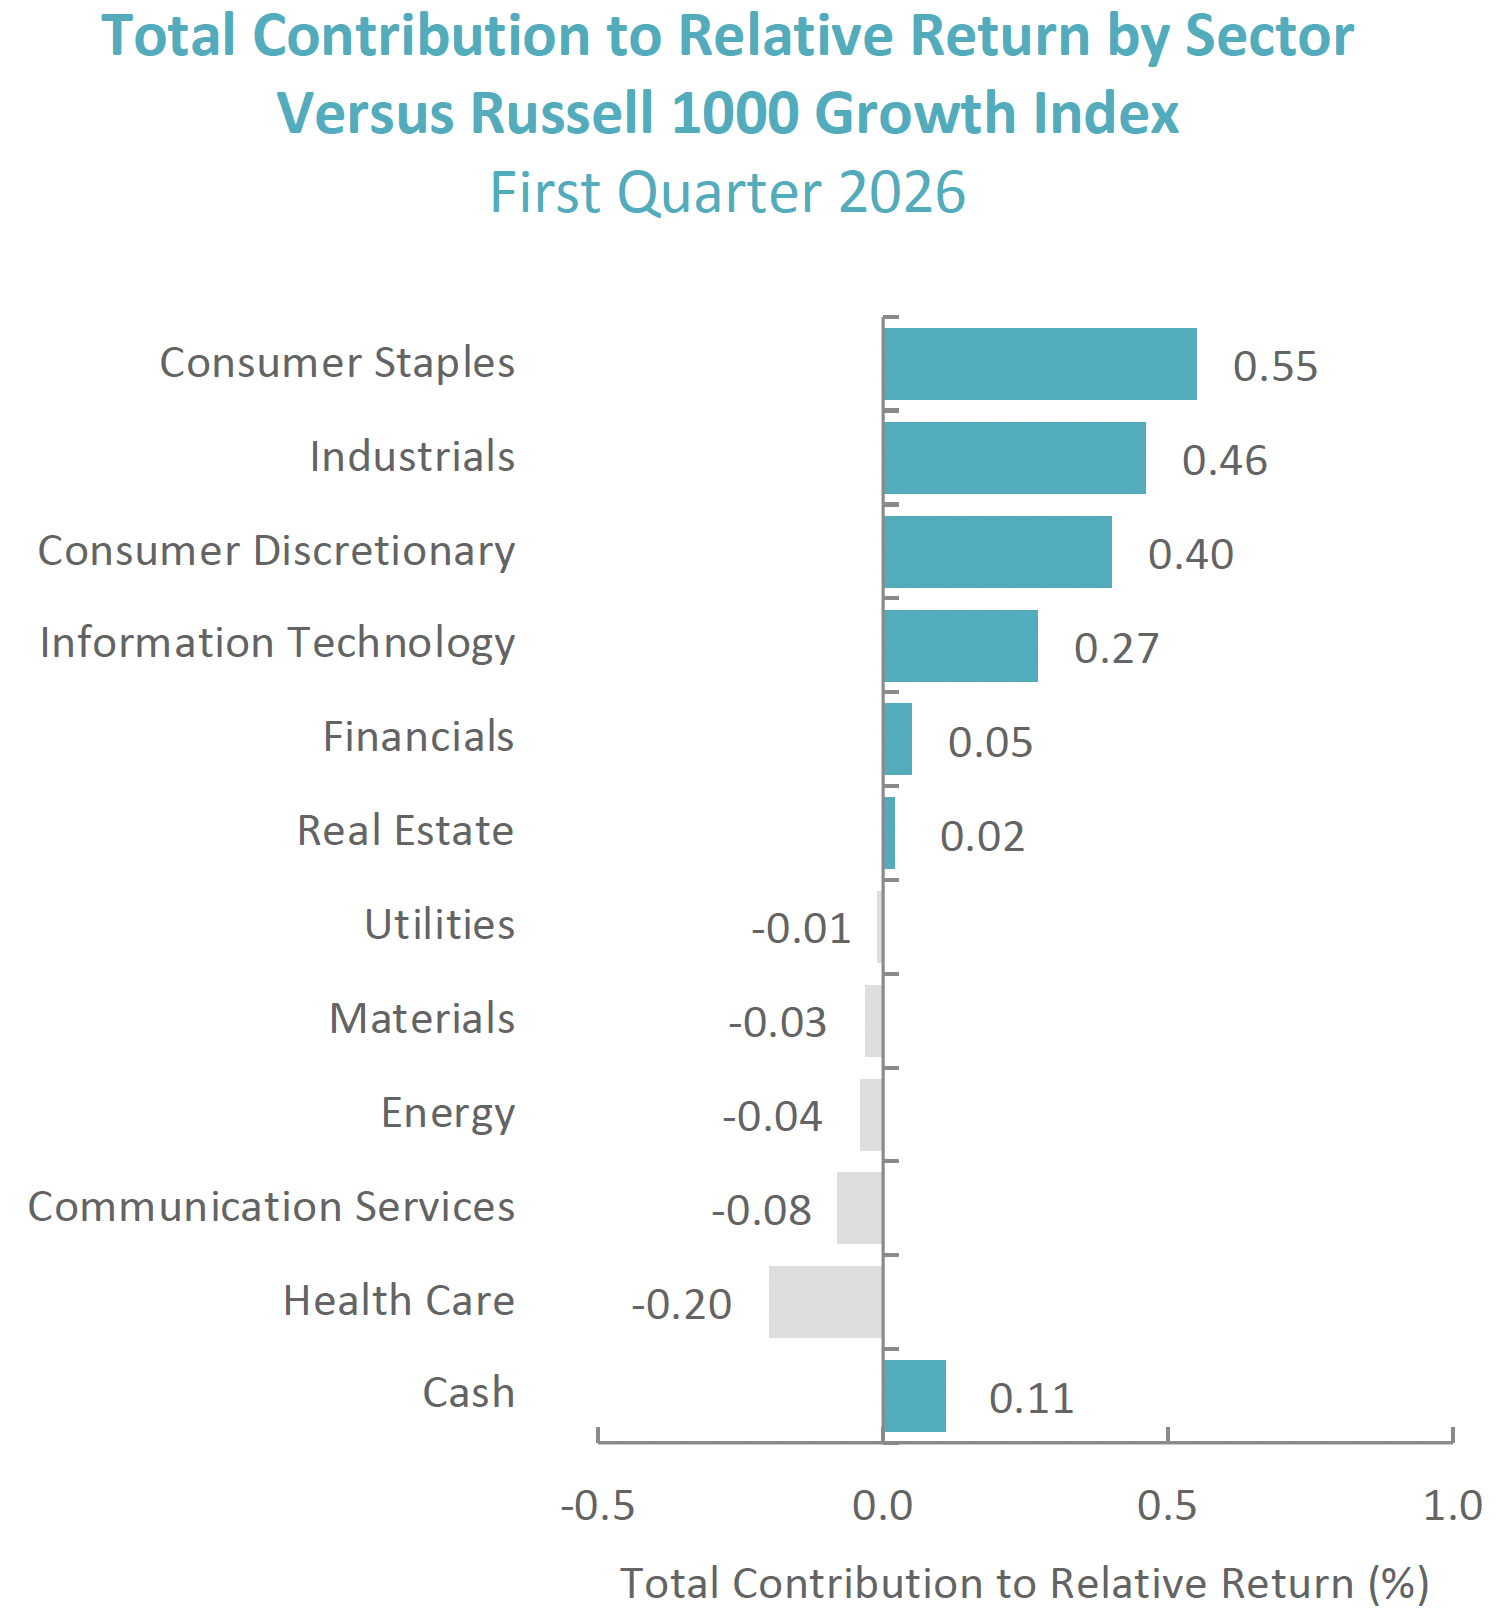
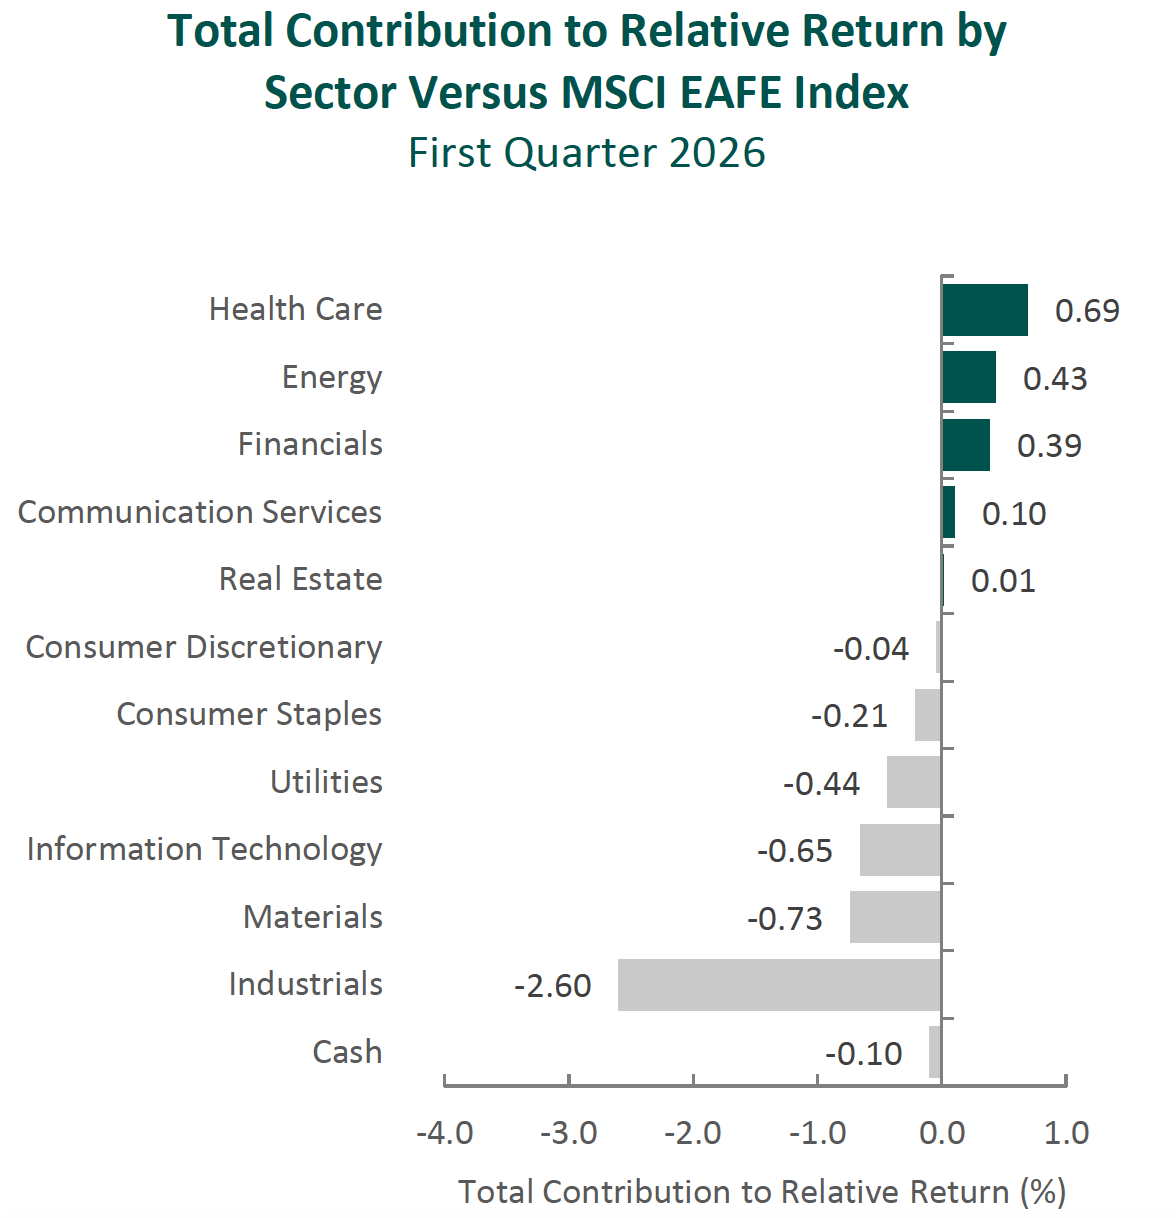
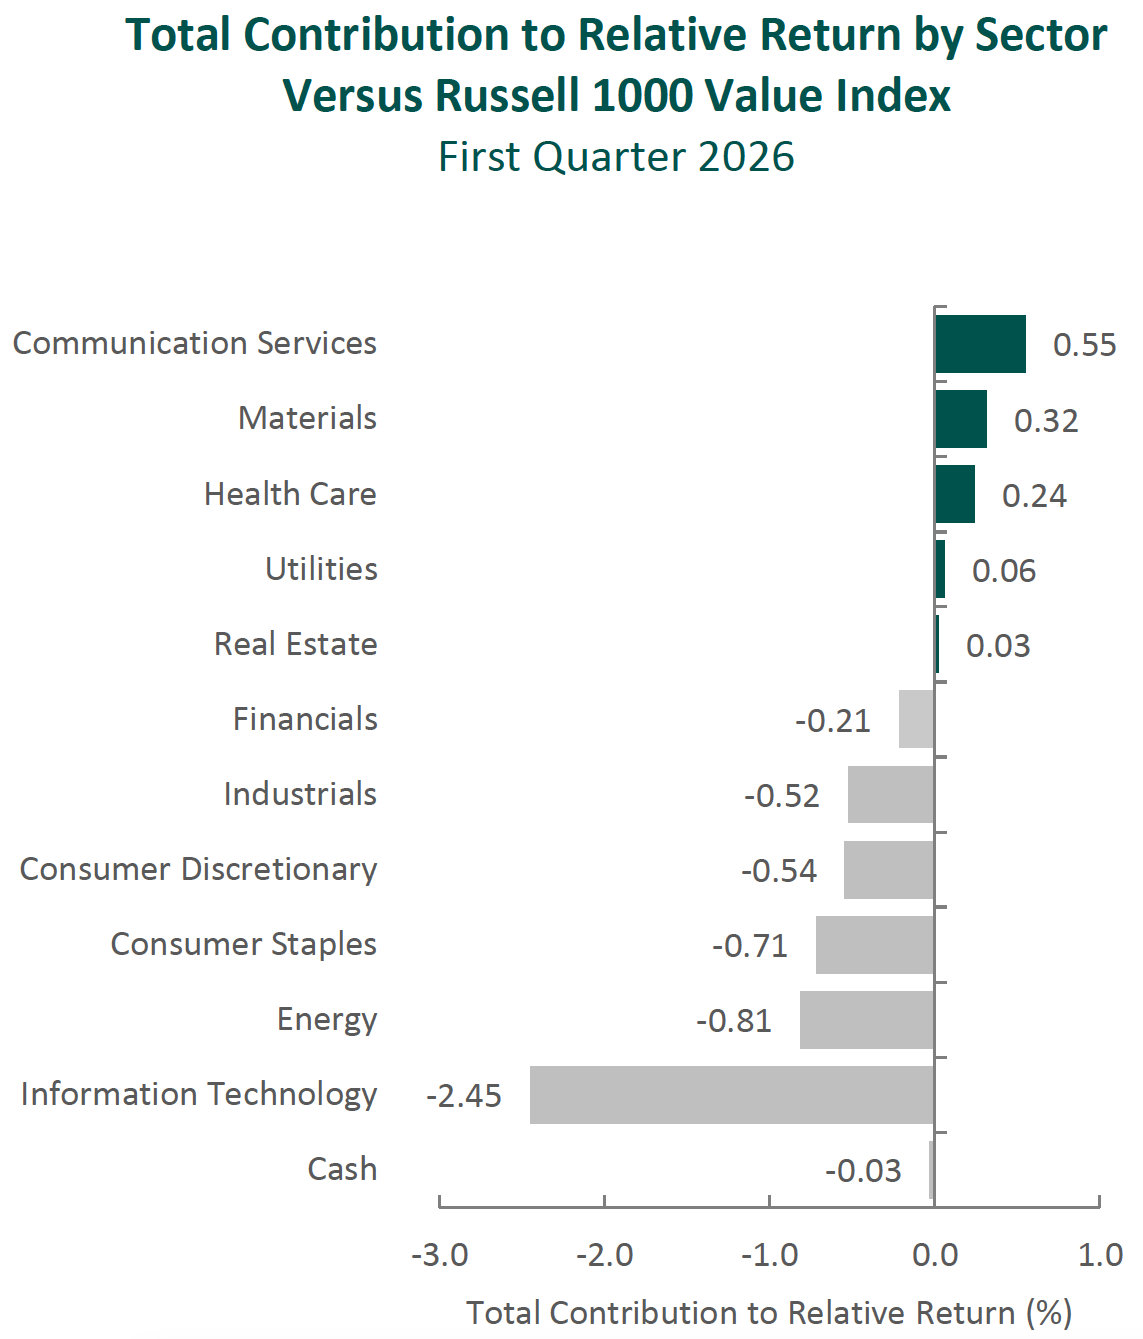
For the first quarter of 2026, the Aristotle Small/Mid Cap Equity Composite generated a total return of 3.37% net of fees (3.51% gross of fees), outperforming the 2.04% total return of the Russell 2500 Index. Both security selection and allocation effect positively contributed to performance. The largest contributors to relative performance was security selection in Information Technology and Financials coupled with an overweight allocation to Information Technology and an underweight allocation to Consumer Discretionary. Security selection in Industrials and Health Care (a combination of stocks we owned alongside not owning biotechnology) coupled with underweight allocations to Utilities and Communication Services detracted from performance.
| Relative Contributors | Relative Detractors |
|---|---|
| Advanced Energy Industries | SanDisk (not owned in the portfolio) |
| Ciena | Huron Consulting Group |
| Permian Resources | Haemonetics |
| MACOM Technology Solutions | Merit Medical Systems |
| Range Resources | Lumentum (not owned in the portfolio) |
CONTRIBUTORS
Advanced Energy Industries (AEIS), is a provider of power electronics conversion products. The stock extended a strong multi-quarter rally fueled by earnings revisions, AI‑related infrastructure spending, and improving semiconductor capital expenditure trends. We maintain our position, as we believe the company’s exposure to AI‑driven semiconductor and data‑center demand should continue to drive shareholder value.
Ciena (CIEN), is an optical networking equipment manufacturer for telecommunications and web scale network operators. The stock benefited from expectations for an eventual optical networking recovery, driven by accelerating data consumption, AI‑related traffic growth, and the company’s leadership in high‑speed coherent optical solutions and software driven networking. We believe the company has benefitted from strong demand for bandwidth given its differentiated product portfolio and history of technological innovation, which has produced strong operating results and shareholder value creation.
DETRACTORS
SanDisk (SNDK), engages in the development, manufacture, and provision of storage devices and solutions based on NAND flash technology. Its products include solid state drives, memory cards, and USB flash drives. The stock rallied during the quarter and was up 168% on improving memory cycle sentiment and AI‑driven storage demand. The portfolio did not own the position which resulted in a drag on relative performance versus the benchmark.
Huron Consulting Group (HURN), is a provider of technology, data, and analytics solutions to Healthcare, Education, and corporate clients. The company reported strong results and handily beat analyst expectations. Despite that, shares sold off amid market sentiment around AI potentially cannibalizing their business model which we believe is overly pessimistic. We maintain a position, as we believe the company may continue to benefit from durable demand, expanding margins, and secular growth tied to digital and regulatory complexity in their end markets over the long term.
Recent Portfolio Activity
| Buys/Acquisitions | Sells/Liquidations |
|---|---|
| Casella Waste Systems | Alight |
| Envista Holdings | Ciena |
BUYS/ACQUISITIONS
Casella Waste Systems (CWST), is a provider of solid waste management and recycling services. The company offers exposure to a resilient, recurring revenue waste management business operating in capacity constrained Northeast markets, where owned landfill and transfer assets create high barriers to entry and support pricing power. The company’s vertically integrated footprint and disciplined tuck‑in acquisition strategy enhance route density and cost synergies, supporting steady margin improvement, while stable contracted volumes and favorable long‑term industry dynamics underpin a clear path to further margin expansion and long‑term capital appreciation.
Envista Holdings (NVST), is a global manufacturer and marketer of dental consumables, equipment, diagnostics, orthodontic solutions, and treatment technologies, offering a comprehensive portfolio that includes implants, imaging systems, treatment software, and aligners. Dental care represents a structurally attractive, non‑discretionary end market, supported by aging demographics, increasing oral health awareness, and sustained demand for restorative and aesthetic procedures. Through its broad product portfolio and service capabilities, the company offers exposure to a growing, recurring‑revenue dental market, with meaningful margin recovery potential as management executes on operational initiatives, at an attractive valuation.
SELLS/LIQUIDATIONS
Alight (ALIT), is a provider of cloud-based integrated digital human capital and business solutions. The position was liquidated due to fundamentals deteriorating and an uncertain strategic outlook.
Ciena (CIEN), is an optical networking equipment manufacturer for telecommunications and web scale network operators. The position appreciated since purchase, resulting in its sale to redeploy capital to new opportunities with better risk/reward potential.
Outlook
We remain constructive on the long-term outlook for the small/mid-cap segment of the U.S. market. Valuations remain compelling relative to large caps, with the Russell 2500 Index trading near the lower end of its historical range, while earnings are beginning to reaccelerate. Consensus estimates point to small cap earnings growth surpassing large cap growth by late 2026, which should be supportive of small/mid cap allocations. Incremental increase in M&A activity, improving domestic manufacturing trends supported by reshoring and infrastructure investment, and a more favorable regulatory and tariff backdrop should provide longer term tailwinds for the asset class. Near term, we remain cautious as geopolitical risks, including the Iran conflict and related inflationary spillovers, may contribute to elevated volatility. Separately, mid-term election uncertainty has historically been associated with increased market volatility but has often given way to more durable small cap recoveries following the election cycle.
Positioning
Our current positioning is a function of our bottom-up security selection process and our ability to identify what we view as attractive investment candidates, regardless of economic sector definitions. Overweights in Information Technology and Materials are mostly a function of our underlying company specific views rather than any top-down predictions for each sector. Conversely, we continue to be underweight in Consumer Discretionary, as we have been unable to identify what we consider to be compelling long-term opportunities that fit our discipline given the rising risk profiles of many retail businesses and a potential deceleration in goods spending following a period of strength. We are also underweight in Real Estate as the sector has elevated interest rate sensitivity, refinancing risk, and structural challenges in segments such as office and retail, combined with generally weaker balance sheets, leading us to seek what we consider to be more attractive reward to risk opportunities. Given our focus on long-term business fundamentals, our patient investment approach and low portfolio turnover, the strategy’s sector positioning generally does not change significantly from quarter to quarter. However, we may take advantage of periods of volatility by adding selectively to certain companies when appropriate.
The opinions expressed herein are those of Aristotle Capital Boston, LLC (Aristotle Boston) and are subject to change without notice.
Past performance is not indicative of future results. The information provided in this report should not be considered financial advice or a recommendation to purchase or sell any particular security. There is no assurance that any securities discussed herein will remain in an account’s portfolio at the time you receive this report or that securities sold have not been repurchased. The securities discussed may not represent an account’s entire portfolio and, in the aggregate, may represent only a small percentage of an account’s portfolio holdings. The performance attribution presented is of a representative account from Aristotle Boston’s Small/Mid Cap Equity Composite. The representative account is a discretionary client account which was chosen to most closely reflect the investment style of the strategy. The criteria used for representative account selection is based on the account’s period of time under management and its similarity of holdings in relation to the strategy. It should not be assumed that any of the securities transactions, holdings or sectors discussed were or will be profitable, or that the investment recommendations or decisions Aristotle Boston makes in the future will be profitable or equal the performance of the securities discussed herein. Aristotle Boston reserves the right to modify its current investment strategies and techniques based on changing market dynamics or client needs. Recommendations made in the last 12 months are available upon request.
Returns are presented gross and net of investment advisory fees and include the reinvestment of all income. Gross returns will be reduced by fees and other expenses that may be incurred in the management of the account. Net returns are presented net of actual investment advisory fees and after the deduction of all trading expenses.
As of December 31, 2014, there were no non-fee-paying accounts in the Composite.
All investments carry a certain degree of risk, including the possible loss of principal. Investments are also subject to political, market, currency and regulatory risks or economic developments. International investments involve special risks that may in particular cause a loss in principal, including currency fluctuation, lower liquidity, different accounting methods and economic and political systems, and higher transaction costs. These risks typically are greater in emerging markets. While Large-capitalization companies may have more stable prices than smaller, less established companies, they are still subject to equity securities risk. In addition, large-capitalization equity security prices may not rise as much as prices of equity securities of small-capitalization companies. Securities of small- and medium-sized companies tend to have a shorter history of operations, be more volatile and less liquid. Value stocks can perform differently from the market as a whole and other types of stocks. The material is provided for informational and/or educational purposes only and is not intended to be and should not be construed as investment, legal or tax advice and/or a legal opinion. Investors should consult their financial and tax adviser before making investments. The opinions referenced are as of the date of publication, may be modified due to changes in the market or economic conditions, and may not necessarily come to pass. Information and data presented has been developed internally and/or obtained from sources believed to be reliable. Aristotle Boston does not guarantee the accuracy, adequacy or completeness of such information.
Aristotle Capital Boston, LLC is an independent investment adviser registered under the Investment Advisers Act of 1940, as amended. Registration does not imply a certain level of skill or training. More information about Aristotle Boston, including our investment strategies, fees and objectives, can be found in our Form ADV Part 2, which is available upon request. ACB-2604-17
Sources: CAPS Composite Hub, Russell Investments
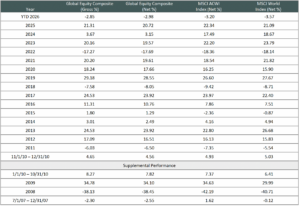
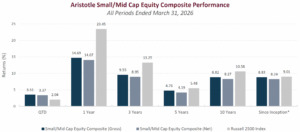
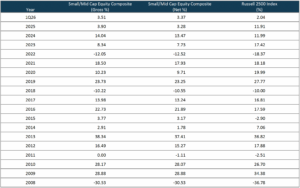
Composite returns for periods ended March 31, 2026, are final.
*The Aristotle Small/Mid Cap Equity Composite has an inception date of January 1, 2008, at a predecessor firm. During this time, Jack McPherson and Dave Adams had primary responsibility for managing the strategy. Performance starting January 1, 2015, was achieved at Aristotle Boston.
As of December 31, 2014, there were no non-fee-paying accounts in the Composite. Past performance is not indicative of future results. Performance results for periods greater than one year have been annualized.
Returns are presented gross and net of investment advisory fees and include the reinvestment of all income. Gross returns will be reduced by fees and other expenses that may be incurred in the management of the account. Net returns are presented net of actual investment advisory fees and after the deduction of all trading expenses. Please see important disclosures enclosed within this document.
The Russell 2500® Index measures the performance of the small to mid cap segment of the U.S. equity universe. The Russell 2500 Index is a subset of the Russell 3000® Index. It includes approximately 2500 of the smallest securities based on a combination of their market cap and current index membership. The Russell 2500 Growth® Index measures the performance of the small/mid cap companies located in the United States that also exhibit a growth probability. The Russell 2500 Value® Index measures the performance of the small/mid cap companies located in the United States that also exhibit a value probability. The volatility (beta) of the composite may be greater or less than the benchmarks. It is not possible to invest directly in these indices.