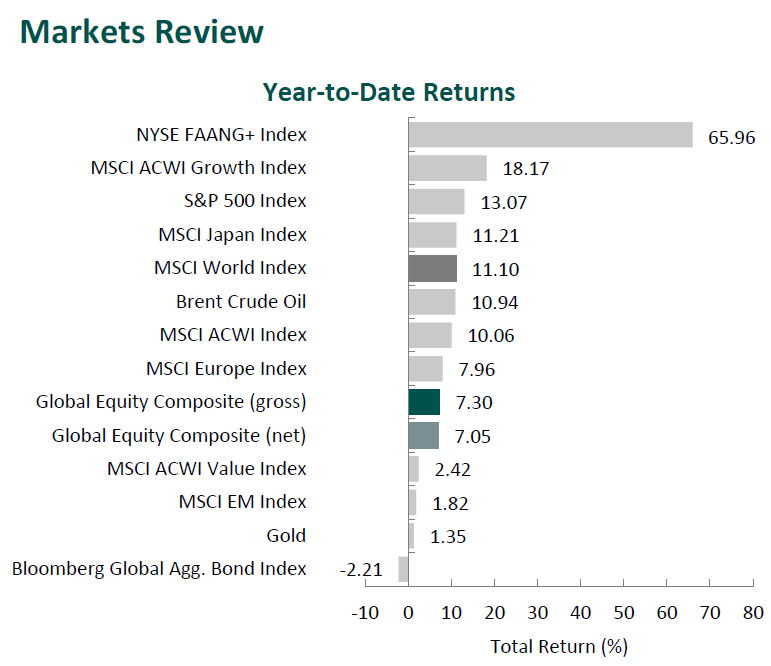
Markets Review

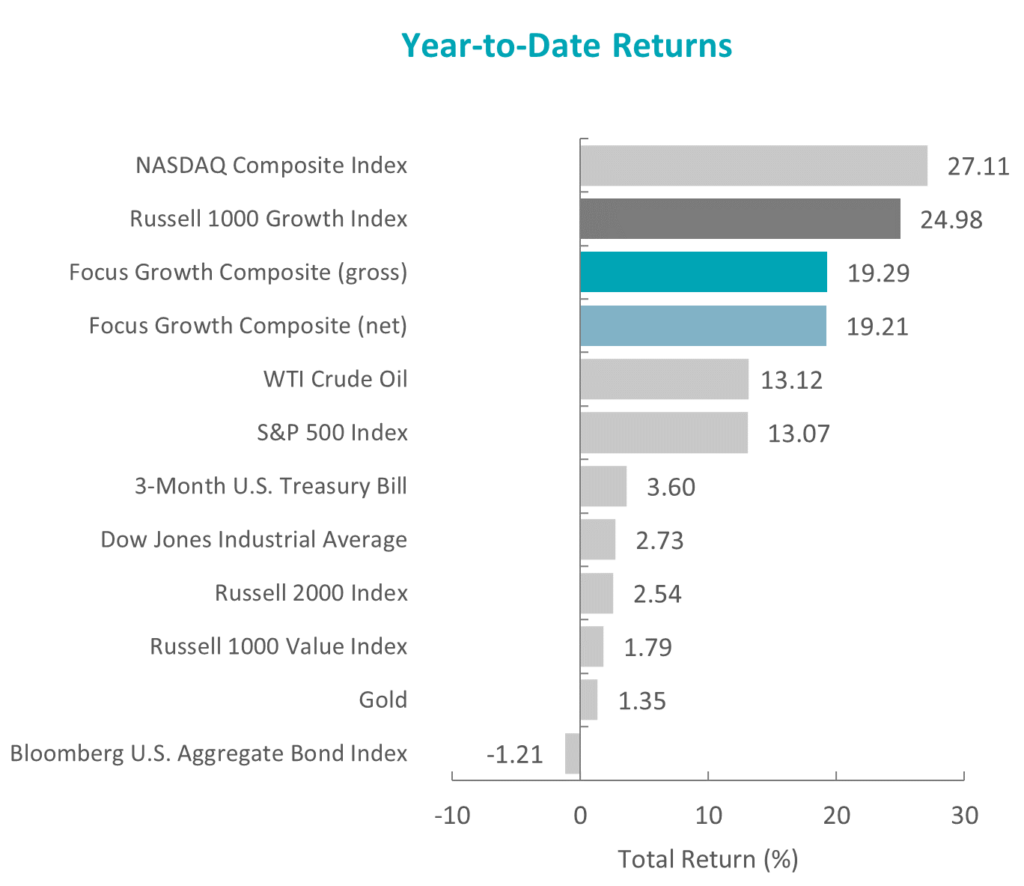
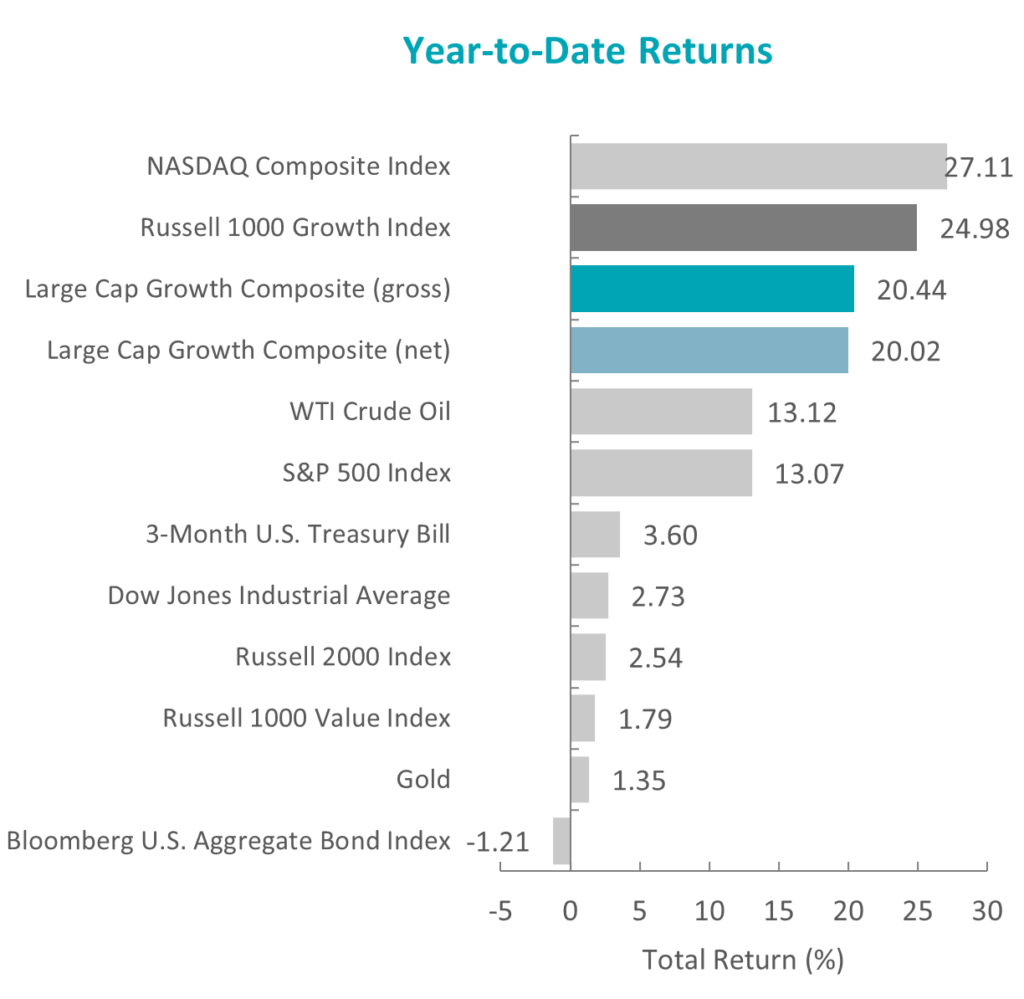
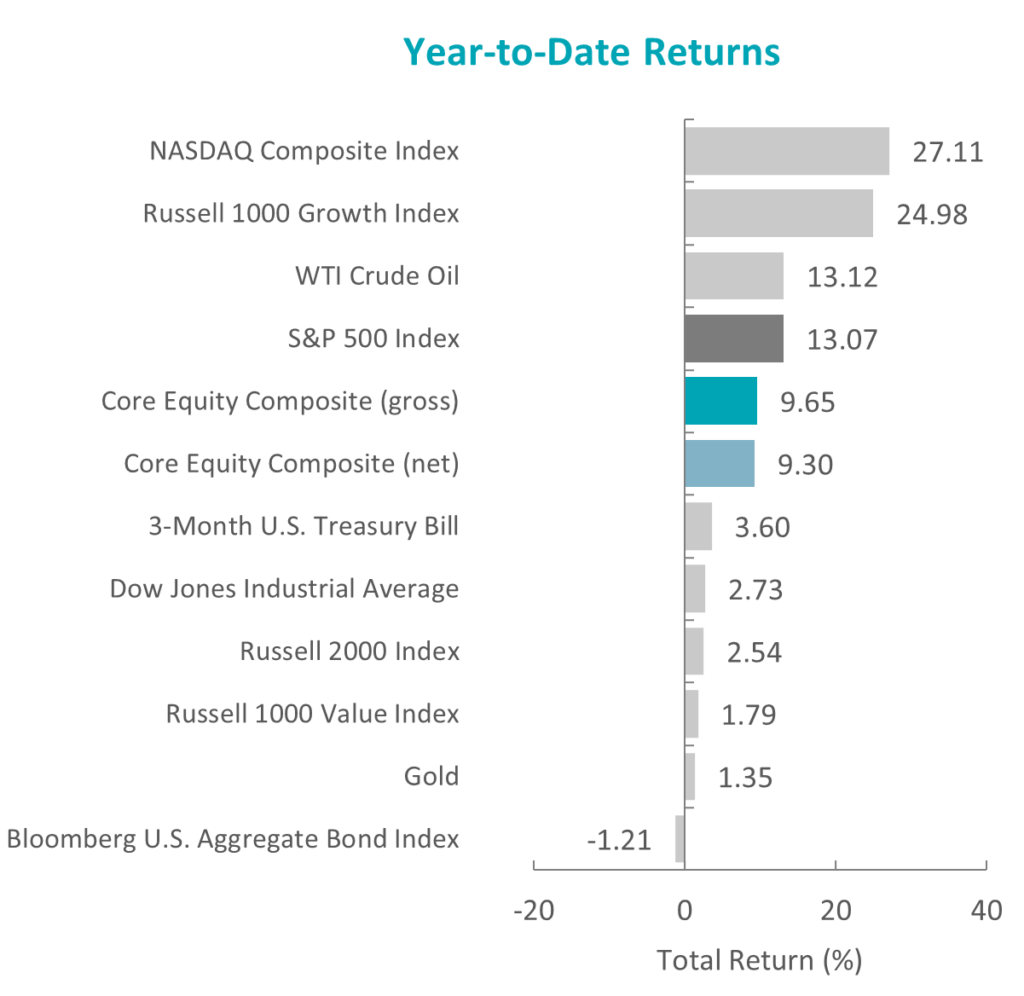
The U.S. equity market finished higher for the first quarter of the year, as the S&P 500 Index rose 7.50% during the period. Concurrently, the Bloomberg U.S. Aggregate Bond Index increased 2.96% for the quarter. In terms of style, the Russell 1000 Growth Index outperformed its value counterpart by 13.36% during the quarter.

Sources: SS&C Advent, Bloomberg
Past performance is not indicative of future results. Aristotle Atlantic Focus Growth Composite returns are presented gross and net of investment advisory fees and include the reinvestment of all income. Gross returns will be reduced by fees and other expenses that may be incurred in the management of the account. Net returns are presented net of actual investment advisory fees and after the deduction of all trading expenses. Aristotle Atlantic Composite returns are preliminary pending final account reconciliation. Please see important disclosures at the end of this document.

Seven out of the eleven sectors within the Russell 1000 Value Index finished higher for the quarter, with Communication Services, Information Technology and Consumer Discretionary gaining the most. Meanwhile, Health Care, Financials and Energy were the worst-performing sectors.

Although inflation remained well above its historical average of 3.26%, the pace of price increases moderated during the quarter. As such, for the 12-month periods ending in January and February, annualized CPI figures declined from 6.4% to 6.0%, respectively. The pattern of disinflation was partly driven by decreases in the price of fuel, used vehicles and medical care services. The government also reported a deceleration in U.S. economic growth, as GDP increased 2.6% in the fourth quarter following the third quarter’s 3.2% increase. Weaker consumer spending and business investment were significant factors in the softer results. However, retail sales in January jumped 3%, and the labor market remained tight, with an unemployment rate of 3.6%.

While some economic data points trended in a positive direction, the market was shocked with the regulatory shutdown of Silicon Valley Bank (SVB), the second-largest bank failure by assets in U.S. history. The value of SVB’s bond holdings had plunged amid rapidly increasing interest rates, creating a shortfall as clients (largely composed of tech startups) withdrew their deposits, eventually leading to a run on the bank’s deposits. Just days later, regulators also took control of New York-based Signature Bank. The speed and size of the bank failures sent U.S. bank share prices tumbling. To provide stability, the Federal Reserve announced the creation of an emergency lending facility that would allow banks to deposit high-quality assets (e.g., Treasuries and mortgage-backed securities) in exchange for a cash advance worth the face value of the asset (instead of the market value). Additionally, First Citizens Bank announced that it had made an agreement with the Federal Deposit Insurance Corporation (FDIC) for a whole bank purchase with loss share coverage of Silicon Valley Bridge Bank.1

Despite the turmoil in the banking system, the Federal Reserve (Fed) stayed its course, increasing its benchmark rate by 0.25% in March (its ninth consecutive rate hike) to a range of 4.75% to 5.00%. However, noting that banking events may contribute to a more restrictive credit environment, the Fed tempered its stance that further rate increases are necessary to restore price stability and achieve its 2% inflation target. Rather, Fed Chair Powell emphasized the reliance on incoming data to inform the future path of monetary policy, as conditions may have tightened more than economic indices currently suggest.

On the corporate earnings front, results and guidance were broadly underwhelming, with only 68% of S&P 500 companies exceeding EPS estimates (below the five-year average of 77%) and 67% of companies providing negative EPS guidance (above the five-year average of 59%). Overall, the S&P 500 companies reported a decline in earnings of 4.9% as inflation and recession remained prevalent topics, with 332 and 148 companies mentioning those words on earnings calls, respectively. Nevertheless, in spite of the weaker-than-expected results, there have also been positive remarks of cost cutting, moderating input price pressures and better supply-chain dynamics.

Performance and Attribution Summary

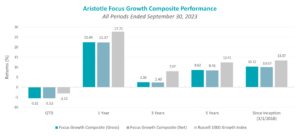
For the first quarter of 2023, Aristotle Atlantic’s Focus Growth Composite posted a total return of 13.05% net of fees (13.07% gross of fees), underperforming the 14.37% total return of the Russell 1000 Growth Index.

Performance (%)1Q231 Year3 Years5 YearsSince Inception*
Focus Growth Composite (gross)13.07-16.8012.8610.6810.21
Focus Growth Composite (net)13.05-16.8912.7510.429.95
Russell 1000 Growth Index14.37-10.9018.5813.6512.79
*The Focus Growth Composite has an inception date of March 1, 2018. Past performance is not indicative of future results. Aristotle Atlantic Focus Growth Composite returns are presented gross and net of investment advisory fees and include the reinvestment of all income. Gross returns will be reduced by fees and other expenses that may be incurred in the management of the account. Net returns are presented net of actual investment advisory fees and after the deduction of all trading expenses. Aristotle Atlantic Composite returns are preliminary pending final account reconciliation. Please see important disclosures at the end of this document.

Sources: FactSet
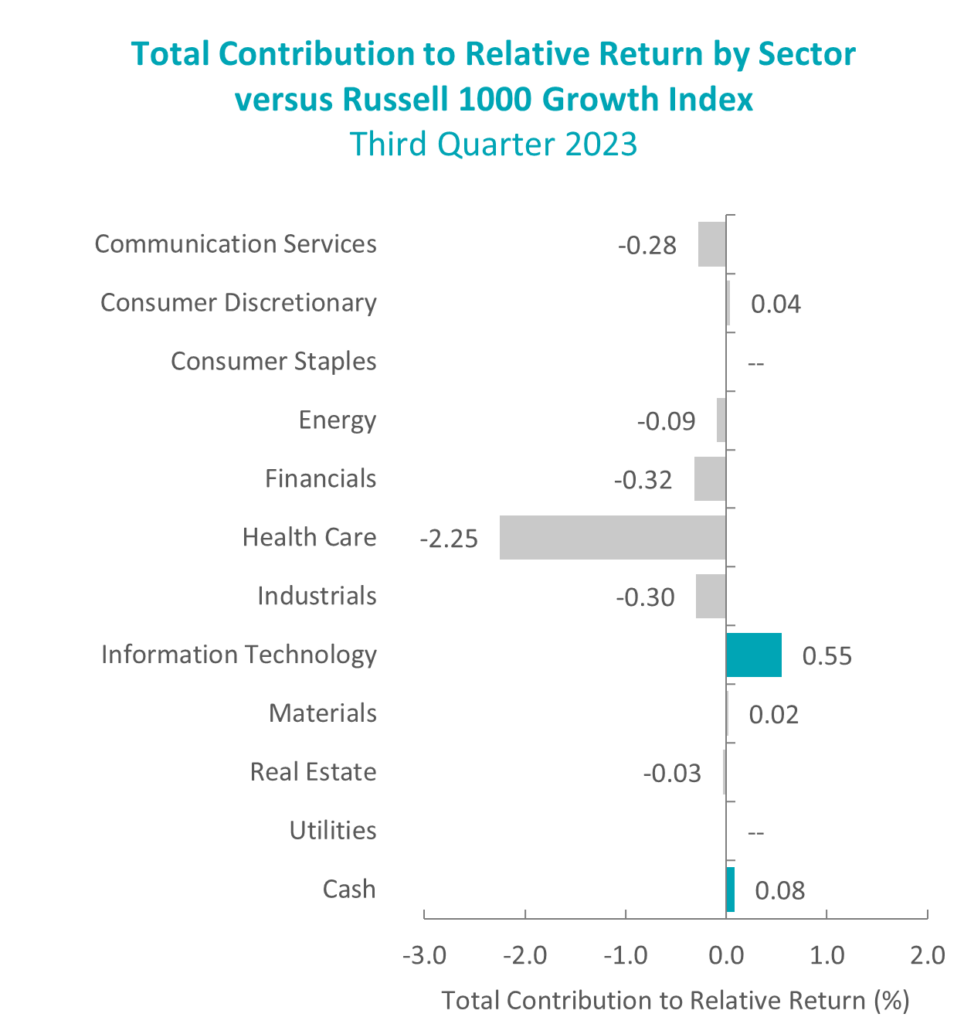
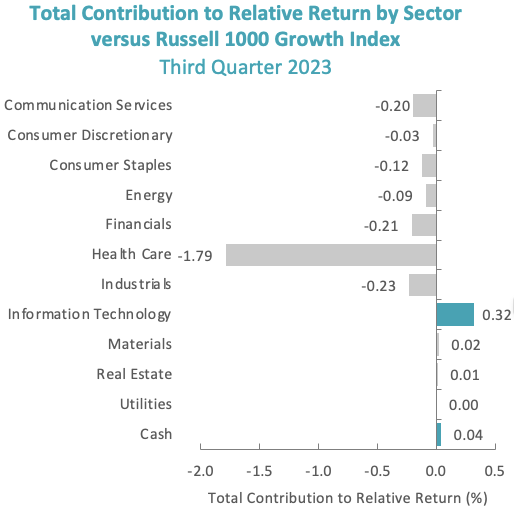
Past performance is not indicative of future results. Attribution results are based on sector returns which are gross of investment advisory fees. Attribution is based on performance that is gross of investment advisory fees and includes the reinvestment of income. Please see important disclosures at the end of this document.

During the first quarter, the portfolio’s underperformance relative to the Russell 1000 Growth Index was due to allocation effects, while security selection modestly contributed. Security selection in Consumer Discretionary and Consumer Staples, as well as an overweight in Health Care detracted the most from performance. Conversely, security selection in Information Technology, Financials and Health Care contributed to relative results.

Contributors and Detractors for 1Q 2023

Relative ContributorsRelative Detractors
NvidiaTesla
MSCIDollar General
IDEXX LaboratoriesDarling Ingredients
CrowdStrike HoldingsNorfolk Southern
ON SemiconductorBio-Techne

Contributors

Nvidia

Nvidia contributed to outperformance, as the company announced better-than-expected fourth quarter earnings driven by a strong rebound in Gaming and an improving outlook for the Datacenter business due to the acceleration of Graphics Processing Unit (GPU) driven Artifical Intelligence (AI) deployment. The company also hosted its Global Technology Conference (GTC) in March where it further highlighted its leading technology being used to develop AI Large Language Models (LLM). The company announced new partnerships with hyperscalers for its AI cloud-based service while also releasing new software and hardware offerings that will support GPU-driven AI growth.  Nvidia continues to see a growing addressable market for its products and services as AI uses become more prevalent.

MSCI

MSCI contributed to performance in the first quarter following better-than-expected fourth quarter earnings results, highlighting the company’s ability to grow despite macroeconomic headwinds. Management continued focusing on expense efficiency gains while investing in long-term growth opportunities. MSCI reiterated its bullish view on its ESG/Climate business outlook.

Detractors

Tesla

Tesla was a negative contributor to performance due to our underweight position relative to Russell 1000 Growth Index, as the company had strong performance in Q1. The strength occurred after the company partially reversed a previously announced price cut for its electric vehicles following a period of strong demand. Tesla also reported better-than-expected results for Q4 2022 during the first quarter. 

Dollar General

Dollar General shares underperformed on a rotation out of more defensive consumer names at the start of the year despite growing concerns of a slowdown in the economy and the coinciding effects on consumer spending.  During the first quarter, Dollar General reported solid comps, as their core lower-income consumer remained resilient despite rising inflation.    

Recent Portfolio Activity

The table below shows all buys and sells completed during the quarter, followed by a brief rationale.

BuysSells
ON SemiconductorHorizon Therapeutics
Tesla

Buys

ON Semiconductor

ON Semiconductor supplies analog, standard logic and discrete semiconductors for data and power management. The company provides industry leading intelligent sensing and power solutions to help its customers solve the most challenging problems and create cutting edge products for a better future. Its extensive portfolio of sensors, power management, connectivity, custom and SoC, analog, logic, timing and discrete devices helps customers efficiently solve design challenges in advanced electronic systems and products. ON Semiconductor’s devices perform power and signal control, and interface functions appear in a wide range of end-user markets including automotive, communications, computing, consumer, medical, industrial, networking, telecom and aerospace/defense. Most of ON Semiconductor’s sales come from the Asia/Pacific region.

We see ON Semiconductor attractively valued and leveraged to attractive areas of end-market growth over the next few years. The company is gaining both semiconductor content and seeing better pricing tailwinds due to demand exceeding supply and more complex semiconductor content. We see these trends continuing to provide 2023 tailwinds and fully expect strong growth rates in electric vehicle penetration over the next five years.

Tesla

Tesla Motors designs, develops, manufactures, and markets high-performance, technologically advanced electric cars and solar energy generation and energy storage products. Tesla sells more than five fully electric cars, among others, the Model X and Y SUVs, as well as the Model S sedan and Model 3 sedan. The company has a growing global network of Tesla Superchargers, which are industrial grade, high-speed vehicle chargers, typically placed along well-traveled routes and in and around dense city centers to allow Tesla owners quick and reliable charging. Tesla offers certain advanced driver assist systems under its Autopilot and Full Self-Driving options. US customers generate nearly half of Tesla’s sales.

We see Tesla as the leading manufacturer of battery powered electric vehicles (EVs). The company has achieved scaled production of EVs before the other large automobile manufacturers.  The company’s technology in battery production and self-driving technology is more mature than competitors’ offerings.  EVs are one of the fastest growing categories within automobile manufacturing. The profit margin in the automotive segment is significantly above automotive competitors which provides the company flexibility to price its vehicles more strategically as the competition eventually scales up their EV production. The direct-to-consumer sales model gives the company more control over its relationship with its customers as well as a source of higher profit margin since there is no dealership share of the profits.

Sells

Horizon Therapeutics

We sold Horizon after Amgen announced their intention to acquire Horizon for $116.50 per share. The deal is expected to close in mid-year 2023.

Outlook

The impact of the Federal Reserve tightening cycle and the banking issues of the past month added to the concern of a potential economic recession. With goods inflation largely under control, labor costs will remain the focal point to achieving the stated goal of 2% inflation. With the labor market still tight, the Federal Reserve may well raise rates another 25 basis points with the peak in Fed Funds at 5.00% to 5.25%. Fed Funds Futures continue to point to the potential for a pivot into an easing cycle and this has supported the rise in equity prices. We believe the most likely outcome is for the Federal Reserve to pause for a period to access the impact to inflation of the rise in interest rates and shrinking of the balance sheet. Equity markets will focus on the impact this has had on the economy and the potential for a contraction in corporate profits. Equity valuation levels remain elevated and with the prospects for a decline in profits this sets up for a difficult path for higher equity prices.  The major support continues to be the prospect of a shift to a Federal Reserve easing cycle. Little progress has been made in dealing with the Debt Ceiling which will add a level of uncertainty and volatility to markets. With the war in Ukraine passing the one-year mark, there has been no progress toward a resolution adding to the uncertainty. With many of the sizable legislative packages passed now entering the phase of rule writing, markets will have more clarity on where these funds will flow. This should be one of the bright spots in a challenging economic outlook. Our focus will continue to be at the company level, with an emphasis on seeking to invest in companies with secular tailwinds or strong product-driven cycles.

1https://www.fdic.gov/news/press-releases/2023/pr23019.html

Disclosures

The opinions expressed herein are those of Aristotle Atlantic Partners, LLC (Aristotle Atlantic) and are subject to change without notice. Past performance is not a guarantee or indicator of future results. This material is not financial advice or an offer to purchase or sell any product. You should not assume that any of the securities transactions, sectors or holdings discussed in this report were or will be profitable, or that recommendations Aristotle Atlantic makes in the future will be profitable or equal the performance of the listed in this report. The portfolio characteristics shown relate to the Aristotle Atlantic Focus Growth strategy. Not every client’s account will have these characteristics. Aristotle Atlantic reserves the right to modify its current investment strategies and techniques based on changing market dynamics or client needs. There is no assurance that any securities discussed herein will remain in an account’s portfolio at the time you receive this report or that securities sold have not been repurchased. The securities discussed may not represent an account’s entire portfolio and, in the aggregate, may represent only a small percentage of an account’s portfolio holdings. The performance attribution presented is of a representative account from Aristotle Atlantic’s Focus Growth Composite. The representative account is a discretionary client account which was chosen to most closely reflect the investment style of the strategy. The criteria used for representative account selection is based on the account’s period of time under management and its similarity of holdings in relation to the strategy. Recommendations made in the last 12 months are available upon request. Returns are presented gross and net of investment advisory fees and include the reinvestment of all income. Gross returns will be reduced by fees and other expenses that may be incurred in the management of the account. Net returns are presented net of actual investment advisory fees and after the deduction of all trading expenses.

All investments carry a certain degree of risk, including the possible loss of principal. Investments are also subject to political, market, currency and regulatory risks or economic developments. International investments involve special risks that may in particular cause a loss in principal, including currency fluctuation, lower liquidity, different accounting methods and economic and political systems, and higher transaction costs. These risks typically are greater in emerging markets. Securities of small‐ and medium‐sized companies tend to have a shorter history of operations, be more volatile and less liquid. Value stocks can perform differently from the market as a whole and other types of stocks.

The material is provided for informational and/or educational purposes only and is not intended to be and should not be construed as investment, legal or tax advice and/or a legal opinion. Investors should consult their financial and tax adviser before making investments. The opinions referenced are as of the date of publication, may be modified due to changes in the market or economic conditions, and may not necessarily come to pass. Information and data presented has been developed internally and/or obtained from sources believed to be reliable. Aristotle Atlantic does not guarantee the accuracy, adequacy or completeness of such information.

Aristotle Atlantic Partners, LLC is an independent registered investment adviser under the Advisers Act of 1940, as amended. Registration does not imply a certain level of skill or training. More information about Aristotle Atlantic, including our investment strategies, fees and objectives, can be found in our Form ADV Part 2, which is available upon request.  AAP-2304-31

Performance Disclosures

Composite returns for all periods ended March 31, 2023 are preliminary pending final account reconciliation.

Past performance is not indicative of future results. Performance results for periods greater than one year have been annualized. Returns are presented gross and net of investment advisory fees and include the reinvestment of all income. Gross returns will be reduced by fees and other expenses that may be incurred in the management of the account. Net returns are presented net of actual investment advisory fees and after the deduction of all trading expenses.

Index Disclosures

The Russell 1000® Growth Index measures the performance of the large cap growth segment of the U.S. equity universe. It includes those Russell 1000 companies with higher price-to-book ratios and higher forecasted growth values. This index has been selected as the benchmark and is used for comparison purposes only. The Russell 1000® Value Index measures the performance of the large cap value segment of the U.S. equity universe. It includes those Russell 1000 companies with lower price-to-book ratios and lower expected growth values. The S&P 500® Index is the Standard & Poor’s Composite Index of 500 stocks and is a widely recognized, unmanaged index of common stock prices. The Russell 2000® Index measures the performance of the small cap segment of the U.S. equity universe. The Russell 2000 Index is a subset of the Russell 3000® Index representing approximately 10% of the total market capitalization of that index. It includes approximately 2,000 of the smallest securities based on a combination of their market cap and current index membership. The Dow Jones Industrial Average® is a price-weighted measure of 30 U.S. blue-chip companies. The Index covers all industries except transportation and utilities. The NASDAQ Composite Index measures all NASDAQ domestic and international based common type stocks listed on The NASDAQ Stock Market. The NASDAQ Composite includes over 3,000 companies, more than most other stock market indices. The Bloomberg U.S. Aggregate Bond Index is an unmanaged index of domestic investment grade bonds, including corporate, government and mortgage-backed securities. The WTI Crude Oil Index is a major trading classification of sweet light crude oil that serves as a major benchmark price for oil consumed in the United States. The 3-Month U.S. Treasury Bill is a short-term debt obligation backed by the U.S. Treasury Department with a maturity of three months.  The Consumer Price Index (CPI) is a measure of the average change over time in the prices paid by urban consumers for a market basket of consumer goods and services. While stock selection is not governed by quantitative rules, a stock typically is added only if the company has an excellent reputation, demonstrates sustained growth and is of interest to a large number of investors. The volatility (beta) of the Composite may be greater or less than its respective benchmarks. It is not possible to invest directly in these indices.

Markets Review

The U.S. equity market finished higher for the first quarter of the year, as the S&P 500 Index rose 7.50% during the period. Concurrently, the Bloomberg U.S. Aggregate Bond Index increased 2.96% for the quarter. In terms of style, the Russell 1000 Growth Index outperformed its value counterpart by 13.36% during the quarter.

Sources: SS&C Advent, Bloomberg
Past performance is not indicative of future results. Aristotle Atlantic Large Cap Growth Composite returns are presented gross and net of investment advisory fees and include the reinvestment of all income. Gross returns will be reduced by fees and other expenses that may be incurred in the management of the account. Net returns are presented net of actual investment advisory fees and after the deduction of all trading expenses. Aristotle Atlantic Composite returns are preliminary pending final account reconciliation. Please see important disclosures at the end of this document.

Seven out of the eleven sectors within the Russell 1000 Value Index finished higher for the quarter, with Communication Services, Information Technology and Consumer Discretionary gaining the most. Meanwhile, Health Care, Financials and Energy were the worst-performing sectors.

While some economic data points trended in a positive direction, the market was shocked with the regulatory shutdown of Silicon Valley Bank (SVB), the second-largest bank failure by assets in U.S. history. The value of SVB’s bond holdings had plunged amid rapidly increasing interest rates, creating a shortfall as clients (largely composed of tech startups) withdrew their deposits, eventually leading to a run on the bank’s deposits. Just days later, regulators also took control of New York-based Signature Bank. The speed and size of the bank failures sent U.S. bank share prices tumbling. To provide stability, the Federal Reserve announced the creation of an emergency lending facility that would allow banks to deposit high-quality assets (e.g., Treasuries and mortgage-backed securities) in exchange for a cash advance worth the face value of the asset (instead of the market value). Additionally, First Citizens Bank announced that it had made an agreement with the Federal Deposit Insurance Corporation (FDIC) for a whole bank purchase with loss share coverage of Silicon Valley Bridge Bank.1

Despite the turmoil in the banking system, the Federal Reserve (Fed) stayed its course, increasing its benchmark rate by 0.25% in March (its ninth consecutive rate hike) to a range of 4.75% to 5.00%. However, noting that banking events may contribute to a more restrictive credit environment, the Fed tempered its stance that further rate increases are necessary to restore price stability and achieve its 2% inflation target. Rather, Fed Chair Powell emphasized the reliance on incoming data to inform the future path of monetary policy, as conditions may have tightened more than economic indices currently suggest.

On the corporate earnings front, results and guidance were broadly underwhelming, with only 68% of S&P 500 companies exceeding EPS estimates (below the five-year average of 77%) and 67% of companies providing negative EPS guidance (above the five-year average of 59%). Overall, the S&P 500 companies reported a decline in earnings of 4.9% as inflation and recession remained prevalent topics, with 332 and 148 companies mentioning those words on earnings calls, respectively. Nevertheless, in spite of the weaker-than-expected results, there have also been positive remarks of cost cutting, moderating input price pressures and better supply-chain dynamics a sector basis, nine out of eleven sectors within the Russell 1000 Growth Index finished higher for the quarter, with Utilities, Industrials and Health Care gaining the most. Meanwhile, Consumer Discretionary and Communication Services posted the largest declines and Information Technology rose the least.

Performance and Attribution Summary

For the first quarter of 2023, Aristotle Atlantic’s Large Cap Growth Composite posted a total return of 12.16% net of fees (12.26% gross of fees), underperforming the 14.37% total return of the Russell 1000 Growth Index.

Performance (%) 1Q231 Year3 Years5 YearsSince Inception*
Large Cap Growth Composite (gross)12.26-14.7615.3812.2615.01
Large Cap Growth Composite (net)12.16-15.0414.9511.8314.57
Russell 1000 Growth Index14.37-10.9018.5813.6516.00

*The Large Cap Growth Composite has an inception date of November 1, 2016. Past performance is not indicative of future results. Aristotle Atlantic Large Cap Growth Equity Composite returns are presented gross and net of investment advisory fees and include the reinvestment of all income. Gross returns will be reduced by fees and other expenses that may be incurred in the management of the account. Net returns are presented net of actual investment advisory fees and after the deduction of all trading expenses. Aristotle Atlantic Composite returns are preliminary pending final account reconciliation. Please see important disclosures at the end of this document.

Sources: FactSet
Past performance is not indicative of future results. Attribution results are based on sector returns which are gross of investment advisory fees. Attribution is based on performance that is gross of investment advisory fees and includes the reinvestment of income. Please see important disclosures at the end of this document.

During the first quarter, the portfolio’s underperformance relative to the Russell 1000 Growth Index was due to security selection and allocation effects. Security selection in Consumer Discretionary and Industrials, as well as an overweight in Health Care, detracted the most from relative performance. Conversely, security selection in Information Technology and Health Care, as well as a lack of exposure to Energy, contributed to relative returns.

Contributors and Detractors for 1Q 2023

Relative ContributorsRelative Detractors
NvidiaTesla
ON SemiconductorNorfolk Southern
CrowdStrike HoldingsHome Depot
Tenable HoldingsBio-Techne
UnitedHealth GroupDarling Ingredients

Contributors

Nvidia

Nvidia contributed to outperformance, as the company announced better-than-expected fourth quarter earnings driven by a strong rebound in Gaming and an improving outlook for the Datacenter business due to the acceleration of Graphics Processing Unit (GPU) driven Artifical Intelligence (AI) deployment. The company also hosted its Global Technology Conference (GTC) in March where it further highlighted its leading technology being used to develop AI Large Language Models (LLM). The company announced new partnerships with hyperscalers for its AI cloud-based service while also releasing new software and hardware offerings that will support GPU-driven AI growth. Nvidia continues to see a growing addressable market for its products and services as AI uses become more prevalent.

ON Semiconductor

ON Semiconductors contributed to outperformance, as the company’s fourth quarter earnings were slightly better than expected and the company’s outlook supports continued strength in the Silicon Carbide (SiC) market growth for EV customers. The company also announced another new key customer win to supply BMW with SiC for its EV, and this further builds on the company’s long-term supply agreement pipeline. The company continues to reiterate its SiC growth target for 2023 and expects gross margins to continue to improve, as its new SiC production facilities ramp.

Detractors

Tesla

Tesla was a negative contributor to performance due to our underweight position relative to Russell 1000 Growth Index, as the company had strong performance in Q1. The strength occurred after the company partially reversed a previously announced price cut for its electric vehicles following a period of strong demand. Tesla also reported better-than-expected results for Q4 2022 during the first quarter.

Norfolk Southern

Norfolk Southern underperformed in the first quarter of 2023 following the derailment of a train in Ohio in early February. Although there were no fatalities or injuries in the accident, chemical spills and a controlled burn of the contents of some tanker cars raised concern for long-term environmental impact, the associated cost of the cleanup and the increased risk of more stringent government regulations.

Recent Portfolio Activity

The table below shows all buys and sells completed during the quarter, followed by a brief rationale.

BuysSells
ON SemiconductorHorizon Therapeutics
Enphase EnergyDynatrace
Chart Industries
BioMarin Pharmaceutical
Tesla

Buys

ON Semiconductor

ON Semiconductor supplies analog, standard logic and discrete semiconductors for data and power management. The company provides industry leading intelligent sensing and power solutions to help its customers solve the most challenging problems and create cutting edge products for a better future. Its extensive portfolio of sensors, power management, connectivity, custom and SoC, analog, logic, timing and discrete devices helps customers efficiently solve design challenges in advanced electronic systems and products. ON Semiconductor’s devices perform power and signal control, and interface functions appear in a wide range of end-user markets including automotive, communications, computing, consumer, medical, industrial, networking, telecom and aerospace/defense. Most of ON Semiconductor’s sales come from the Asia/Pacific region.

We see ON Semiconductor attractively valued and leveraged to attractive areas of end-market growth over the next few years. The company is gaining both semiconductor content and seeing better pricing tailwinds due to demand exceeding supply and more complex semiconductor content. We see these trends continuing to provide 2023 tailwinds and fully expect strong growth rates in electric vehicle penetration over the next five years.

Enphase Energy

Enphase Energy designs, develops, manufactures and sells home energy solutions in the U.S. and internationally for the solar industry. The company is the world’s leading manufacturer of microinverters that convert solar-generated D.C. energy to A.C. energy usable in homes and buildings. Enphase introduced the world’s first microinverter system in 2008 and has expanded its offerings to include battery storage systems and proprietary technologies that provide energy monitoring and control services for solar energy systems. It sells its products and solutions directly to solar system distributors, large installers and strategic partners.

We see Enphase having a substantial market share that is gained through a premium product offering, superior customer service and the development of a large and diverse network of solar installers and distributors. The company’s products and services address a growing residential solar market. Coupling battery backup systems with existing and newly installed residential solar systems could accelerate the company’s revenue and earnings growth over the next several years, in our view. Additionally, commercial and international expansion offer additional revenue and earnings upside. Enphase also plans to expand manufacturing capacity in the U.S. during 2023 to benefit from tax incentives related to domestic production included in the Inflation Reduction Act (IRA).

Chart Industries

Chart Industries is a leading independent global manufacturer of highly engineered equipment servicing multiple applications in the Energy and Industrial Gas markets. Its unique product portfolio is used in every phase of the liquid gas supply chain, including upfront engineering, service and repair. Being at the forefront of the clean energy transition, Chart is a leading provider of technology, equipment and services related to liquefied natural gas, hydrogen, biogas and CO2 Capture amongst other applications. Chart’s customers are mainly large, multinational producers and distributors of hydrocarbon and industrial gases. The company generates about half its sales in North America.

We see Chart Industries as a leading manufacturer of highly engineered cryogenic solutions that are used for the production and storage of industrial gases. With the exposure to energy end markets including liquified natural gas (LNG), compressed natural gas (CNG) and hydrogen, the company has the technology to ship gas from oversupplied markets to markets that do not have access to enough energy resources. Hydrogen is gaining traction as a renewable fuel due to the focus on climate change. The recent acquisition of Howden is complementary to Chart’s existing product and service offerings.

BioMarin Pharmaceuticals

BioMarin Pharmaceuticals develops drugs with a focus on rare disease treatments. Its portfolio consists of several commercial products and multiple clinical and preclinical product candidates for the treatment of various diseases. The company’s Vimizim, Naglazyme and Aldurazyme drugs treat versions of the life-threatening genetic condition mucopolysaccharidosis (MPS), caused by a rare enzyme deficiency that prevents patients from metabolizing certain complex carbohydrates. Another drug, Kuvan, is approved to treat enzyme deficiency phenylketonuria (PKU). Additional medicines include Brineura and Palynziq.

We see BioMarin, anchored by their durable enzyme-based therapies, poised to grow from new indications, primarily Voxzogo, the first-approved treatment for Achondroplasia, and Roctavian, a drug awaiting FDA approval for the treatment of Severe Hemophilia A, with gene therapy and the ability to address a large chronically managed patient population. Additionally, the company has an early pipeline outside of these major indications in rare diseases within the usculoskeletal/metabolic, hematology, cardiovascular and CNS therapeutic focus areas. 

Tesla

Tesla designs, develops, manufactures and markets high-performance, technologically advanced electric cars and solar energy generation and energy storage products. Tesla sells more than five fully electric cars, among others, the Model X and Y SUVs, as well as the Model S sedan and Model 3 sedan. The company has a growing global network of Tesla Superchargers, which are industrial grade, high-speed vehicle chargers, typically placed along well-traveled routes and in and around dense city centers to allow Tesla owners quick and reliable charging. Tesla offers certain advanced driver assist systems under its Autopilot and Full Self-Driving options. U.S. customers generate nearly half of Tesla’s sales.

We see Tesla as the leading manufacturer of battery powered electric vehicles (EVs).  The company has achieved scaled production of EVs before the other large automobile manufacturers. The company’s technology in battery production and self-driving technology is more mature than competitors’ offerings. EVs are one of the fastest growing categories within automobile manufacturing. The profit margin in the automotive segment is significantly above automotive competitors which provides the company flexibility to price its vehicles more strategically as the competition eventually scales up their EV production. The direct-to-consumer sales model gives the company more control over its relationship with its customers as well as a source of higher profit margin since there is no dealership share of the profits.
Sells

Horizon Therapeutics

We sold Horizon after Amgen announced their intention to acquire Horizon for $116.50 per share. The deal is expected to close in mid-year 2023.

Dynatrace

We sold the position in Dynatrace as were concerned about the slowdown in cloud spending due to the optimization of workload costs by businesses. The slowdown became clear in the fourth quarter, and we expect it to continue throughout 2023, as businesses rationalize their cloud migration spending due to macroeconomic headwinds.

Outlook

The impact of the Federal Reserve tightening cycle and the banking issues of the past month added to the concern of a potential economic recession. With goods inflation largely under control, labor costs will remain the focal point to achieving the stated goal of 2% inflation. With the labor market still tight, the Federal Reserve may well raise rates another 25 basis points with the peak in Fed Funds at 5.00% to 5.25%. Fed Funds Futures continue to point to the potential for a pivot into an easing cycle and this has supported the rise in equity prices. We believe the most likely outcome is for the Federal Reserve to pause for a period to access the impact to inflation of the rise in interest rates and shrinking of the balance sheet. Equity markets will focus on the impact this has had on the economy and the potential for a contraction in corporate profits. Equity valuation levels remain elevated and with the prospects for a decline in profits this sets up for a difficult path for higher equity prices.  The major support continues to be the prospect of a shift to a Federal Reserve easing cycle. Little progress has been made in dealing with the Debt Ceiling which will add a level of uncertainty and volatility to markets. With the war in Ukraine passing the one-year mark, there has been no progress toward a resolution adding to the uncertainty. With many of the sizable legislative packages passed now entering the phase of rule writing, markets will have more clarity on where these funds will flow. This should be one of the bright spots in a challenging economic outlook. Our focus will continue to be at the company level, with an emphasis on seeking to invest in companies with secular tailwinds or strong product-driven cycles.

1 https://www.fdic.gov/news/press-releases/2023/pr23019.html

Disclosures

The opinions expressed herein are those of Aristotle Atlantic Partners, LLC (Aristotle Atlantic) and are subject to change without notice. Past performance is not a guarantee or indicator of future results. This material is not financial advice or an offer to purchase or sell any product. You should not assume that any of the securities transactions, sectors or holdings discussed in this report were or will be profitable, or that recommendations Aristotle Atlantic makes in the future will be profitable or equal the performance of the securities listed in this report. The portfolio characteristics shown relate to the Aristotle Atlantic Large Cap Growth strategy. Not every client’s account will have these characteristics. Aristotle Atlantic reserves the right to modify its current investment strategies and techniques based on changing market dynamics or client needs. There is no assurance that any securities discussed herein will remain in an account’s portfolio at the time you receive this report or that securities sold have not been repurchased. The securities discussed may not represent an account’s entire portfolio and, in the aggregate, may represent only a small percentage of an account’s portfolio holdings. The performance attribution presented is of a representative account from Aristotle Atlantic’s Large Cap Growth Composite. The representative account is a discretionary client account which was chosen to most closely reflect the investment style of the strategy. The criteria used for representative account selection is based on the account’s period of time under management and its similarity of holdings in relation to the strategy. Recommendations made in the last 12 months are available upon request. Returns are presented gross and net of investment advisory fees and include the reinvestment of all income. Gross returns will be reduced by fees and other expenses that may be incurred in the management of the account. Net returns are presented net of actual investment advisory fees and after the deduction of all trading expenses.

All investments carry a certain degree of risk, including the possible loss of principal. Investments are also subject to political, market, currency and regulatory risks or economic developments. International investments involve special risks that may in particular cause a loss in principal, including currency fluctuation, lower liquidity, different accounting methods and economic and political systems, and higher transaction costs. These risks typically are greater in emerging markets. Securities of small‐ and medium‐sized companies tend to have a shorter history of operations, be more volatile and less liquid. Value stocks can perform differently from the market as a whole and other types of stocks.

The material is provided for informational and/or educational purposes only and is not intended to be and should not be construed as investment, legal or tax advice and/or a legal opinion. Investors should consult their financial and tax adviser before making investments. The opinions referenced are as of the date of publication, may be modified due to changes in the market or economic conditions, and may not necessarily come to pass. Information and data presented has been developed internally and/or obtained from sources believed to be reliable. Aristotle Atlantic does not guarantee the accuracy, adequacy or completeness of such information.

Aristotle Atlantic Partners, LLC is an independent registered investment adviser under the Advisers Act of 1940, as amended. Registration does not imply a certain level of skill or training. More information about Aristotle Atlantic, including our investment strategies, fees and objectives, can be found in our Form ADV Part 2, which is available upon request. AAP-2304-29

Performance Disclosure

Composite returns for all periods ended March 31, 2023 are preliminary pending final account reconciliation.

Past performance is not indicative of future results. Performance results for periods greater than one year have been annualized. Returns are presented gross and net of investment advisory fees and include the reinvestment of all income. Gross returns will be reduced by fees and other expenses that may be incurred in the management of the account. Net returns are presented net of actual investment advisory fees and after the deduction of all trading expenses.

Index Disclosure

The Russell 1000® Growth Index measures the performance of the large cap growth segment of the U.S. equity universe. It includes those Russell 1000 companies with higher price-to-book ratios and higher forecasted growth values. This index has been selected as the benchmark and is used for comparison purposes only. The Russell 1000® Value Index measures the performance of the large cap value segment of the U.S. equity universe. It includes those Russell 1000 companies with lower price-to-book ratios and lower expected growth values. The S&P 500® Index is the Standard & Poor’s Composite Index of 500 stocks and is a widely recognized, unmanaged index of common stock prices. The Russell 2000® Index measures the performance of the small cap segment of the U.S. equity universe. The Russell 2000 Index is a subset of the Russell 3000® Index representing approximately 10% of the total market capitalization of that index. It includes approximately 2,000 of the smallest securities based on a combination of their market cap and current index membership. The Dow Jones Industrial Average® is a price-weighted measure of 30 U.S. blue-chip companies. The Index covers all industries except transportation and utilities. The NASDAQ Composite Index measures all NASDAQ domestic and international based common type stocks listed on The NASDAQ Stock Market. The NASDAQ Composite includes over 3,000 companies, more than most other stock market indices. The Bloomberg U.S. Aggregate Bond Index is an unmanaged index of domestic investment grade bonds, including corporate, government and mortgage-backed securities. The WTI Crude Oil Index is a major trading classification of sweet light crude oil that serves as a major benchmark price for oil consumed in the United States. The 3-Month U.S. Treasury Bill is a short-term debt obligation backed by the U.S. Treasury Department with a maturity of three months.  The Consumer Price Index (CPI) is a measure of the average change over time in the prices paid by urban consumers for a market basket of consumer goods and services. While stock selection is not governed by quantitative rules, a stock typically is added only if the company has an excellent reputation, demonstrates sustained growth and is of interest to a large number of investors. The volatility (beta) of the Composite may be greater or less than its respective benchmarks. It is not possible to invest directly in these indices.

Markets Review

The U.S. equity market finished higher for the first quarter of the year, as the S&P 500 Index rose 7.50% during the period. Concurrently, the Bloomberg U.S. Aggregate Bond Index increased 2.96% for the quarter. In terms of style, the Russell 1000 Growth Index outperformed its value counterpart by 13.36% during the quarter.

On a sector basis, seven out of eleven sectors within the S&P 500 Index finished higher for the quarter, with Information Technology, Communication Services and Consumer Discretionary posting the largest gains. The worst performers were Energy, Health Care and Financials.

Sources: SS&C Advent, Bloomberg
Past performance is not indicative of future results. Aristotle Atlantic Core Equity Composite returns are presented gross and net of investment advisory fees and include the reinvestment of all income. Gross returns will be reduced by fees and other expenses that may be incurred in the management of the account. Net returns are presented net of actual investment advisory fees and after the deduction of all trading expenses. Aristotle Atlantic Composite returns are preliminary pending final account reconciliation. Please see important disclosures at the end of this document.

Although inflation remained well above its historical average of 3.26%, the pace of price increases moderated during the quarter. As such, for the 12-month periods ending in January and February, annualized CPI figures declined from 6.4% to 6.0%, respectively. The pattern of disinflation was partly driven by decreases in the price of fuel, used vehicles and medical care services. The government also reported a deceleration in U.S. economic growth, as GDP increased 2.6% in the fourth quarter following the third quarter’s 3.2% increase. Weaker consumer spending and business investment were significant factors in the softer results. However, retail sales in January jumped 3%, and the labor market remained tight, with an unemployment rate of 3.6%.

While some economic data points trended in a positive direction, the market was shocked with the regulatory shutdown of Silicon Valley Bank (SVB), the second-largest bank failure by assets in U.S. history. The value of SVB’s bond holdings had plunged amid rapidly increasing interest rates, creating a shortfall as clients (largely composed of tech startups) withdrew their deposits, eventually leading to a run on the bank’s deposits. Just days later, regulators also took control of New York-based Signature Bank. The speed and size of the bank failures sent U.S. bank share prices tumbling. To provide stability, the Federal Reserve announced the creation of an emergency lending facility that would allow banks to deposit high-quality assets (e.g., Treasuries and mortgage-backed securities) in exchange for a cash advance worth the face value of the asset (instead of the market value). Additionally, First Citizens Bank announced that it had made an agreement with the Federal Deposit Insurance Corporation (FDIC) for a whole bank purchase with loss share coverage of Silicon Valley Bridge Bank.1

Despite the turmoil in the banking system, the Federal Reserve (Fed) stayed its course, increasing its benchmark rate by 0.25% in March (its ninth consecutive rate hike) to a range of 4.75% to 5.00%. However, noting that banking events may contribute to a more restrictive credit environment, the Fed tempered its stance that further rate increases are necessary to restore price stability and achieve its 2% inflation target. Rather, Fed Chair Powell emphasized the reliance on incoming data to inform the future path of monetary policy, as conditions may have tightened more than economic indices currently suggest.

On the corporate earnings front, results and guidance were broadly underwhelming, with only 68% of S&P 500 companies exceeding EPS estimates (below the five-year average of 77%) and 67% of companies providing negative EPS guidance (above the five-year average of 59%). Overall, the S&P 500 companies reported a decline in earnings of 4.9% as inflation and recession remained prevalent topics, with 332 and 148 companies mentioning those words on earnings calls, respectively. Nevertheless, in spite of the weaker-than-expected results, there have also been positive remarks of cost cutting, moderating input price pressures and better supply-chain dynamics.

Performance and Attribution Summary

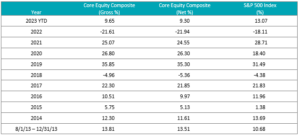
For the first quarter of 2023, Aristotle Atlantic’s Core Equity Composite posted a total return of 5.35% net of fees (5.46% gross of fees), underperforming the S&P 500 Index, which recorded a total return of 7.50%.

Performance (%) 1Q231 Year3 Years5 Years7 YearsSince Inception*
Core Equity Composite (gross)5.465.46-11.3116.3311.0712.38
Core Equity Composite (net)5.355.35-11.6815.8510.6111.86
S&P 500 Index7.507.50-7.7318.6011.1811.77
*The Core Equity Composite has an inception date of August 1, 2013. Past performance is not indicative of future results. Aristotle Atlantic Core Equity Composite returns are presented gross and net of investment advisory fees and include the reinvestment of all income. Gross returns will be reduced by fees and other expenses that may be incurred in the management of the account. Net returns are presented net of actual investment advisory fees and after the deduction of all trading expenses. Aristotle Atlantic Composite returns are preliminary pending final account reconciliation. Please see important disclosures at the end of this document.

Source: FactSet
Past performance is not indicative of future results. Attribution results are based on sector returns which are gross of investment advisory fees. Attribution is based on performance that is gross of investment advisory fees and includes the reinvestment of income. Please see important disclosures at the end of this document.

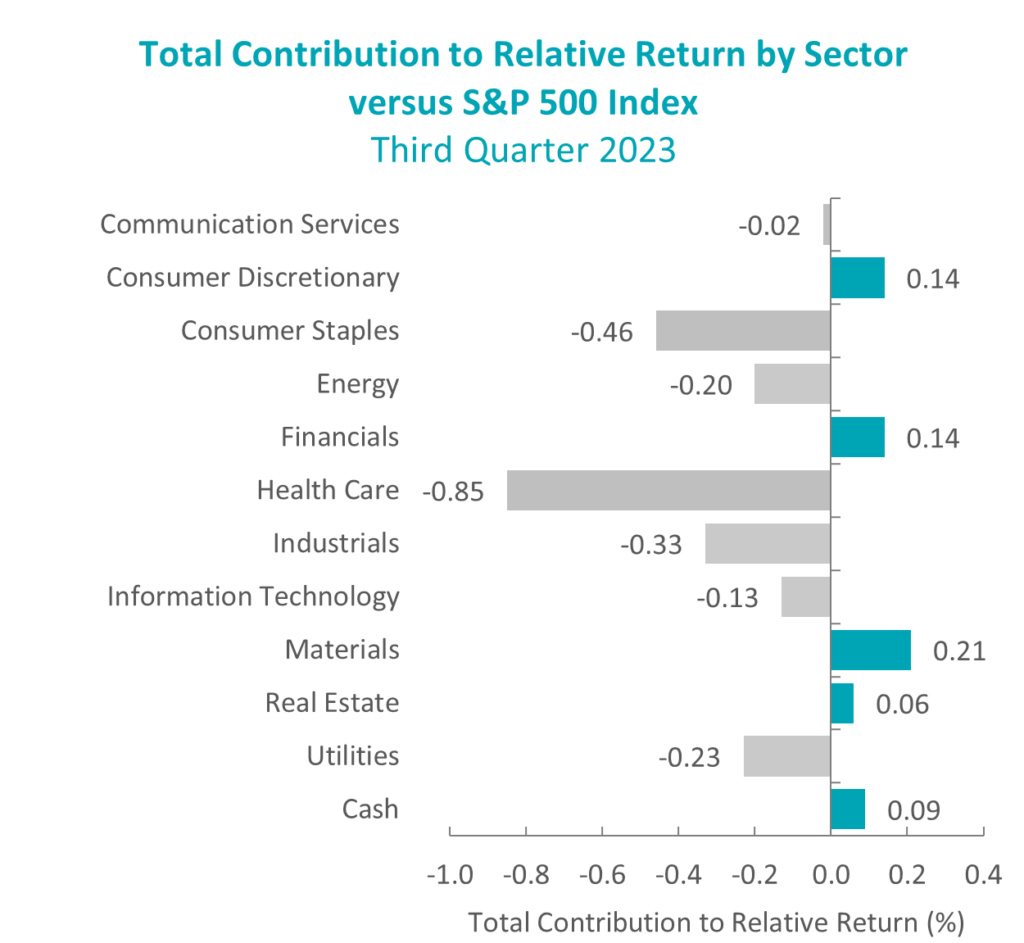
During the first quarter, the portfolio’s underperformance relative to the S&P 500 Index was due to security selection and allocation effects. Security selection in Consumer Discretionary, Industrials and Energy detracted the most from relative performance. Conversely, security selection in Information Technology and Health Care as well as an underweight in Energy contributed the most to relative performance.

Contributors and Detractors for 1Q 2023

Relative ContributorsRelative Detractors
CatalentCigna Group
NvidiaNorfolk Southern
MicrosoftChubb
Applied MaterialsDarling Ingredients
AlphabetBio-Techne

Contributors

Catalent

Catalent shares outperformed in the first quarter as rumors surfaced of Danaher expressing interest in acquiring Catalent. At this point no deal has materialized; however, Catalent also appears to be stabilizing their core drug manufacturing businesses. 

Nvidia

Nvidia contributed to outperformance, as the company announced better-than-expected fourth quarter earnings driven by a strong rebound in Gaming and an improving outlook for the Datacenter business due to the acceleration of Graphics Processing Unit (GPU) driven Artifical Intelligence (AI) deployment. The company also hosted its Global Technology Conference (GTC) in March where it further highlighted its leading technology being used to develop AI Large Language Models (LLM). The company announced new partnerships with hyperscalers for its AI cloud-based service while also releasing new software and hardware offerings that will support GPU-driven AI growth.  Nvidia continues to see a growing addressable market for its products and services as AI uses become more prevalent.

Detractors

Cigna Group

Cigna shares traded lower in the first quarter, partly on a rotation out of safe-haven health care names in the managed care sector after strong performance in 2022 and partly due to increased scrutiny on the pharmaceutical benefits manager’s (PBMs) business model. These concerns have been raised in the past and Cigna attempts to be transparent with rebates and other facets of the model. We believe shares remain attractively valued. 

Norfolk Southern

Norfolk Southern underperformed in the first quarter of 2023 following the derailment of a train in Ohio in early February. Although there were no fatalities or injuries in the accident, chemical spills and a controlled burn of the contents of some tanker cars raised concern for long-term environmental impact, the associated cost of the cleanup and the increased risk of more stringent government regulations. 

Recent Portfolio Activity

The table below shows all buys and sells completed during the quarter, followed by a brief rationale.

BuysSells
Expedia GroupPhillips 66
Zoetis

Buys

Expedia Group

Expedia Group, Inc. provides online travel services for leisure and small business travelers. The company offers a wide range of travel shopping and reservation services, as well as provides real-time access to schedule, pricing and availability information for airlines, hotels and car rental companies. Expedia serves customers worldwide.

We see Expedia benefiting from the growth of booking travel online, both for leisure and in corporate travel.  The company also benefits from rapid growth in alternative accommodations, vacation home rental, through VRBO. The main sources of revenue and profitability are from hotel and vacation home rental. Additionally Expedia has exposure to airline ticket sales and automobile rentals. Post the COVID-19 pandemic, Expedia’s debt has been reduced and share repurchase has resumed and we would expect a dividend to be reinstated.

Zoetis

Zoetis is a global leader in the animal health industry, focused on the discovery, development, manufacture and commercialization of medicines, vaccines, diagnostic products, and services, biodevices, genetic tests and precision animal health technology. It has a diversified business, commercializing products across eight core species: dogs, cats, horses, cattle, swine, poultry, fish, and sheep within seven major product categories: vaccines, parasiticides, anti-infectives, dermatology, other pharmaceutical products, medicated feed additives and animal health diagnostics. Zoetis boasts approximately 300 product lines sold in more than 100 countries around the world, making it one of the world’s largest animal health businesses. Approximately 53% of the company’s total revenue is generated from the US.

We believe that Zoetis is working to help improve the lives of animals, which has societal benefits in the companion animal arena. Within livestock, healthier animals can provide increased productivity and yield as the growing world population seeks more safe food sources and additional sources of protein.

Sells

Phillips 66

We sold Phillips 66 to reduce our exposure to Energy as we continue to see the odds of a recession increase. A recession will negatively impact overall gasoline and diesel demand which could lead to weaker margins, as refinery utilization rates increase following the winter turnarounds. 

Outlook

The impact of the Federal Reserve tightening cycle and the banking issues of the past month added to the concern of a potential economic recession. With goods inflation largely under control, labor costs will remain the focal point to achieving the stated goal of 2% inflation. With the labor market still tight, the Federal Reserve may well raise rates another 25 basis points with the peak in Fed Funds at 5.00% to 5.25%. Fed Funds Futures continue to point to the potential for a pivot into an easing cycle and this has supported the rise in equity prices. We believe the most likely outcome is for the Federal Reserve to pause for a period to access the impact to inflation of the rise in interest rates and shrinking of the balance sheet. Equity markets will focus on the impact this has had on the economy and the potential for a contraction in corporate profits. Equity valuation levels remain elevated and with the prospects for a decline in profits this sets up for a difficult path for higher equity prices.  The major support continues to be the prospect of a shift to a Federal Reserve easing cycle. Little progress has been made in dealing with the Debt Ceiling which will add a level of uncertainty and volatility to markets. With the war in Ukraine passing the one-year mark, there has been no progress toward a resolution adding to the uncertainty. With many of the sizable legislative packages passed now entering the phase of rule writing, markets will have more clarity on where these funds will flow. This should be one of the bright spots in a challenging economic outlook. Our focus will continue to be at the company level, with an emphasis on seeking to invest in companies with secular tailwinds or strong product-driven cycles.

1https://www.fdic.gov/news/press-releases/2023/pr23019.html

Disclosures

The opinions expressed herein are those of Aristotle Atlantic Partners, LLC (Aristotle Atlantic) and are subject to change without notice. Past performance is not a guarantee or indicator of future results. This material is not financial advice or an offer to purchase or sell any product. You should not assume that any of the securities transactions, sectors or holdings discussed in this report were or will be profitable, or that recommendations Aristotle Atlantic makes in the future will be profitable or equal the performance of the securities listed in this report. The portfolio characteristics shown relate to the Aristotle Atlantic Core Equity strategy. Not every client’s account will have these characteristics. Aristotle Atlantic reserves the right to modify its current investment strategies and techniques based on changing market dynamics or client needs. There is no assurance that any securities discussed herein will remain in an account’s portfolio at the time you receive this report or that securities sold have not been repurchased. The securities discussed may not represent an account’s entire portfolio and, in the aggregate, may represent only a small percentage of an account’s portfolio holdings. The performance attribution presented is of a representative account from Aristotle Atlantic’s Core Equity Composite. The representative account is a discretionary client account which was chosen to most closely reflect the investment style of the strategy. The criteria used for representative account selection is based on the account’s period of time under management and its similarity of holdings in relation to the strategy. Recommendations made in the last 12 months are available upon request. Returns are presented gross and net of investment advisory fees and include the reinvestment of all income. Gross returns will be reduced by fees and other expenses that may be incurred in the management of the account. Net returns are presented net of actual investment advisory fees and after the deduction of all trading expenses.

All investments carry a certain degree of risk, including the possible loss of principal. Investments are also subject to political, market, currency and regulatory risks or economic developments. International investments involve special risks that may in particular cause a loss in principal, including currency fluctuation, lower liquidity, different accounting methods and economic and political systems, and higher transaction costs. These risks typically are greater in emerging markets. Securities of small‐ and medium‐sized companies tend to have a shorter history of operations, be more volatile and less liquid. Value stocks can perform differently from the market as a whole and other types of stocks.

The material is provided for informational and/or educational purposes only and is not intended to be and should not be construed as investment, legal or tax advice and/or a legal opinion. Investors should consult their financial and tax adviser before making investments. The opinions referenced are as of the date of publication, may be modified due to changes in the market or economic conditions, and may not necessarily come to pass. Information and data presented has been developed internally and/or obtained from sources believed to be reliable. Aristotle Atlantic does not guarantee the accuracy, adequacy or completeness of such information.

Aristotle Atlantic Partners, LLC is an independent registered investment adviser under the Advisers Act of 1940, as amended. Registration does not imply a certain level of skill or training. More information about Aristotle Atlantic, including our investment strategies, fees and objectives, can be found in our Form ADV Part 2, which is available upon request. AAP-2304-30

Performance Disclosures

Composite returns for all periods ended March 31, 2023 are preliminary pending final account reconciliation.

The Aristotle Core Equity Composite has an inception date of August 1, 2013 at a predecessor firm. During this time, Mr. Fitzpatrick had primary responsibility for managing the strategy. Performance starting November 1, 2016 was achieved at Aristotle Atlantic.

Past performance is not indicative of future results. Performance results for periods greater than one year have been annualized. Returns are presented gross and net of investment advisory fees and include the reinvestment of all income. Gross returns will be reduced by fees and other expenses that may be incurred in the management of the account. Net returns are presented net of actual investment advisory fees and after the deduction of all trading expenses.

Index Disclosures

The Russell 1000® Growth Index measures the performance of the large cap growth segment of the U.S. equity universe. It includes those Russell 1000 companies with higher price-to-book ratios and higher forecasted growth values. This index has been selected as the benchmark and is used for comparison purposes only. The Russell 1000® Value Index measures the performance of the large cap value segment of the U.S. equity universe. It includes those Russell 1000 companies with lower price-to-book ratios and lower expected growth values. The S&P 500® Index is the Standard & Poor’s Composite Index of 500 stocks and is a widely recognized, unmanaged index of common stock prices. The Russell 2000® Index measures the performance of the small cap segment of the U.S. equity universe. The Russell 2000 Index is a subset of the Russell 3000® Index representing approximately 10% of the total market capitalization of that index. It includes approximately 2,000 of the smallest securities based on a combination of their market cap and current index membership. The Dow Jones Industrial Average® is a price-weighted measure of 30 U.S. blue-chip companies. The Index covers all industries except transportation and utilities. The NASDAQ Composite Index measures all NASDAQ domestic and international based common type stocks listed on The NASDAQ Stock Market. The NASDAQ Composite includes over 3,000 companies, more than most other stock market indices. The Bloomberg U.S. Aggregate Bond Index is an unmanaged index of domestic investment grade bonds, including corporate, government and mortgage-backed securities. The WTI Crude Oil Index is a major trading classification of sweet light crude oil that serves as a major benchmark price for oil consumed in the United States. The 3-Month U.S. Treasury Bill is a short-term debt obligation backed by the U.S. Treasury Department with a maturity of three months.  The Consumer Price Index (CPI) is a measure of the average change over time in the prices paid by urban consumers for a market basket of consumer goods and services. While stock selection is not governed by quantitative rules, a stock typically is added only if the company has an excellent reputation, demonstrates sustained growth and is of interest to a large number of investors. The volatility (beta) of the Composite may be greater or less than its respective benchmarks. It is not possible to invest directly in these indices.

ARISTOTLE CAPITAL BOSTON, LLC

Markets Review

Small cap equities began the year on a positive note, with the Russell 2000 rising over 14.3% through the first 22 trading days of the year amid renewed investor optimism, moderating inflation data, and hopes that the Federal Reserve would soon alter their stance. This jolt of enthusiasm translated into outperformance for speculative segments of the small cap market in January, many of which were last year’s losers. Non-profitable and heavily shorted stocks surged throughout the month of January—notching gains reminiscent of those experienced during the meme frenzy in early 2021. This rally, however, was short-lived as rising rates, tighter lending conditions, and the banking system turmoil that emerged near the end of the quarter all contributed to an unsettling backdrop for investors and a 14.0% intra-quarter decline in the Russell 2000 Index. Small cap markets stabilized towards the end of March, however, moving back into positive territory during the final week of the quarter and closing out a volatile period with a modest gain.

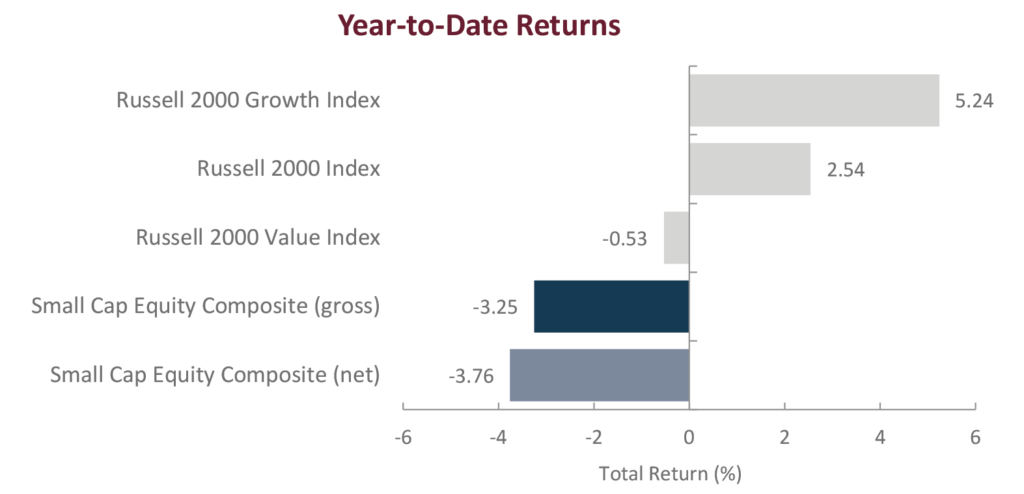
Stylistically, growth outperformed value during the quarter, as evidenced by the Russell 2000 Growth Index’s total return of 6.07% versus the -0.66% total return of the Russell 2000 Value Index. The outperformance of growth-oriented companies (as defined by Russell) during the quarter is a reversal of the recent trend that has been in place for much of the past two years. Moreover, Q1 was the Russell 2000 Growth’s 13th best relative quarter versus the Russell 2000 Value on record (of 177 quarters) making it a top decile relative quarter for Growth over Value. This dispersion was driven in large part by the value index’s higher weightings in the Financials and Energy sectors, which underperformed the broader Index in the face of regional bank related turmoil and falling energy prices.

On a sector basis, Information Technology, Consumer Discretionary, and Materials led first quarter returns, up 14.23%, 11.90%, and 8.78% respectively, with Information Technology outperforming the broader index for the first time in five quarters. Financials (-8.50%) and Energy (-3.82%) were the worst performing sectors during the quarter followed by Health Care (-1.93%) which was negatively impacted by the performance of Biotechnology companies within the sector.

Sources: SS&C Advent; Russell Investments

Past performance is not indicative of future results. Returns are presented gross and net of investment advisory fees and include the reinvestment of all income. Gross returns will be reduced by fees and other expenses that may be incurred in the management of the account. Net returns are presented net of actual investment advisory fees and after the deduction of all trading expenses. Aristotle Small Cap Equity Composite returns are preliminary pending final account reconciliation. Please see important disclosures at the end of this document.

Performance Review

For the first quarter of 2023, the Aristotle Small Cap Equity Composite posted a total return of 0.97% net of fees (1.10% gross of fees), trailing the 2.74% total return of the Russell 2000 Index. Underperformance was driven by security selection while allocation effects positively contributed. Overall, security selection was weakest within the Financials, Industrials and Information Technology sectors and strongest in Energy, Utilities and Communication Services. From an allocation perspective, the portfolio benefited from an underweight in Financials and an overweight in Industrials, however, this was partially offset by underweights in Consumer Discretionary and Materials.

Relative ContributorsRelative Detractors
Insight EnterprisesSignature Bank
World Wrestling EntertainmentAcadia Healthcare
U.S. Xpress EnterprisesNational Bank Holdings
BeldenVeritex Holdings
Euronet WorldwidePacWest Bancorp

CONTRIBUTORS

Insight Enterprises (NSIT), a provider of branded IT products and services to businesses, appreciated during the quarter as the company’s transition from a transaction-oriented reseller to a services and solutions integrator continues to march on. We maintain a position as we believe the company’s focus on higher value-add areas like Cloud and Digital Solutions can continue to benefit shareholders as its customers seek to refresh and digitally transform their IT systems.

World Wrestling Entertainment (WWE), a media and entertainment company that operates, promotes, merchandises, and licenses live wrestling events worldwide, appreciated amid heightened investor sentiment surrounding the company’s upcoming TV rights renewal cycle and growing expectations that the company would be sold to a strategic buyer. We maintain our position ahead of the company’s anticipated business combination with Endeavor Group, a global sports and entertainment company and owner of UFC, which was announced shortly after quarter end.

DETRACTORS

Signature Bank (SBNY), a full-service commercial bank with offices across the U.S., declined after the New York Department of Financial Services took possession of the bank and appointed the Federal Deposit Insurance Corporation (FDIC) as the receiver in mid-March. Shortly thereafter the FDIC entered into an agreement with Flagstar Bank, a subsidiary of New York Community Bancorp (NYSE: NYCB) for substantially all deposits and certain loan portfolios of Signature Bridge Bank on March 20, 2023. We liquidated our remaining position late in the quarter and have provided additional color in the Recent Portfolio Activity section of the commentary below.

Acadia Healthcare (ACHC), a provider of behavioral health and addiction services to patients in a variety of inpatient and outpatient settings, declined following the company’s quarterly earnings results released during the period. While the company’s fundamentals continue to advance, it appears the share price overreaction following the release of company’s earnings can be attributed to some near-term labor cost headwinds that came in higher than expected during the period. Nevertheless, we maintain a position as we believe the company remains well positioned to capitalize on the favorable supply/demand outlook for behavioral health, positive reimbursement trends and continued execution of its growth strategy.

Recent Portfolio Activity

Buys/AcquisitionsSells/Liquidations
Hannon Armstrong Sustainable Infrastructure CapitalAltra Industrial Motion
iStar
PacWest Bancorp
Signature Bank

BUYS/ACQUISITIONS

Hannon Armstrong Sustainable Infrastructure Capital (HASI), a Maryland-based sustainable asset financing and investing company, was added to the portfolio. We believe the company remains uniquely positioned to benefit as the demand for sustainable energy and infrastructure continues to grow. Additionally, we believe the company’s diverse portfolio, emphasis on proven technologies and long-term partnerships will result in less cyclical, lower risk, more predictable cash flows which can drive shareholder value in periods to come.

SELLS/LIQUIDATIONS

Altra Industrial Motion (AIMC), a global manufacturer and supplier of motion control, power transmission and automation products was removed from the portfolio after being acquired by Regal Rexnord Corporation (NYSE: RRX).

iStar (STAR), an internally-managed real estate investment trust specializing in ground leases, was removed from the portfolio following the completion of its merger with Safehold Inc. and the spinoff of the company’s non-ground lease assets. We maintain a position in the newly created business entity which now trades under the ticker “SAFE” and operates as the only self-managed, pure-play ground lease company in the public markets.

PacWest Bancorp (PACW), a West Coast relationship-based community bank focused on providing business banking and treasury management services to small, middle-market, and venture-backed businesses, was sold from the portfolio due to our belief that future shareholder value creation may be impeded by uncertainties related to the bank’s exposure to late-stage venture capital sponsored clients, and that the company’s risk/reward potential was no longer justified.

Signature Bank (SBNY), a full-service commercial bank with offices across the U.S, was sold from the portfolio following the FDIC takeover and subsequent carve-out of Signature Bridge Bank. Having followed Signature Bank for almost two decades, our investment thesis was predicated on the belief that Signature Bank was a traditional commercial bank with a diversified clientele and business model. The bank has a history of finding attractive industries/ecosystems that have robust deposit needs, and serving these areas well. Its unique operating model of acquiring experienced private client teams drove strong deposit and loan growth, while the autonomy provided to the teams helped keep overhead costs low. The company continued to acquire teams to further its growth, and we expected its successful integration of these teams to continue, particularly on the West Coast. On a fundamental basis, we believed the company had been executing well, highlighted by record annual earnings in 2022, expanding margins, loan growth, new teams added, and clean credit metrics. However, given the heightened scrutiny of the recent events involving Silicon Valley Bank and Silvergate Capital, some of the bank’s depositors opted to pull their money creating a run on the bank despite significant qualitative and quantitative differences between those two entities and Signature Bank. The company’s digital payments platform appeared to be a source of investor confusion despite its limited financial impact on the bank’s overall business. As part of this business, Signature Bank facilitated crypto-based transactions by holding customer’s U.S. Dollar-backed crypto tokens as deposits. The bank did not, however, engage in crypto-backed lending or trading and did not hold any cryptocurrencies on its balance sheet. Moreover, the company had recently announced its plans to intentionally reduce its digital assets exposure, a move we expected to reduce future earnings power from 2022 levels but would help alleviate some of the negative investor sentiment. Many finite details that prompted regulators to step in, eventually leading to the downfall of Signature Bank, are still unknown, however, we ultimately liquidated our remaining position late in the quarter after shares reopened for trading.

Outlook

After inflationary pressures, rising borrowing costs, and geopolitical turmoil created headwinds for investors in 2022, fears of an impending banking crisis and a slowing economy pose new threats in 2023. While sentiment moderately stabilized into quarter end, continued uncertainty and increased risks of recession will likely keep market participants on edge for the foreseeable future. Against this backdrop, we continue to believe the Federal Reserve will be a key driver of market volatility going forward. Specifically, now that the Fed’s initial batch rate increases are in the rearview mirror, the ongoing debate and positioning around any future Fed activity (or lack thereof) is likely to create continued bouts of volatility in both the equity and fixed income markets due to the implications on the strength of the U.S. economy, inflation expectations, and the resulting impact on corporate profitability. Another key item to watch over the coming months will be the extent to which recent events cause banks to reduce lending. This in turn may weigh on consumer demand and business investment and therefore accelerate any slowdown in the economy. As such, we will be paying close attention to management commentary and financial disclosures throughout this upcoming earnings season, which may unearth or dispel many of these ongoing concerns. Either way, it’s not a stretch to assume that there’s likely to be more volatility in the coming months, making this a good time to remember the benefits of portfolio diversification, remaining disciplined, and staying focused on companies with higher-quality characteristics such as stable earnings, clean balance sheets, and reasonable valuations.

From an asset class perspective, valuations of small versus large remain near multi-decade lows, which we believe suggests a more favorable setup for small caps relative to large caps in the periods to come (11.1x P/E for the Russell 2000 Index vs. 19.2x P/E for the Russell 1000 Index). Small caps, as represented by the Russell 2000, also remain historically attractive on an absolute basis and are trading near their lowest levels in over 30 years, in-line with lows during the GFC and below the COVID-19 recession and 2001 recession lows. Additional benefits from re-shoring efforts, investments in automation amid wage inflation/tight labor markets, and spending to reduce emissions also favor small caps which are beneficiaries of U.S. capex cycles. High and falling inflationary environments have also been favorable market environments for the asset class historically, a scenario we may find ourselves in this year. So, while the near-term outlook remains uncertain, along with the length and severity of any upcoming downturn, decades of investing have taught us that these can be the most rewarding times to be invested in small caps for the long-term. When the dust settles, we are reminded that small caps typically start moving up before many of us know for sure that the economy has begun to reaccelerate, and that missing these early stages of a market recovery can be costly*.

Positioning

As always, our current positioning is a function of our bottom-up security selection process and our ability to identify what we view as attractive investment candidates, regardless of economic sector definitions. Overweights in Industrials and Information Technology are mostly a function of recent portfolio activity and the relative performance of our holdings in these sectors over the past few periods. Conversely, we continue to be underweight in Consumer Discretionary, as we have been unable to identify what we consider to be compelling long-term opportunities that fit our discipline given the rising risk profiles of many retail businesses and a potential deceleration in goods spending following a period of strength fueled in part by government backed stimulus payments. We are also underweight in Financials as of quarter end, as we await further details on the potential impact to future bank earnings power amid the recent developments in the sector. Given our focus on long-term business fundamentals, patient investment approach and low portfolio turnover, the strategy’s sector positioning generally does not change significantly from quarter to quarter. However, we may take advantage of periods of volatility by adding selectively to certain companies when appropriate.

*As measured by the average return of the Russell 2000 Index the year following periods of GDP growth <0% since 1980.

Disclosures

The opinions expressed herein are those of Aristotle Capital Boston, LLC (Aristotle Boston) and are subject to change without notice.

Past performance is not indicative of future results. The information provided in this report should not be considered financial advice or a recommendation to purchase or sell any particular security. There is no assurance that any securities discussed herein will remain in an account’s portfolio at the time you receive this report or that securities sold have not been repurchased. The securities discussed may not represent an account’s entire portfolio and, in the aggregate, may represent only a small percentage of an account’s portfolio holdings. The performance attribution presented is of a representative account from Aristotle Boston’s Small Cap Equity Composite. The representative account is a discretionary client account which was chosen to most closely reflect the investment style of the strategy. The criteria used for representative account selection is based on the account’s period of time under management and its similarity of holdings in relation to the strategy. It should not be assumed that any of the securities transactions, holdings or sectors discussed were or will be profitable, or that the investment recommendations or decisions Aristotle Boston makes in the future will be profitable or equal the performance of the securities discussed herein. Aristotle Boston reserves the right to modify its current investment strategies and techniques based on changing market dynamics or client needs. Recommendations made in the last 12 months are available upon request.

Returns are presented gross and net of investment advisory fees and include the reinvestment of all income. Gross returns will be reduced by fees and other expenses that may be incurred in the management of the account. Net returns are presented net of actual investment advisory fees and after the deduction of all trading expenses.

Effective January 1, 2022, the Aristotle Small Cap Equity Composite has been redefined to exclude accounts with meaningful industry-specific restrictions or substantial values-based screens hampering implementation of the small cap strategy.

Effective January 1, 2022, the Russell 2000 Value Index was removed as the secondary benchmark for the Aristotle Capital Boston Small Cap Equity strategy.

All investments carry a certain degree of risk, including the possible loss of principal. Investments are also subject to political, market, currency and regulatory risks or economic developments. International investments involve special risks that may in particular cause a loss in principal, including currency fluctuation, lower liquidity, different accounting methods and economic and political systems, and higher transaction costs.

These risks typically are greater in emerging markets. Securities of small‐ and medium‐sized companies tend to have a shorter history of operations, be more volatile and less liquid. Value stocks can perform differently from the market as a whole and other types of stocks. The material is provided for informational and/or educational purposes only and is not intended to be and should not be construed as investment, legal or tax advice and/or a legal opinion. Investors should consult their financial and tax adviser before making investments.

The opinions referenced are as of the date of publication, may be modified due to changes in the market or economic conditions, and may not necessarily come to pass.

The firm’s coverage of Signature Bank includes time at a predecessor firm.

Aristotle Capital Boston, LLC is an independent investment adviser registered under the Investment Advisers Act of 1940, as amended. Registration does not imply a certain level of skill or training. More information about Aristotle Boston, including our investment strategies, fees and objectives, can be found in our Form ADV Part 2, which is available upon request. ACB-2304-16

Performance Disclosures

Sources: SS&C Advent, Russell Investments

Composite returns for periods ended March 31, 2023 are preliminary pending final account reconciliation.

*The Aristotle Small Cap Equity Composite has an inception date of November 1, 2006 at a predecessor firm. During this time, Jack McPherson and Dave Adams had primary responsibility for managing the strategy. Performance starting January 1, 2015 was achieved at Aristotle Boston.

**For the period November 2006 through December 2006.

Past performance is not indicative of future results. Performance results for periods greater than one year have been annualized.

Effective January 1, 2022, the Aristotle Small Cap Equity Composite has been redefined to exclude accounts with meaningful industry-specific restrictions or substantial values-based screens hampering implementation of the small cap strategy.

Effective January 1, 2022, the Russell 2000 Value was removed as the secondary benchmark for the Aristotle Capital Boston Small Cap Equity strategy.

Returns are presented gross and net of investment advisory fees and include the reinvestment of all income. Gross returns will be reduced by fees and other expenses that may be incurred in the management of the account. Net returns are presented net of actual investment advisory fees and after the deduction of all trading expenses. Please see important disclosures enclosed within this document.

Index Disclosures

The Russell 2000® Index measures the performance of the small cap segment of the U.S. equity universe. The Russell 2000 Index is a subset of the Russell 3000® Index representing approximately 10% of the total market capitalization of that index. It includes approximately 2000 of the smallest securities based on a combination of their market cap and current index membership. The Russell 2000 Growth® Index measures the performance of the small cap companies located in the United States that also exhibit a growth probability. The Russell 2000 Value® Index measures the performance of the small cap companies located in the United States that also exhibit a value probability. The Russell 1000® Index measures the performance of the large cap segment of the U.S. equity universe. The Russell 1000 Index is a subset of the Russell 3000® Index, representing approximately 90% of the total market capitalization of that index. It includes approximately 1,000 of the largest securities based on a combination of their market capitalization and current index membership. The volatility (beta) of the composite may be greater or less than the benchmarks. It is not possible to invest directly in these indices.

For more on Small Cap Equity, access the latest resources.

ARISTOTLE CAPITAL BOSTON, LLC

Markets Review

SMID cap equities began the year on a positive note, with the Russell 2500 rising over 14% through the first 22 trading days of the year amid renewed investor optimism, moderating inflation data, and hopes that the Federal Reserve would soon alter their stance. This jolt of enthusiasm translated into outperformance for speculative segments of the SMID market in January, many of which were last year’s losers. Non-profitable and heavily shorted stocks also surged in January—notching gains reminiscent of those experienced during the meme frenzy in early 2021. This rally, however, was short-lived as rising rates, tighter lending conditions, and the banking system turmoil that emerged near the end of the quarter all contributed to an unsettling backdrop for investors and a 13.9% intra-quarter decline in the Russell 2500 Index. SMID cap markets stabilized towards the end of March, however, moving back into positive territory during the final week of the quarter and closing out a volatile period with a modest gain.

Stylistically, growth outperformed value during the quarter, as evidenced by the Russell 2500 Growth Index’s total return of 6.54% versus the 1.40% total return of the Russell 2500 Value Index. The outperformance of growth-oriented companies (as defined by Russell) during the quarter is a reversal of the recent trend that has been in place for much of the past two years. Moreover, Q1 was among the Russell 2500 Growth’s best relative quarters versus the Russell 2500 Value on record (of 149 quarters) making it a top quintile relative quarter for Growth over Value. This dispersion was driven in large part by the value index’s higher weightings in the Financials and Energy sectors, which underperformed the broader Index in the face of regional bank related turmoil and falling energy prices.

On a sector basis, Information Technology, Consumer Discretionary and Communication Services led first quarter returns, up 13.58%, 10.38%, and 8.56% respectively, with Information Technology outperforming the broader index for the first time in five quarters. Energy (-9.08%) and Financials (-7.11%) were the worst performing sectors during the quarter followed by Health Care (-0.08%) which was negatively impacted by the performance of Biotechnology companies within the sector.

Sources: SS&C Advent; Russell Investments

Past performance is not indicative of future results. Returns are presented gross and net of investment advisory fees and include the reinvestment of all income. Gross returns will be reduced by fees and other expenses that may be incurred in the management of the account. Net returns are presented net of actual investment advisory fees and after the deduction of all trading expenses. Aristotle Small Cap Equity Composite returns are preliminary pending final account reconciliation. Please see important disclosures at the end of this document.

Performance Review

For the first quarter of 2023, the Aristotle Small/Mid Cap Equity Composite generated a total return of 0.93% net of fees (1.08% gross of fees), trailing the 3.39% total return of the Russell 2500 Index. Underperformance was driven by security selection while allocation effects positively contributed. Overall, security selection was weakest within the Financials, Information Technology, and Industrials sectors and strongest in Energy, Communication Services and Health Care. From an allocation perspective, the portfolio benefited from overweight exposures in Information Technology and Industrials, however, this was partially offset by underweights in Consumer Discretionary and Communication Services.

Relative ContributorsRelative Detractors
FTI ConsultingSignature Bank
CatalentBankUnited
Wolverine WorldwideNational Bank Holdings
BeldenAcadia Healthcare
World Wrestling EntertainmentPacWest Bancorp

CONTRIBUTORS

FTI Consulting (FCN), a global business advisory firm that provides a variety of consulting services to large corporations, benefited from strong fundamental performance driven by increased demand for the company’s services as its clients navigate through increased regulatory scrutiny, corporate finance and restructuring activity, and a proliferation of corporate litigation. We maintain a position, as we believe the firm’s diversified business mix, global reach and management’s efforts to optimize the business can create value for shareholders going forward.

Catalent (CTLT), a pharmaceutical contract development and manufacturing organization, appreciated amid positive momentum within the company’s Biologics segment, a renewed focus on improving efficiencies, and rumblings that the company may be acquired. We maintain a position, as we believe the long-term value creation opportunity for the company remains intact, driven by favorable outsourcing trends and the company’s competitive position in biologics, particularly within the company’s cell and gene therapy sub-segments.

DETRACTORS

Signature Bank (SBNY), a full-service commercial bank with offices across the U.S., declined after the New York Department of Financial Services took possession of the bank and appointed the Federal Deposit Insurance Corporation (FDIC) as the receiver in mid-March. Shortly thereafter the FDIC entered into an agreement with Flagstar Bank, a subsidiary of New York Community Bancorp (NYSE: NYCB) for substantially all deposits and certain loan portfolios of Signature Bridge Bank on March 20, 2023. We liquidated our remaining position late in the quarter and have provided additional color in the Recent Portfolio Activity section of the commentary below.

BankUnited (BKU), a bank holding company that provides commercial and consumer banking services in select regions nationally, declined amid broader industry wide pressures that impacted regional banking sentiment during the quarter. We maintain a position, as we believe the company can weather this period of volatility given the diversified nature of its business, strong asset quality metrics, and favorable geographic exposures.

Recent Portfolio Activity

Buys/AcquisitionsSells/Liquidations
Hannon Armstrong Sustainable Infrastructure CapitalAltra Industrial Motion
TeleflexiStar
PacWest Bancorp
Signature Bank

BUYS/ACQUISITIONS

Hannon Armstrong Sustainable Infrastructure Capital (HASI), a Maryland-based sustainable asset financing and investing company was added to the portfolio. We believe the company remains uniquely positioned to benefit as the demand for sustainable energy and infrastructure continues to grow. Additionally, we believe the company’s diverse portfolio, emphasis on proven technologies and long-term partnerships will result in less cyclical, lower risk, more predictable cash flows which can drive shareholder value in periods to come.

Teleflex (TFX), a global provider of primarily single-use medical devices used by hospitals and healthcare providers for common diagnostic, therapeutic procedures, and surgical applications was added to the portfolio on our belief that the company’s diverse portfolio of industry leading brands can drive shareholder value as procedure volumes continue to recover. Furthermore, company specific margin improvement initiatives, product mix shift towards faster growing, more profitable products, and increased penetration internationally should also benefit shareholders over the next several years, in our view.

SELLS/LIQUIDATIONS

Altra Industrial Motion (AIMC), a global manufacturer and supplier of motion control, power transmission and automation products was removed from the portfolio after being acquired by Regal Rexnord Corporation (NYSE: RRX).

iStar (STAR), an internally-managed real estate investment trust specializing in ground leases, was removed from the portfolio following the completion of its merger with Safehold Inc. and the spinoff of the company’s non-ground lease assets. We maintain a position in the newly created business entity which now trades under the ticker “SAFE” and operates as the only self-managed, pure-play ground lease company in the public markets.

PacWest Bancorp (PACW), a West Coast relationship-based community bank focused on providing business banking and treasury management services to small, middle-market, and venture-backed businesses, was sold from the portfolio due to our belief that future shareholder value creation may be impeded by uncertainties related to the bank’s exposure to late-stage venture capital sponsored clients, and that the company’s risk/reward potential was no longer justified.

Signature Bank (SBNY), a full-service commercial bank with offices across the U.S, was sold from the portfolio following the FDIC takeover and subsequent carve-out of Signature Bridge Bank. Having followed Signature Bank for almost two decades, our investment thesis was predicated on the belief that Signature Bank was a traditional commercial bank with a diversified clientele and business model. The bank has a history of finding attractive industries/ecosystems that have robust deposit needs and serving these areas well. Its unique operating model of acquiring experienced private client teams drove strong deposit and loan growth, while the autonomy provided to the teams helped keep overhead costs low. The company continued to acquire teams to further its growth, and we expected its successful integration of these teams to continue, particularly on the West Coast. On a fundamental basis, we believed the company had been executing well, highlighted by record annual earnings in 2022, expanding margins, loan growth, new teams added, and clean credit metrics. However, given the heightened scrutiny of the recent events involving Silicon Valley Bank and Silvergate Capital, some of the bank’s depositors opted to pull their money creating a run on the bank despite significant qualitative and quantitative differences between those two entities and Signature Bank. The company’s digital payments platform appeared to be the source of investor confusion despite its limited financial impact on the bank’s overall business. As part of this business, Signature Bank facilitated crypto-based transactions by holding customer’s U.S. Dollar-backed crypto tokens as deposits. The bank did not, however, engage in crypto-backed lending or trading and did not hold any cryptocurrencies on its balance sheet. Moreover, the company had recently announced its plans to intentionally reduce its digital assets exposure a move we expected to reduce future earnings power from 2022 levels but would help alleviate some of the negative investor sentiment. Many specific details of what prompted regulators to step in, eventually leading to the downfall of Signature Bank, are still unknown, however, we ultimately liquidated our remaining position late in the quarter after shares reopened for trading.

Outlook

After inflationary pressures, rising borrowing costs, and geopolitical turmoil created headwinds for investors in 2022, fears of an impending banking crisis and a slowing economy pose new threats in 2023. While sentiment moderately stabilized into quarter end, continued uncertainty and increased risks of recession will likely keep market participants on edge for the foreseeable future. Against this backdrop, we continue to believe the Federal Reserve will be a key driver of market volatility going forward. Specifically, now that the Fed’s initial batch rate increases are in the rearview mirror, the ongoing debate and positioning around any future Fed activity (or lack thereof) is likely to create continued bouts of volatility in both the equity and fixed income markets due to the implications on the strength of the U.S. economy, inflation expectations, and the resulting impact on corporate profitability. Another key item to watch over the coming months will be the extent to which recent events cause banks to reduce lending. This in turn may weigh on consumer demand and business investment and therefore accelerate any slowdown in the economy. As such, we will be paying close attention to management commentary and financial disclosures throughout this upcoming earnings season, which may unearth or dispel many of these ongoing concerns. Either way, it’s not a stretch to assume that there’s likely to be more volatility in the coming months, making this a good time to remember the benefits of portfolio diversification, remaining disciplined, and staying focused on companies with higher-quality characteristics such as stable earnings, clean balance sheets, and reasonable valuations.

From an asset class perspective, valuations of SMID versus large cap remain near multi-decade lows, which we believe suggests a more favorable setup for SMID caps relative to large caps in the periods to come (12.9x P/E for the Russell 2500 Index vs. 19.2x P/E for the Russell 1000 Index). SMID caps, as represented by the Russell 2500, also remain historically attractive on an absolute basis and are trading near their lowest levels in over 30 years, slightly above the lows during the GFC and below the COVID-19 recession and 2001 recession lows. Additional benefits from re-shoring efforts, investments in automation amid wage inflation/tight labor markets, and spending to reduce emissions also favor small & mid caps which are beneficiaries of U.S. capex cycles. High and falling inflationary environments have also been favorable market environments for the asset class historically, a scenario we may find ourselves in this year. So, while the near-term outlook remains uncertain, along with the length and severity of any upcoming downturn, decades of investing have taught us that these can be the most rewarding times to be invested in SMID cap companies for the long-term. When the dust settles, we are reminded that small & mid cap companies typically start moving up before many of us know for sure that the economy has begun to reaccelerate, and that missing these early stages of a market recovery can be costly*.

Positioning

As always, our current positioning is a function of our bottom-up security selection process and our ability to identify what we view as attractive investment candidates, regardless of economic sector definitions. Overweights in Industrials and Information Technology are mostly a function of recent portfolio activity and the relative performance of our holdings in these sectors over the past few periods. Conversely, we continue to be underweight in Consumer Discretionary, as we have been unable to identify what we consider to be compelling long-term opportunities that fit our discipline given the rising risk profiles of many retail businesses and a potential deceleration in goods spending following a period of strength fueled in part by government backed stimulus payments. We also continue to be underweight in Real Estate as a result of structural challenges for various end markets within the sector. Given our focus on long-term business fundamentals, patient investment approach and low portfolio turnover, the strategy’s sector positioning generally does not change significantly from quarter to quarter. However, we may take advantage of periods of volatility by adding selectively to certain companies when appropriate.

*As measured by the average return of the Russell 2500 Index the year following periods of GDP growth <0% since 1980.

Disclosures

The opinions expressed herein are those of Aristotle Capital Boston, LLC (Aristotle Boston) and are subject to change without notice.

Past performance is not indicative of future results. The information provided in this report should not be considered financial advice or a recommendation to purchase or sell any particular security. There is no assurance that any securities discussed herein will remain in an account’s portfolio at the time you receive this report or that securities sold have not been repurchased. The securities discussed may not represent an account’s entire portfolio and, in the aggregate, may represent only a small percentage of an account’s portfolio holdings. The performance attribution presented is of a representative account from Aristotle Boston’s Small/Mid Cap Equity Composite. The representative account is a discretionary client account which was chosen to most closely reflect the investment style of the strategy. The criteria used for representative account selection is based on the account’s period of time under management and its similarity of holdings in relation to the strategy. It should not be assumed that any of the securities transactions, holdings or sectors discussed were or will be profitable, or that the investment recommendations or decisions Aristotle Boston makes in the future will be profitable or equal the performance of the securities discussed herein. Aristotle Boston reserves the right to modify its current investment strategies and techniques based on changing market dynamics or client needs. Recommendations made in the last 12 months are available upon request.

Returns are presented gross and net of investment advisory fees and include the reinvestment of all income. Gross returns will be reduced by fees and other expenses that may be incurred in the management of the account. Net returns are presented net of actual investment advisory fees and after the deduction of all trading expenses.

Effective January 1, 2022, the Russell 2500 Value Index was removed as the secondary benchmark for the Aristotle Boston Small/Mid Cap Equity strategy.

Non-fee-paying accounts represented less than 5% of the SMID Cap Composite assets from December 31, 2010 to December 31, 2013. As of December 31, 2014, there were no non-fee-paying accounts in the Composite. In instances where non-fee paying accounts were included in the SMID Cap Composite, the highest model fee was applied to recalculate the net returns for composite purposes and the impact on the since inception return of the composite was deemed immaterial.

All investments carry a certain degree of risk, including the possible loss of principal. Investments are also subject to political, market, currency and regulatory risks or economic developments. International investments involve special risks that may in particular cause a loss in principal, including currency fluctuation, lower liquidity, different accounting methods and economic and political systems, and higher transaction costs.

These risks typically are greater in emerging markets. Securities of small‐ and medium‐sized companies tend to have a shorter history of operations, be more volatile and less liquid. Value stocks can perform differently from the market as a whole and other types of stocks.

The material is provided for informational and/or educational purposes only and is not intended to be and should not be construed as investment, legal or tax advice and/or a legal opinion. Investors should consult their financial and tax adviser before making investments.

The opinions referenced are as of the date of publication, may be modified due to changes in the market or economic conditions, and may not necessarily come to pass.

The firm’s coverage of Signature Bank includes time at a predecessor firm.

Aristotle Capital Boston, LLC is an independent investment adviser registered under the Investment Advisers Act of 1940, as amended. Registration does not imply a certain level of skill or training. More information about Aristotle Boston, including our investment strategies, fees and objectives, can be found in our Form ADV Part 2, which is available upon request. ACB-2304-17

Performance Disclosures

Sources: SS&C Advent, Russell Investments

Composite returns for periods ended March 31, 2023 are preliminary pending final account reconciliation.

*The Aristotle Small/Mid Cap Equity Composite has an inception date of January 1, 2008 at a predecessor firm. During this time, Jack McPherson and Dave Adams had primary responsibility for managing the strategy. Performance starting January 1, 2015 was achieved at Aristotle Boston.

Effective January 1, 2022, the Russell 2500 Value Index was removed as the secondary benchmark for the Aristotle Boston Small/Mid Cap Equity Strategy.  Non-fee-paying accounts represented less than 5% of the SMID Cap Composite assets from December 31, 2010 to December 31, 2013. As of December 31, 2014, there were no non-fee-paying accounts in the Composite. In instances where non-fee paying accounts were included in the SMID Cap Composite, the highest model fee was applied to recalculate the net returns for composite purposes and the impact on the since inception return of the composite was deemed immaterial. Past performance is not indicative of future results. Performance results for periods greater than one year have been annualized.

Returns are presented gross and net of investment advisory fees and include the reinvestment of all income. Gross returns will be reduced by fees and other expenses that may be incurred in the management of the account. Net returns are presented net of actual investment advisory fees and after the deduction of all trading expenses. Please see important disclosures enclosed within this document.

Index Disclosures

The Russell 2500 Index is a subset of the Russell 3000® Index representing approximately 10% of the total market capitalization of that index. It includes approximately 2000 of the smallest securities based on a combination of their market cap and current index membership. The Russell 2500 Growth® Index measures the performance of the small/mid cap companies located in the United States that also exhibit a growth probability. The Russell 2500 Value® Index measures the performance of the small/mid cap companies located in the United States that also exhibit a value probability. The Russell 1000 Index is a subset of the Russell 3000® Index, representing approximately 90% of the total market capitalization of that index. It includes approximately 1,000 of the largest securities based on a combination of their market capitalization and current index membership. The volatility (beta) of the composite may be greater or less than the benchmarks. It is not possible to invest directly in these indices.

For more on Small Cap Equity, access the latest resources.

(All MSCI index returns are shown net and in U.S. dollars unless otherwise noted.)

Markets Review

Sources: SS&C Advent, Bloomberg
Past performance is not indicative of future results. Aristotle International Equity Composite returns are presented gross and net of investment advisory fees and include the reinvestment of all income. Gross returns will be reduced by fees and other expenses that may be incurred in the management of the account. Net returns are presented net of actual investment advisory fees and after the deduction of all trading expenses. Aristotle Capital Composite returns are preliminary pending final account reconciliation. Please see important disclosures at the end of this document.

Global equity markets rose in the first quarter of the year, as the MSCI ACWI Index increased 7.31% during the period. Concurrently, the Bloomberg Global Aggregate Bond Index increased 3.01%. In terms of style, growth stocks outperformed their value counterparts during the quarter, with the MSCI ACWI Growth Index beating the MSCI ACWI Value Index by 12.54%.

The MSCI EAFE Index climbed by 8.47% during the first quarter, while the MSCI ACWI ex USA Index increased 6.87%. Within the MSCI EAFE Index, Europe & Middle East and the U.K. were the strongest-performing regions, while Asia gained the least. On a sector basis, ten out of the eleven sectors within the MSCI EAFE Index posted positive returns, with Information Technology, Consumer Discretionary and Industrials generating the largest gains. Conversely, Real Estate was the only sector to finish in the red, while Energy and Financials gained the least.

Despite continued geopolitical tensions, persistent inflation and new concerns in the banking industry, the global economy proved to be resilient. This was seen by strong labor markets, robust household consumption and business investment in addition to effective management of Europe’s energy crisis. Additionally, China continued its relaxation of strict COVID rules by fully reopening its borders to travelers with all types of visas. As a result, the IMF increased its growth forecasts and now projects global growth of 3.4%, 2.9% and 3.1% in 2022, 2023 and 2024, respectively.

Inflation remained elevated in many regions, with the U.K. and eurozone reporting a 10.4% and 8.5% rate, respectively. Meanwhile, in Asia, Japan’s core consumer inflation hit a 41-year high of 4.2%. However, the pace of price increases moderated for other countries. This was the case for China and South Korea, where inflation rates declined to their lowest levels in 12 and 10 months, repectively. On a forward-looking basis, the IMF estimates global inflation will fall from 8.8% in 2022 to 6.6% in 2023 and 4.3% in 2024. The organization believes restrictive monetary policy and cooling commodity prices due to weaker demand will contribute to the pattern of disinflation.

During the quarter, the failure of U.S.-based, mid-sized institutions Silicon Valley Bank (SVB) and Signature Bank reverberated into the international market, adding a layer of complexity to restrictive central bank policies. After SVB’s closure due to a run on deposits, Credit Suisse also experienced withdrawals, further exacerbated by a subsequent plunging share price that led Swiss regulators to orchestrate a takeover by UBS. As a result of the turmoil in the banking sector, central banks in the U.S. and Europe have commented that credit conditions may have tightened more than some economic indicators currently suggest.

Lastly, on the geopolitical front, the war in Ukraine rages on in the eastern side of the country while southern lines have largely stabilized. Though China continues to align itself with Russia, China’s Ministry of Foreign Affairs released a paper calling for all parties to support dialogue to “gradually deescalate the situation.” Meanwhile, Western nations continue to support Ukraine, with commitments from the U.S., Germany and Britain to supply armored vehicles.

Performance and Attribution Summary

For the first quarter of 2023, Aristotle Capital’s International Equity Composite posted a total return of 7.10% gross of fees (6.98% net of fees), underperforming the MSCI EAFE Index, which returned 8.47%, and outperforming the MSCI ACWI ex USA Index, which returned 6.87%. Please refer to the table below for detailed performance

Performance (%) 1Q231 Year3 Years5 Years10 Years Since Inception*
International Equity Composite (gross)7.10-5.0713.254.165.395.21
International Equity Composite (net)6.98-5.5212.713.664.884.71
MSCI EAFE Index (net)8.47-1.3812.993.525.002.32
MSCI ACWI ex USA Index (net)6.87-5.0711.802.474.161.94
*The inception date for the International Equity Composite is January 1, 2008. Past performance is not indicative of future results. Aristotle International Equity Composite returns are presented gross and net of investment advisory fees and include the reinvestment of all income. Gross returns will be reduced by fees and other expenses that may be incurred in the management of the account. Net returns are presented net of actual investment advisory fees and after the deduction of all trading expenses. Aristotle Capital Composite returns are preliminary pending final account reconciliation. Please see important disclosures at the end of this document.

Source: FactSet

Past performance is not indicative of future results. Attribution results are based on sector returns which are gross of investment advisory fees. Attribution is based on performance that is gross of investment advisory fees and includes the reinvestment of income.

From a sector perspective in the first quarter, the portfolio’s underperformance relative to the MSCI EAFE Index can be attributed to security selection, while allocation effects had a positive impact. Security selection in Consumer Discretionary, Information Technology and Materials detracted the most from the portfolio’s relative performance. Conversely, overweights in Information Technology and Consumer Discretionary and a lack of exposure to Real Estate contributed to relative return.

Regionally, both security selection and allocation effects were responsible for the portfolio’s underperformance. Security selection in Europe and exposure to Canada detracted the most from relative performance, while an underweight and security selection in Asia contributed.

Contributors and Detractors for 1Q 2023

Relative ContributorsRelative Detractors
NemetschekMagna International
LVMHCredicorp
SonyDBS Group
Rentokil InitialKoninklijke DSM
FANUCAIA Group

Magna International, a Canada-based global auto parts, systems and assembly company, was a leading detractor during the quarter. The company continues to be impacted by the volatile production schedules of auto OEMs, primarily caused by semiconductor supply constraints. For some of Magna’s major customers, volumes are as low as 50%-60% of the contracted plan. This has created short-term inefficiencies in Magna’s ability to manage labor and its overall cost structure. However, we believe these headwinds are temporary in nature, as supply chains and car production levels will normalize over time. We instead remain focused on Magna’s unique capability of supplying parts for an increasingly electrified and autonomous fleet of vehicles. This includes Magna’s specialty in lightweighting vehicles—a necessity for heavy electric cars—as well as its years of investment in self-driving technologies. In addition, Magna signed an agreement in December 2022 to acquire Veoneer Active Safety for approximately $1.5 billion in cash. Veoneer’s advanced driver-assistance system (ADAS) technologies and Magna’s existing ADAS group, in our view, will benefit from enhanced scale and a larger product portfolio, ultimately allowing the company to reach a broader customer base.

AIA Group, a pan-Asian life insurance company headquartered in Hong Kong, was one of the largest detractors for the quarter. As a result of bank failures in both the U.S. and Europe, insurance companies were also scrutinized as potential vulnerabilities within the global financial system. However, given AIA’s strong capital position and ample liquidity, we believe the company is well positioned to withstand market volatility. In contrast to banks, life insurance companies like AIA have longer-duration liabilities than assets. This avoids liquidity pressure when interest rates rise and fixed-income portfolios are marked-to-market. We also see AIA’s investment exposure as limited due to its highly diversified corporate bond portfolio (with more than 1,900 issuers) and less than 5% of total invested assets in equities. As such, we remain focused on the company’s ability to benefit from its increasingly technology-enabled and productive agency salesforce. In fact, AIA’s VONB increased 6% in the second half of 2022, with growth across all of its largest markets. Moreover, we expect the company to further establish its direct presence in mainland China, a catalyst we previously identified, as it plans to reach another 10-12 affluent cities in the country by 2026.

LVMH Moët Hennessy Louis Vuitton, the luxury goods company, was a primary contributor for the quarter. China, one of the world’s largest luxury goods markets, has reopened following three years of various COVID lockdown policies and provided a boost for LVMH. While we are pleased to see the company (and industry) benefit from an improved macroeconomic environment, this is not, and was not, our focus when analyzing the fundamentals of LVMH’s business. Instead of attempting to time short-term factors out of the company’s control, we remain fixated on what LVMH can control. This includes the company’s progress on initiatives such as integrating the acquisitions of Tiffany & Co. and, most recently, the Pedemonte Group to bolster its Jewelry division; market share gains within the Fashion & Leather Goods segment; continued market leadership with the likes of Dior’s Sauvage being named the world leader in perfumes for 2022; and the expansion of the company’s store network and the development of production facilities. These improvements, we believe, more directly impact the company’s long-term fundamental outlook, regardless of the short-term macroeconomic landscape. Lastly, LVMH appointed Pharrell Williams as its new Men’s Creative Director, filling the role following the tragic passing of Virgil Abloh in 2021.

Rentokil Initial, the U.K.-based pest control and hygiene services company, was a leading contributor for the quarter. In late 2022, the company completed its previously announced $6.7 billion acquisition of Terminix to further solidify its position in the North American pest control market. We believed the acquisition, its largest ever, would provide operational synergies from scale efficiencies and in-market densification, as well as accelerate the consolidation of the U.S. pest control market. Initially, Rentokil estimated $150 million in cost synergies by 2025, and the company recently upgraded its target to at least $200 million. We are encouraged by the company’s integration progress and operations, which in turn have led to Rentokil’s highest operating margin in 20 years. We believe the fundamental improvements, combined with the resilient nature of the pest control business, will allow Rentokil to continue to unlock value in the years ahead.

Recent Portfolio Activity

BuysSells
NoneBrookfield Asset Management

During the quarter, we sold our position in Brookfield Asset Management.

We have been owners of Brookfield for well over a decade, having first invested in the fourth quarter of 2009. In December 2022, the company completed the spinoff of 25% of its asset management business, now known as Brookfield Asset Management (“Manager,” ticker: BAM). As part of the spinoff, the parent company, Brookfield Corporation (“Corporation,” ticker: BN), retained a 75% interest in the Manager. As such, we decided to sell our stake in the Manager and use the proceeds to top-up our investment in the Corporation. While we continue to find the Manager’s business attractive, we view Brookfield Corporation as a more optimal investment.

Conclusion

A core tenet of our investment philosophy is the commitment to understand businesses with a long-term perspective. For us, this is especially important during times of heightened uncertainty when macroeconomic events dominate headlines. We remain aware of short-term topics such as inflation, monetary policy and the recent shock to the banking system. However, we believe a competitive advantage of our investment process lies in the fact that, instead of reacting and repositioning our portfolio based on unknowns and unfolding events, our focus remains on business fundamentals. Fundamentals, we are convinced, are what dictate shareholder value in the long term. As such, we continue to attentively study what we believe are high-quality companies with sustainable competitive advantages poised to outperform their peers over full market cycles.

Disclosures

The opinions expressed herein are those of Aristotle Capital Management, LLC (Aristotle Capital) and are subject to change without notice. Past performance is not a guarantee or indicator of future results. This material is not financial advice or an offer to buy or sell any product. You should not assume that any of the securities transactions, sectors or holdings discussed in this report were or will be profitable, or that recommendations Aristotle Capital makes in the future will be profitable or equal the performance of the securities listed in this report. The portfolio characteristics shown relate to the Aristotle International Equity strategy. Not every client’s account will have these characteristics. Aristotle Capital reserves the right to modify its current investment strategies and techniques based on changing market dynamics or client needs. There is no assurance that any securities discussed herein will remain in an account’s portfolio at the time you receive this report or that securities sold have not been repurchased. The securities discussed may not represent an account’s entire portfolio and, in the aggregate, may represent only a small percentage of an account’s portfolio holdings. The performance attribution presented is of a representative account from Aristotle Capital’s International Equity Composite. The representative account is a discretionary client account which was chosen to most closely reflect the investment style of the strategy. The criteria used for representative account selection is based on the account’s period of time under management and its similarity of holdings in relation to the strategy. Recommendations made in the last 12 months are available upon request.

Returns are presented gross and net of investment advisory fees and include the reinvestment of all income. Gross returns will be reduced by fees and other expenses that may be incurred in the management of the account. Net returns are presented net of actual investment advisory fees and after the deduction of all trading expenses.

All investments carry a certain degree of risk, including the possible loss of principal. Investments are also subject to political, market, currency and regulatory risks or economic developments. International investments involve special risks that may in particular cause a loss in principal, including currency fluctuation, lower liquidity, different accounting methods and economic and political systems, and higher transaction costs. These risks typically are greater in emerging markets. Securities of small‐ and medium‐sized companies tend to have a shorter history of operations, be more volatile and less liquid. Value stocks can perform differently from the market as a whole and other types of stocks.

The material is provided for informational and/or educational purposes only and is not intended to be and should not be construed as investment, legal or tax advice and/or a legal opinion. Investors should consult their financial and tax adviser before making investments. The opinions referenced are as of the date of publication, may be modified due to changes in the market or economic conditions, and may not necessarily come to pass. Information and data presented has been developed internally and/or obtained from sources believed to be reliable. Aristotle Capital does not guarantee the accuracy, adequacy or completeness of such information.

Aristotle Capital Management, LLC is an independent registered investment adviser under the Advisers Act of 1940, as amended. Registration does not imply a certain level of skill or training. More information about Aristotle Capital, including our investment strategies, fees and objectives, can be found in our Form ADV Part 2, which is available upon request. ACM-2304-42

Performance Disclosures

Composite returns for all periods ended March 31, 2023 are preliminary pending final account reconciliation.

Past performance is not indicative of future results. The information provided should not be considered financial advice or a recommendation to purchase or sell any particular security or product. Performance results for periods greater than one year have been annualized.

Returns are presented gross and net of investment advisory fees and include the reinvestment of all income. Gross returns will be reduced by fees and other expenses that may be incurred in the management of the account. Net returns are presented net of actual investment advisory fees and after the deduction of all trading expenses.

Index Disclosures

The MSCI EAFE Index (Europe, Australasia, Far East) is a free float-adjusted market capitalization-weighted index that is designed to measure the equity market performance of developed markets, excluding the United States and Canada. The MSCI EAFE Index consists of the following 21 developed market country indices: Australia, Austria, Belgium, Denmark, Finland, France, Germany, Hong Kong, Ireland, Israel, Italy, Japan, the Netherlands, New Zealand, Norway, Portugal, Singapore, Spain, Sweden, Switzerland and the United Kingdom. The MSCI ACWI captures large and mid-cap representation across 23 developed market countries and 24 emerging markets countries. With approximately 3,000 constituents, the Index covers approximately 85% of the global investable equity opportunity set. The MSCI ACWI Growth Index captures large and mid-cap securities exhibiting overall growth style characteristics across 23 developed markets countries and 24 emerging markets countries. The MSCI ACWI Value Index captures large and mid-cap securities exhibiting overall value style characteristics across 23 developed markets countries and 24 emerging markets countries. The MSCI ACWI ex USA Index captures large and mid-cap representation across 22 of 23 developed markets countries (excluding the United States) and 24 emerging markets countries. With approximately 2,300 constituents, the Index covers approximately 85% of the global equity opportunity set outside the United States. The MSCI Emerging Markets Index is a free float-adjusted market capitalization-weighted index that is designed to measure the equity market performance of emerging markets. The MSCI Emerging Markets Index consists of the following 24 emerging market country indexes: Brazil, Chile, China, Colombia, Czech Republic, Egypt, Greece, Hungary, India, Indonesia, Korea, Kuwait, Malaysia, Mexico, Peru, Philippines, Poland, Qatar, Saudi Arabia, South Africa, Taiwan, Thailand, Turkey and United Arab Emirates. The S&P 500® Index is the Standard & Poor’s Composite Index of 500 stocks and is a widely recognized, unmanaged index of common stock prices. The Brent Crude Oil Index is a major trading classification of sweet light crude oil that serves as a major benchmark price for purchases of oil worldwide. The MSCI Japan Index is designed to measure the performance of the large and mid-cap segments of the Japanese market. With approximately 250 constituents, the Index covers approximately 85% of the free float-adjusted market capitalization in Japan. The Bloomberg Global Aggregate Bond Index is a flagship measure of global investment grade debt from 28 local currency markets. This multi-currency benchmark includes treasury, government-related, corporate and securitized fixed-rate bonds from both developed and emerging markets issuers. The MSCI United Kingdom Index is designed to measure the performance of the large and mid-cap segments of the U.K. market. With nearly 100 constituents, the Index covers approximately 85% of the free float-adjusted market capitalization in the United Kingdom. The MSCI Europe Index captures large and mid-cap representation across 15 developed markets countries in Europe. With approximately 430 constituents, the Index covers approximately 85% of the free float-adjusted market capitalization across the European developed markets equity universe. These indices have been selected as the benchmarks and are used for comparison purposes only. The volatility (beta) of the Composite may be greater or less than the respective benchmarks. It is not possible to invest directly in these indices.

For more on International Equity, access the latest resources.

Markets Review

Sources: SS&C Advent, Bloomberg
Past performance is not indicative of future results. Aristotle Value Equity Composite returns are presented gross and net of investment advisory fees and include the reinvestment of all income. Gross returns will be reduced by fees and other expenses that may be incurred in the management of the account. Net returns are presented net of actual investment advisory fees and after the deduction of all trading expenses. Aristotle Capital Composite returns are preliminary pending final account reconciliation. Please see important disclosures at the end of this document.

The U.S. equity market finished higher for the first quarter of the year, as the S&P 500 Index rose 7.50% during the period. Concurrently, the Bloomberg U.S. Aggregate Bond Index increased 2.96% for the quarter. In terms of style, the Russell 1000 Growth Index outperformed its value counterpart by 13.36% during the quarter.

Seven out of the eleven sectors within the Russell 1000 Value Index finished higher for the quarter, with Communication Services, Information Technology and Consumer Discretionary gaining the most. Meanwhile, Health Care, Financials and Energy were the worst-performing sectors.

Although inflation remained well above its historical average of 3.26%, the pace of price increases moderated during the quarter. As such, for the 12-month periods ending in January and February, annualized CPI figures declined from 6.4% to 6.0%, respectively. The pattern of disinflation was partly driven by decreases in the price of fuel, used vehicles and medical care services. The government also reported a deceleration in U.S. economic growth, as GDP increased 2.6% in the fourth quarter following the third quarter’s 3.2% increase. Weaker consumer spending and business investment were significant factors in the softer results. However, retail sales in January jumped 3%, and the labor market remained tight, with an unemployment rate of 3.6%.

While some economic data points trended in a positive direction, the market was shocked with the regulatory shutdown of Silicon Valley Bank (SVB), the second-largest bank failure by assets in U.S. history. The value of SVB’s bond holdings had plunged amid rapidly increasing interest rates, creating a shortfall as clients (largely composed of tech startups) withdrew their deposits, eventually leading to a run on the bank’s deposits. Just days later, regulators also took control of New York-based Signature Bank. The speed and size of the bank failures sent U.S. bank share prices tumbling. To provide stability, the Federal Reserve announced the creation of an emergency lending facility that would allow banks to deposit high-quality assets (e.g., Treasuries and mortgage-backed securities) in exchange for a cash advance worth the face value of the asset (instead of the market value). Additionally, First Citizens Bank announced that it had made an agreement with the Federal Deposit Insurance Corporation (FDIC) for a whole bank purchase with loss share coverage of Silicon Valley Bridge Bank.

Despite the turmoil in the banking system, the Federal Reserve (Fed) stayed its course, increasing its benchmark rate by 0.25% in March (its ninth consecutive rate hike) to a range of 4.75% to 5.00%. However, noting that banking events may contribute to a more restrictive credit environment, the Fed tempered its stance that further rate increases are necessary to restore price stability and achieve its 2% inflation target. Rather, Fed Chair Powell emphasized the reliance on incoming data to inform the future path of monetary policy, as conditions may have tightened more than economic indices currently suggest.

On the corporate earnings front, results and guidance were broadly underwhelming, with only 68% of S&P 500 companies exceeding EPS estimates (below the five-year average of 77%) and 67% of companies providing negative EPS guidance (above the five-year average of 59%). Overall, the S&P 500 companies reported a decline in earnings of 4.9% as inflation and recession remained prevalent topics, with 332 and 148 companies mentioning those words on earnings calls, respectively. Nevertheless, in spite of the weaker-than-expected results, there have also been positive remarks of cost cutting, moderating input price pressures and better supply-chain dynamics.

Performance and Attribution Summary

For the first quarter of 2023, Aristotle Capital’s Value Equity Composite posted a total return of 3.88% gross of fees (3.82% net of fees), outperforming the 1.01% return of the Russell 1000 Value Index and underperforming the 7.50% return of the S&P 500 Index. Please refer to the table for detailed performance.

Performance (%) 1Q23 1 Year3 Years5 Years10 Years
Value Equity Composite (gross)3.88-4.3819.179.7011.98
Value Equity Composite (net)3.82-4.6218.879.3911.63
Russell 1000 Value Index1.01-5.9117.937.499.12
S&P 500 Index7.50-7.7318.6011.1812.23
Past performance is not indicative of future results. Aristotle Value Equity Composite returns are presented gross and net of investment advisory fees and include the reinvestment of all income. Gross returns will be reduced by fees and other expenses that may be incurred in the management of the account. Net returns are presented net of actual investment advisory fees and after the deduction of all trading expenses. Aristotle Capital Composite returns are preliminary pending final account reconciliation. Please see important disclosures at the end of this document.

Source: FactSet
Past performance is not indicative of future results. Attribution results are based on sector returns which are gross of investment advisory fees. Attribution is based on performance that is gross of investment advisory fees and includes the reinvestment of income.

The portfolio’s outperformance relative to the Russell 1000 Value Index in the first quarter can be attributed to both security selection and allocation effects. An overweight in Information Technology and security selection in Consumer Discretionary and Information Technology contributed the most to relative performance. Conversely, an underweight in Communication Services and security selection in Industrials and Materials detracted. (Relative weights are the result of bottom-up security selection.)

Contributors and Detractors for 1Q 2023

Relative ContributorsRelative Detractors
ANSYSCullen/Frost Bankers
MicrosoftPNC Financial Services
Microchip TechnologyRPM International
LennarHoneywell
SonyCommerce Bancshares

ANSYS, an industry leader in engineering simulation software, was the top contributor during the quarter. The company reported strong results, with its annual contract value (ACV) advancing 14% to $2 billion in 2022, supported by broad-based growth across all major industries and geographies. This, in our opinion, exemplifies the significant value ANSYS’s software provides, enabling its customers (that include automotive, aerospace, consumer goods, energy and health care firms) to save time and money by testing products before the design process is complete. The applications for ANSYS’s software suite have expanded over the years, as even the simplest products have increased in complexity, continuously elevating the need for simulation. Meanwhile,  the market for ANSYS products remains underpenetrated, with only a fraction of design engineers currently utilizing simulation software. Given the scale of its user base, high switching costs, network effects, technological leadership and overall reputation across many disciplines (from fluid dynamics to electromagnetics), we believe the company is uniquely positioned to further increase its market share, as simulation becomes more ubiquitous across industries and product types.

Lennar, one of the nation’s largest homebuilders, was a primary contributor for the quarter. Following a housing surge supported by low mortgage rates and government stimulus, U.S. home sales activity began to decline in 2022 as rapidly rising mortgage rates reduced affordability. Over our decade-plus investment in Lennar, we have admired the management team’s ability to quickly respond to changing housing dynamics. Recent times were no exception, as Lennar adopted a dynamic pricing model that, in combination with its digital-marketing platform, helped to protect its backlog and prevent cancellations. As a result, fiscal first-quarter orders declined 10% year-over-year compared to a 38% decline for the homebuilder industry. The company has also made progress on its transition to a lighter asset strategy, a catalyst we previously identified, now controlling 68% of its land through options (up from 39% in 2020). Less capital tied up in land and the ability to acquire parcels on a just-in-time basis, in our opinion, should support enhanced FREE cash flow generation. As such, we believe Lennar’s strong balance sheet, prudent inventory management and further ability to implement cost and production efficiencies position it well to both overcome near-term housing market softness and benefit from the decade-long undersupply of homes in the U.S.

Cullen/Frost Bankers, the Texas-based bank, was the largest detractor for the period. Given the heightened levels of uncertainty after the collapse of SVB and Signature Bank, regional banks were scrutinized as potential vulnerabilities within the U.S. banking system. Despite the recent events, we remain confident in Cullen/Frost’s ability to withstand short-term volatility based on its long and proven history and strong capital position. Since the company’s inception in 1868, Cullen/Frost has employed a conservative strategy and a client service-centric model that allowed it to be the only Texas bank to survive the 1980s Texas banking collapse, oil crisis and real estate market crash without federal assistance or a takeover, and it was also the first bank to decline TARP (Troubled Asset Relief Program) bailout funds during the Global Financial Crisis of 2008. Cullen/Frost continues to utilize this strategy, with a relatively low loan-to-deposit ratio of 38% and current capital ratios in excess of well-capitalized levels. The company’s strong balance sheet management and steady, relationship-based approach have led to consistent levels of profitability and 29 consecutive years of dividend increases. We believe Cullen/Frost remains in a strong position to navigate the current short-term environment, continue to win market share in areas such as Houston and Dallas, and generate returns for shareholders in the long run.

RPM International, the coatings, sealants and building materials manufacturer, was one of the biggest detractors for the quarter. The combination of higher interest rates (which have negatively impacted construction activity and existing home sales), temporarily moderating customer purchases and cost inflation has weighed on the company and the overall coatings industry. Despite the challenging short-term macroeconomic landscape, RPM continues to demonstrate fundamental improvement. In response to inflation, the company has successfully increased pricing while simultaneously launching and executing on its latest Margin Achievement Plan (MAP 2025), which aims to make operational improvements by optimizing RPM’s manufacturing footprint, expanding categories of centralized procurement and executing on value-added selling. We believe the company’s ongoing focus on operational efficiency should allow it to continue to enhance its long-term FREE cash flow generation, which it can use to innovate new products and opportunistically deploy capital in the form of accretive acquisitions or returning value back to shareholders, as demonstrated by RPM’s ability to increase its dividend for 49 consecutive years.

Recent Portfolio Activity

During the quarter, we exited our investment in PayPal Holdings.

We first invested in PayPal, the online and mobile e-commerce payments company, during the third quarter of 2015. Over the past decade, we have studied PayPal’s ability to grow its extensive dual network (difficult to replicate, in our opinion) while navigating numerous competitors entering the industry.

BuysSells
NonePayPal Holdings

During our ownership period, the company has increased its payment volumes and made progress on many of its strategic initiatives, including adding partnerships with various companies (e.g., Walmart and American Express). We believe this has made the company a stronger force in the payments ecosystem. More recently, PayPal has shifted from its prior strategy of growing its user base to instead focusing on increasing transactions per user. The company has also seen an ongoing mix shift away from the PayPal branded checkout business toward its non-branded business Braintree. The non-branded business has a lower take rate, as its customers are primarily large enterprises (like Uber, Airbnb and Live Nation) with which bespoke rates are negotiated. In addition, PayPal has experienced recent leadership changes, including the 2022 departure of then-CFO John Rainey and CEO Dan Schulman’s announced retirement at the end of 2023. We will continue our research on the payments business and take our time to better understand these transitions. In the meantime, we decided PayPal was the best candidate for sale to fund the purchase of a what we believe to be a more optimal investment (which we will discuss at a later date).

Conclusion

A core tenet of our investment philosophy is the commitment to understand businesses with a long-term perspective. For us, this is especially important during times of heightened uncertainty when macroeconomic events dominate headlines. We remain aware of short-term topics such as inflation, monetary policy and the recent shock to the banking system. However, we believe a competitive advantage of our investment process lies in the fact that, instead of reacting and repositioning our portfolio based on unknowns and unfolding events, our focus remains on business fundamentals. Fundamentals, we are convinced, are what dictate shareholder value in the long term. As such, we continue to attentively study what we believe are high-quality companies with sustainable competitive advantages poised to outperform their peers over full market cycles.

Disclosures

The opinions expressed herein are those of Aristotle Capital Management, LLC (Aristotle Capital) and are subject to change without notice. Past performance is not a guarantee or indicator of future results. This material is not financial advice or an offer to purchase or sell any product. You should not assume that any of the securities transactions, sectors or holdings discussed in this report were or will be profitable, or that recommendations Aristotle Capital makes in the future will be profitable or equal the performance of the securities listed in this report. The portfolio characteristics shown relate to the Aristotle Value Equity strategy. Not every client’s account will have these characteristics. Aristotle Capital reserves the right to modify its current investment strategies and techniques based on changing market dynamics or client needs. There is no assurance that any securities discussed herein will remain in an account’s portfolio at the time you receive this report or that securities sold have not been repurchased. The securities discussed may not represent an account’s entire portfolio and, in the aggregate, may represent only a small percentage of an account’s portfolio holdings. The performance attribution presented is of a representative account from Aristotle Capital’s Value Equity Composite. The representative account is a discretionary client account which was chosen to most closely reflect the investment style of the strategy. The criteria used for representative account selection is based on the account’s period of time under management and its similarity of holdings in relation to the strategy. Recommendations made in the last 12 months are available upon request.

Returns are presented gross and net of investment advisory fees and include the reinvestment of all income. Gross returns will be reduced by fees and other expenses that may be incurred in the management of the account. Net returns are presented net of actual investment advisory fees and after the deduction of all trading expenses.

All investments carry a certain degree of risk, including the possible loss of principal. Investments are also subject to political, market, currency and regulatory risks or economic developments. International investments involve special risks that may in particular cause a loss in principal, including currency fluctuation, lower liquidity, different accounting methods and economic and political systems, and higher transaction costs. These risks typically are greater in emerging markets. Securities of small‐ and medium‐sized companies tend to have a shorter history of operations, be more volatile and less liquid. Value stocks can perform differently from the market as a whole and other types of stocks.

The material is provided for informational and/or educational purposes only and is not intended to be and should not be construed as investment, legal or tax advice and/or a legal opinion. Investors should consult their financial and tax adviser before making investments. The opinions referenced are as of the date of publication, may be modified due to changes in the market or economic conditions, and may not necessarily come to pass. Information and data presented has been developed internally and/or obtained from sources believed to be reliable. Aristotle Capital does not guarantee the accuracy, adequacy or completeness of such information.

Aristotle Capital Management, LLC is an independent registered investment adviser under the Advisers Act of 1940, as amended. Registration does not imply a certain level of skill or training. More information about Aristotle Capital, including our investment strategies, fees and objectives, can be found in our ADV Part 2, which is available upon request. ACM-2304-20

Performance Disclosures

Composite returns for all periods ended March 31, 2023 are preliminary pending final account reconciliation.

Past performance is not indicative of future results. The information provided should not be considered financial advice or a recommendation to purchase or sell any particular security or product. Performance results for periods greater than one year have been annualized. The Aristotle Value Equity strategy has an inception date of November 1, 2010; however, the strategy initially began at Mr. Gleicher’s predecessor firm in October 1997. A supplemental performance track record from January 1, 2001 through October 31, 2010 is provided above. The returns are based on two separate accounts and performance results are based on custodian data. During this time, Mr. Gleicher had primary responsibility for managing the two accounts. Mr. Gleicher began managing one account in November 2000 and the other December 2000.

Returns are presented gross and net of investment advisory fees and include the reinvestment of all income. Gross returns will be reduced by fees and other expenses that may be incurred in the management of the account. Net returns are presented net of actual investment advisory fees and after the deduction of all trading expenses.

Index Disclosures

The Russell 1000 Value® Index measures the performance of the large cap value segment of the U.S. equity universe. It includes those Russell 1000 Index companies with lower price-to-book ratios and lower expected growth values. The S&P 500® Index is the Standard & Poor’s Composite Index of 500 stocks and is a widely recognized, unmanaged index of common stock prices. The Russell 1000® Growth Index measures the performance of the large cap growth segment of the U.S. equity universe. It includes those Russell 1000 companies with higher price-to-book ratios and higher forecasted growth values. The Russell 2000® Index measures the performance of the small cap segment of the U.S. equity universe. The Russell 2000 Index is a subset of the Russell 3000® Index representing approximately 10% of the total market capitalization of that index. It includes approximately 2,000 of the smallest securities based on a combination of their market cap and current index membership. The Dow Jones Industrial Average® is a price-weighted measure of 30 U.S. blue-chip companies. The Index covers all industries except transportation and utilities. The NASDAQ Composite Index measures all NASDAQ domestic and international based common type stocks listed on The NASDAQ Stock Market. The NASDAQ Composite includes over 3,000 companies, more than most other stock market indexes. The Bloomberg U.S. Aggregate Bond Index is an unmanaged index of domestic investment grade bonds, including corporate, government and mortgage-backed securities. The WTI Crude Oil Index is a major trading classification of sweet light crude oil that serves as a major benchmark price for oil consumed in the United States. The 3-Month U.S. Treasury Bill is a short-term debt obligation backed by the U.S. Treasury Department with a maturity of three months. Consumer Price Index is a measure of the average change over time in the prices paid by urban consumers for a market basket of consumer goods and services. The volatility (beta) of the Composite may be greater or less than its respective benchmarks. It is not possible to invest directly in these indices.

(All MSCI index returns are shown net and in U.S. dollars unless otherwise noted.)

Markets Review

Sources: SS&C Advent, Bloomberg
Past performance is not indicative of future results. Aristotle Global Equity Composite returns are presented gross and net of investment advisory fees and include the reinvestment of all income. Gross returns will be reduced by fees and other expenses that may be incurred in the management of the account. Net returns are presented net of actual investment advisory fees and after the deduction of all trading expenses. Aristotle Capital Composite returns are preliminary pending final account reconciliation. Please see important disclosures at the end of this document.

Global equity markets rose in the first quarter of the year, as the MSCI ACWI Index increased 7.31% during the period. Concurrently, the Bloomberg Global Aggregate Bond Index increased 3.01%. In terms of style, growth stocks outperformed their value counterparts during the quarter, with the MSCI ACWI Growth Index beating the MSCI ACWI Value Index by 12.54%.

Regionally, Latin America and Europe were the strongest performers during the quarter. On the other hand, Asia/Pacific ex-Japan and Emerging Markets were the weakest performers. On a sector basis, seven out of the eleven sectors within the MSCI ACWI Index posted gains, with Information Technology, Communication Services and Consumer Discretionary being the best performers. The worst performers were Energy, Health Care and Utilities.

Despite continued geopolitical tensions, persistent inflation and new concerns in the banking industry, the global economy proved to be resilient. This was seen by strong labor markets, robust household consumption and business investment in addition to effective management of Europe’s energy crisis. Additionally, China continued its relaxation of strict COVID rules by fully reopening its borders to travelers with all types of visas. As a result, the IMF increased its growth forecasts and now projects global growth of 3.4%, 2.9% and 3.1% in 2022, 2023 and 2024, respectively.

Inflation remained elevated in many regions, with the U.K, eurozone and U.S. reporting a 10.4%, 8.5% and 6.0% rate, respectively. Meanwhile, in Asia, Japan’s core consumer inflation hit a 41-year high of 4.2%. However, the pace of price increases moderated for other countries. This was the case for China and South Korea, where inflation rates declined to their lowest levels in 12 and 10 months, repectively. On a forward-looking basis, the IMF estimates global inflation will fall from 8.8% in 2022 to 6.6% in 2023 and 4.3% in 2024. The organization believes restrictive monetary policy and cooling commodity prices due to weaker demand will contribute to the pattern of disinflation.

During the quarter, the failure of U.S.-based, mid-sized institutions Silicon Valley Bank (SVB) and Signature Bank reverberated into the international market, adding a layer of complexity to restrictive central bank policies. After SVB’s closure due to a run on deposits, Credit Suisse also experienced withdrawals, further exacerbated by a subsequent plunging share price that led Swiss regulators to orchestrate a takeover by UBS. As a result of the turmoil in the banking sector, central banks in the U.S. and Europe have commented that credit conditions may have tightened more than some economic indicators currently suggest.

Lastly, on the geopolitical front, the war in Ukraine rages on in the eastern side of the country while southern lines have largely stabilized. Though China continues to align itself with Russia, China’s Ministry of Foreign Affairs released a paper calling for all parties to support dialogue to “gradually deescalate the situation.” Meanwhile, Western nations continue to support Ukraine, with commitments from the U.S., Germany and Britain to supply armored vehicles.

Performance and Attribution Summary

For the first quarter of 2023, Aristotle Capital’s Global Equity Composite posted a total return of 6.11% gross of fees (6.03% net of fees), underperforming the MSCI World Index, which returned 7.73%, and the MSCI ACWI Index, which returned 7.31%. Please refer to the table below for detailed performance.

Performance (%) 1Q231 Year3 Years5 Years10 YearsSince Inception*
Global Equity Composite (gross)6.11-3.3217.047.999.579.55
Global Equity Composite (net)6.03-3.6216.677.629.179.11
MSCI World Index (net)7.73-7.0216.408.008.858.92
MSCI ACWI Index (net)7.31-7.4415.366.928.058.03
*The inception date for the Global Equity Composite is November 1, 2010. Past performance is not indicative of future results. Aristotle Global Equity Composite returns are presented gross and net of investment advisory fees and include the reinvestment of all income. Gross returns will be reduced by fees and other expenses that may be incurred in the management of the account. Net returns are presented net of actual investment advisory fees and after the deduction of all trading expenses. Aristotle Capital Composite returns are preliminary pending final account reconciliation. Please see important disclosures at the end of this document.

Source: FactSet

Past performance is not indicative of future results. Attribution results are based on sector returns which are gross of investment advisory fees. Attribution is based on performance that is gross of investment advisory fees and includes the reinvestment of income.

From a sector perspective, the portfolio’s underperformance relative to the MSCI World Index can be attributed to security selection, while allocation effects had a slightly positive impact. Security selection in Materials, Information Technology and Consumer Discretionary detracted the most from the portfolio’s relative performance. Conversely, security selection in Financials and Energy and an overweight in Consumer Discretionary contributed to relative return.

Regionally, both allocation effects and security selection were responsible for the portfolio’s underperformance relative to the MSCI World Index. Security selection in North America and Asia/Pacific ex-Japan detracted the most from relative performance, while an overweight in Europe and security selection in Japan contributed.

Contributors and Detractors for 1Q 2023

Relative ContributorsRelative Detractors
NemetschekRPM International
Microchip TechnologyAmgen
LVMHDanaher
LennarHoneywell
SonyGeneral Dynamics

RPM International, the coatings, sealants and building materials manufacturer, was one of the biggest detractors for the quarter. The combination of higher interest rates (which have negatively impacted construction activity and existing home sales), temporarily moderating customer purchases and cost inflation has weighed on the company and the overall coatings industry. Despite the challenging short-term macroeconomic landscape, RPM continues to demonstrate fundamental improvement. In response to inflation, the company has successfully increased pricing while simultaneously launching and executing on its latest Margin Achievement Plan (MAP 2025), which aims to make operational improvements by optimizing RPM’s manufacturing footprint, expanding categories of centralized procurement and executing on value-added selling. We believe the company’s ongoing focus on operational efficiency should allow it to continue to enhance its long-term FREE cash flow generation, which it can use to innovate new products and opportunistically deploy capital in the form of accretive acquisitions or returning value back to shareholders, as demonstrated by RPM’s ability to increase its dividend for 49 consecutive years.

Honeywell, the U.S.-based multinational industrial conglomerate, was one of the largest detractors during the quarter. Shares declined as management highlighted temporary issues affecting margins and the ability to meet demand in some of the company’s segments. These issues included component shortages in its Aerospace division, as well as severe cold weather that impacted production of its performance chemicals business. Despite the short-term setbacks, Honeywell continues to benefit from strong demand for its products across its various business segments. This is evidenced by the company’s record backlog, which grew to $29.6 billion in the fourth quarter—up 7% year-over-year. Additionally, during the quarter, CEO Darius Adamczyk announced he will step down in June of 2023 and hand the reins to current COO Vimal Kapur. Mr. Adamczyk built upon the work of his predecessor, famed former CEO David Cote, in the transformation of the business from what was once an over-leveraged, old-line industrial company to one poised for the digital age. We are impressed by Mr. Kapur’s 34-year tenure at Honeywell in increasingly important positions, including his leadership of Performance Materials and Technologies and Honeywell Building Technologies divisions. As such, we look forward to Mr. Kapur’s efforts to further advance Honeywell’s ability to leverage software across its massive industrial installed base and increase energy efficiency, productivity and connectivity (aka Industrial Internet of Things) for the company’s wide array of customers.

LVMH Moët Hennessy Louis Vuitton, the luxury goods company, was a primary contributor for the quarter. China, one of the world’s largest luxury goods markets, has reopened following three years of various COVID lockdown policies and provided a boost for LVMH. While we are pleased to see the company (and industry) benefit from an improved macroeconomic environment, this is not, and was not, our focus when analyzing the fundamentals of LVMH’s business. Instead of attempting to time short-term factors out of the company’s control, we remain fixated on what LVMH can control. This includes the company’s progress on initiatives such as integrating the acquisitions of Tiffany & Co. and, most recently, the Pedemonte Group to bolster its Jewelry division; market share gains within the Fashion & Leather Goods segment; continued market leadership with the likes of Dior’s Sauvage being named the world leader in perfumes for 2022; and the expansion of the company’s store network and the development of production facilities. These improvements, we believe, more directly impact the company’s long-term fundamental outlook, regardless of the short-term macroeconomic landscape. Lastly, LVMH appointed Pharrell Williams as its new Men’s Creative Director, filling the role following the tragic passing of Virgil Abloh in 2021.

Lennar, one of the nation’s largest homebuilders, was a primary contributor for the quarter. Following a housing surge supported by low mortgage rates and government stimulus, U.S. home sales activity began to decline in 2022 as rapidly rising mortgage rates reduced affordability. Over our decade-plus investment in Lennar, we have admired the management team’s ability to quickly respond to changing housing dynamics. Recent times were no exception, as Lennar adopted a dynamic pricing model that, in combination with its digital-marketing platform, helped to protect its backlog and prevent cancellations. As a result, fiscal first-quarter orders declined 10% year-over-year compared to a 38% decline for the homebuilder industry. The company has also made progress on its transition to a lighter asset strategy, a catalyst we previously identified, now controlling 68% of its land through options (up from 39% in 2020). Less capital tied up in land and the ability to acquire parcels on a just-in-time basis, in our opinion, should support enhanced FREE cash flow generation. As such, we believe Lennar’s strong balance sheet, prudent inventory management, and further ability to implement cost and production efficiencies position it well to both overcome near-term housing market softness and benefit from the decade-long undersupply of homes in the U.S.

Recent Portfolio Activity

BuysSells
NoneBrookfield Asset Management

During the quarter, we sold our position in Brookfield Asset Management.

The strategy has been invested in Brookfield since the first quarter of 2022. In December 2022, the company completed the spinoff of 25% of its asset management business, now known as Brookfield Asset Management (“Manager,” ticker: BAM). As part of the spinoff, the parent company, Brookfield Corporation (“Corporation,” ticker: BN), retained a 75% interest in the Manager. As such, we decided to sell our stake in the Manager and use the proceeds to top-up our investment in the Corporation. While we continue to find the Manager’s business attractive, we view Brookfield Corporation as a more optimal investment.

Conclusion

A core tenet of our investment philosophy is the commitment to understand businesses with a long-term perspective. For us, this is especially important during times of heightened uncertainty when macroeconomic events dominate headlines. We remain aware of short-term topics such as inflation, monetary policy and the recent shock to the banking system. However, we believe a competitive advantage of our investment process lies in the fact that, instead of reacting and repositioning our portfolio based on unknowns and unfolding events, our focus remains on business fundamentals. Fundamentals, we are convinced, are what dictate shareholder value in the long term. As such, we continue to attentively study what we believe are high-quality companies with sustainable competitive advantages poised to outperform their peers over full market cycles.

Disclosures

The opinions expressed herein are those of Aristotle Capital Management, LLC (Aristotle Capital) and are subject to change without notice. Past performance is not a guarantee or indicator of future results. This material is not financial advice or an offer to buy or sell any product. You should not assume that any of the securities transactions, sectors or holdings discussed in this report were or will be profitable, or that recommendations Aristotle Capital makes in the future will be profitable or equal the performance of the securities listed in this report. The portfolio characteristics shown relate to the Aristotle Global Equity strategy. Not every client’s account will have these characteristics. Aristotle Capital reserves the right to modify its current investment strategies and techniques based on changing market dynamics or client needs. There is no assurance that any securities discussed herein will remain in an account’s portfolio at the time you receive this report or that securities sold have not been repurchased. The securities discussed may not represent an account’s entire portfolio and, in the aggregate, may represent only a small percentage of an account’s portfolio holdings. The performance attribution presented is of a representative account from Aristotle Capital’s Global Equity Composite. The representative account is a discretionary client account which was chosen to most closely reflect the investment style of the strategy. The criteria used for representative account selection is based on the account’s period of time under management and its similarity of holdings in relation to the strategy. Recommendations made in the last 12 months are available upon request.

Returns are presented gross and net of investment advisory fees and include the reinvestment of all income. Gross returns will be reduced by fees and other expenses that may be incurred in the management of the account. Net returns are presented net of actual investment advisory fees and after the deduction of all trading expenses.

All investments carry a certain degree of risk, including the possible loss of principal. Investments are also subject to political, market, currency and regulatory risks or economic developments. International investments involve special risks that may in particular cause a loss in principal, including currency fluctuation, lower liquidity, different accounting methods and economic and political systems, and higher transaction costs. These risks typically are greater in emerging markets. Securities of small‐ and medium‐sized companies tend to have a shorter history of operations, be more volatile and less liquid. Value stocks can perform differently from the market as a whole and other types of stocks.

The material is provided for informational and/or educational purposes only and is not intended to be and should not be construed as investment, legal or tax advice and/or a legal opinion. Investors should consult their financial and tax adviser before making investments. The opinions referenced are as of the date of publication, may be modified due to changes in the market or economic conditions, and may not necessarily come to pass. Information and data presented has been developed internally and/or obtained from sources believed to be reliable. Aristotle Capital does not guarantee the accuracy, adequacy or completeness of such information.

Aristotle Capital Management, LLC is an independent investment adviser registered under the Investment Advisers Act of 1940, as amended. Registration does not imply a certain level of skill or training. More information about Aristotle Capital, including our investment strategies, fees and objectives, can be found in our Form ADV Part 2, which is available upon request. ACM-2304-95

Performance Disclosures

Composite returns for all periods ended March 31, 2023 are preliminary pending final account reconciliation.

The Aristotle Global Equity Composite has an inception date of November 1, 2010; however, the strategy initially began at Howard Gleicher’s predecessor firm in July 2007. A supplemental performance track record from January 1, 2008 through October 31, 2010 is provided on this page and complements the Global Equity Composite presentation that is located at the end of this presentation. The performance results were achieved while Mr. Gleicher managed the strategy at a prior firm. The returns are those of a publicly available mutual fund from the fund’s inception through Mr. Gleicher’s departure from the firm. During that time, Mr. Gleicher had primary responsibility for managing the fund.

Past performance is not indicative of future results. The information provided should not be considered financial advice or a recommendation to purchase or sell any particular security or product. Performance results for periods greater than one year have been annualized.

Returns are presented gross and net of investment advisory fees and include the reinvestment of all income. Gross returns will be reduced by fees and other expenses that may be incurred in the management of the account. Net returns are presented net of actual investment advisory fees and after the deduction of all trading expenses.

Index Disclosures

The MSCI World Index is a free float-adjusted market capitalization weighted index that is designed to measure the equity market performance of developed markets. The MSCI World Index consists of the following 23 developed market country indices: Australia, Austria, Belgium, Canada, Denmark, Finland, France, Germany, Hong Kong, Ireland, Israel, Italy, Japan, Netherlands, New Zealand, Norway, Portugal, Singapore, Spain, Sweden, Switzerland, the United Kingdom and the United States. The MSCI Emerging Markets Index is a free float-adjusted market capitalization-weighted index that is designed to measure equity market performance of emerging markets. The MSCI Emerging Markets Index consists of the following 24 emerging market country indexes: Brazil, Chile, China, Colombia, Czech Republic, Egypt, Greece, Hungary, India, Indonesia, Korea, Kuwait, Malaysia, Mexico, Peru, Philippines, Poland, Qatar, Saudi Arabia, South Africa, Taiwan, Thailand, Turkey and United Arab Emirates. The MSCI ACWI captures large and mid-cap representation across 23 developed markets and 24 emerging markets countries. With approximately 3,000 constituents, the Index covers approximately 85% of the global investable equity opportunity set. The MSCI ACWI Growth Index captures large and mid-cap securities exhibiting overall growth style characteristics across 23 developed markets countries and 24 emerging markets countries. The MSCI ACWI Value Index captures large and mid-cap securities exhibiting overall value style characteristics across 23 developed markets countries and 24 emerging markets countries. The MSCI Europe Index captures large and mid-cap representation across 15 developed markets countries in Europe. With more than 400 constituents, the Index covers approximately 85% of the free float-adjusted market capitalization across the European developed markets equity universe. The MSCI Japan Index is designed to measure the performance of the large and mid-cap segments of the Japanese market. With approximately 250 constituents, the Index covers approximately 85% of the free float-adjusted market capitalization in Japan. The S&P 500® Index is the Standard & Poor’s Composite Index of 500 stocks and is a widely recognized, unmanaged index of common stock prices. The NYSE FAANG+ Index is an equal-dollar-weighted index designed to represent a segment of the Information Technology and Consumer Discretionary sectors consisting of highly traded growth stocks of technology and tech-enabled companies, such as Facebook, Apple, Amazon, Netflix and Alphabet’s Google. The Bloomberg Global Aggregate Bond Index is a flagship measure of global investment grade debt from 28 local currency markets. This multi-currency benchmark includes Treasury, government-related, corporate and securitized fixed rate bonds from both developed and emerging markets issuers. The Brent Crude Oil Index is a major trading classification of sweet light crude oil that serves as a major benchmark price for purchases of oil worldwide. The volatility (beta) of the Composite may be greater or less than the benchmarks. It is not possible to invest directly in these indices.

(All MSCI index returns are shown net and in U.S. dollars unless otherwise noted.)

Markets Review

Sources: SS&C Advent, Bloomberg
Past performance is not indicative of future results. Aristotle International Equity Composite returns are presented gross and net of investment advisory fees and include the reinvestment of all income. Gross returns will be reduced by fees and other expenses that may be incurred in the management of the account. Net returns are presented net of actual investment advisory fees and after the deduction of all trading expenses. Aristotle Capital Composite returns are preliminary pending final account reconciliation. Please see important disclosures at the end of this document.

Global equity markets rose in the first quarter of the year, as the MSCI ACWI Index increased 7.31% during the period. Concurrently, the Bloomberg Global Aggregate Bond Index increased 3.01%. In terms of style, growth stocks outperformed their value counterparts during the quarter, with the MSCI ACWI Growth Index beating the MSCI ACWI Value Index by 12.54%.

The MSCI EAFE Index climbed by 8.47% during the first quarter, while the MSCI ACWI ex USA Index increased 6.87%. Within the MSCI EAFE Index, Europe & Middle East and the U.K. were the strongest-performing regions, while Asia gained the least. On a sector basis, ten out of the eleven sectors within the MSCI EAFE Index posted positive returns, with Information Technology, Consumer Discretionary and Industrials generating the largest gains. Conversely, Real Estate was the only sector to finish in the red, while Energy and Financials gained the least.

Despite continued geopolitical tensions, persistent inflation and new concerns in the banking industry, the global economy proved to be resilient. This was seen by strong labor markets, robust household consumption and business investment in addition to effective management of Europe’s energy crisis. Additionally, China continued its relaxation of strict COVID rules by fully reopening its borders to travelers with all types of visas. As a result, the IMF increased its growth forecasts and now projects global growth of 3.4%, 2.9% and 3.1% in 2022, 2023 and 2024, respectively.

Inflation remained elevated in many regions, with the U.K. and eurozone reporting a 10.4% and 8.5% rate, respectively. Meanwhile, in Asia, Japan’s core consumer inflation hit a 41-year high of 4.2%. However, the pace of price increases moderated for other countries. This was the case for China and South Korea, where inflation rates declined to their lowest levels in 12 and 10 months, repectively. On a forward-looking basis, the IMF estimates global inflation will fall from 8.8% in 2022 to 6.6% in 2023 and 4.3% in 2024. The organization believes restrictive monetary policy and cooling commodity prices due to weaker demand will contribute to the pattern of disinflation.

During the quarter, the failure of U.S.-based, mid-sized institutions Silicon Valley Bank (SVB) and Signature Bank reverberated into the international market, adding a layer of complexity to restrictive central bank policies. After SVB’s closure due to a run on deposits, Credit Suisse also experienced withdrawals, further exacerbated by a subsequent plunging share price that led Swiss regulators to orchestrate a takeover by UBS. As a result of the turmoil in the banking sector, central banks in the U.S. and Europe have commented that credit conditions may have tightened more than some economic indicators currently suggest.

Lastly, on the geopolitical front, the war in Ukraine rages on in the eastern side of the country while southern lines have largely stabilized. Though China continues to align itself with Russia, China’s Ministry of Foreign Affairs released a paper calling for all parties to support dialogue to “gradually deescalate the situation.” Meanwhile, Western nations continue to support Ukraine, with commitments from the U.S., Germany and Britain to supply armored vehicles.

Performance and Attribution Summary

For the first quarter of 2023, Aristotle Capital’s International Equity ADR Composite posted a total return of 6.59% gross of fees (6.43% net of fees), underperforming the MSCI EAFE Index, which returned 8.47%, and underperforming the MSCI ACWI ex USA Index, which returned 6.87%. Please refer to the table below for detailed performance.

Performance (%) 1Q231 Year3 Years5 Years Since Inception*
International Equity ADR Composite (gross)6.59-2.6814.584.595.54
International Equity ADR Composite (net)6.43-3.2314.024.125.03
MSCI EAFE Index (net)8.47-1.3812.993.524.80
MSCI ACWI ex USA Index (net)6.87-5.0711.802.474.10
*The inception date for the International Equity ADR Composite is June 1, 2013. Past performance is not indicative of future results. Aristotle International Equity ADR Composite returns are presented gross and net of investment advisory fees and include the reinvestment of all income. Gross returns will be reduced by fees and other expenses that may be incurred in the management of the account. Net returns are presented net of actual investment advisory fees and after the deduction of all trading expenses. Aristotle Capital Composite returns are preliminary pending final account reconciliation. Please see important disclosures at the end of this document.

Source: FactSet

Past performance is not indicative of future results. Attribution results are based on sector returns which are gross of investment advisory fees. Attribution is based on performance that is gross of investment advisory fees and includes the reinvestment of income.

From a sector perspective in the first quarter, the portfolio’s underperformance relative to the MSCI EAFE Index can be attributed to security selection, while allocation effects had a positive impact. Security selection in Consumer Discretionary, Information Technology and Financials detracted the most from the portfolio’s relative performance. Conversely, an overweight in Consumer Discretionary, a lack of exposure to Real Estate and security selection in Energy contributed to relative return.

Regionally, both security selection and allocation effects were responsible for the portfolio’s underperformance. Security selection in Europe and exposure to Emerging Markets detracted the most from relative performance, while an underweight and security selection in Asia contributed.

Contributors and Detractors for 1Q 2023

Relative ContributorsRelative Detractors
LVMHAIA Group
SonyTotalEnergies
SafranOtsuka Holdings
Rentokil InitialING Groep
Dassault SystèmesMagna International

AIA Group, a pan-Asian life insurance company headquartered in Hong Kong, was the largest detractor for the quarter. As a result of bank failures in both the U.S. and Europe, insurance companies were also scrutinized as potential vulnerabilities within the global financial system. However, given AIA’s strong capital position and ample liquidity, we believe the company is well positioned to withstand market volatility. In contrast to banks, life insurance companies like AIA have longer-duration liabilities than assets. This avoids liquidity pressure when interest rates rise and fixed-income portfolios are marked-to-market. We also see AIA’s investment exposure as limited due to its highly diversified corporate bond portfolio (with more than 1,900 issuers) and less than 5% of total invested assets in equities. As such, we remain focused on the company’s ability to benefit from its increasingly technology-enabled and productive agency salesforce. In fact, AIA’s VONB1 increased 6% in the second half of 2022, with growth across all of its largest markets. Moreover, we expect the company to further establish its direct presence in mainland China, a catalyst we previously identified, as it plans to reach another 10-12 affluent cities in the country by 2026.

1Value of New Business (VONB) is an insurance term for the present value of new business written during a period.

Magna International, a Canada-based global auto parts, systems and assembly company, was a leading detractor during the quarter. The company continues to be impacted by the volatile production schedules of auto OEMs, primarily caused by semiconductor supply constraints. For some of Magna’s major customers, volumes are as low as 50%-60% of the contracted plan. This has created short-term inefficiencies in Magna’s ability to manage labor and its overall cost structure. However, we believe these headwinds are temporary in nature, as supply chains and car production levels will normalize over time. We instead remain focused on Magna’s unique capability of supplying parts for an increasingly electrified and autonomous fleet of vehicles. This includes Magna’s specialty in lightweighting vehicles—a necessity for heavy electric cars—as well as its years of investment in self-driving technologies. In addition, Magna signed an agreement in December 2022 to acquire Veoneer Active Safety for approximately $1.5 billion in cash. Veoneer’s advanced driver-assistance system (ADAS) technologies and Magna’s existing ADAS group, in our view, will benefit from enhanced scale and a larger product portfolio, ultimately allowing the company to reach a broader customer base.

LVMH Moët Hennessy Louis Vuitton, the luxury goods company, was the primary contributor for the quarter. China, one of the world’s largest luxury goods markets, has reopened following three years of various COVID lockdown policies and provided a boost for LVMH. While we are pleased to see the company (and industry) benefit from an improved macroeconomic environment, this is not, and was not, our focus when analyzing the fundamentals of LVMH’s business. Instead of attempting to time short-term factors out of the company’s control, we remain fixated on what LVMH can control. This includes the company’s progress on initiatives such as integrating the acquisitions of Tiffany & Co. and, most recently, the Pedemonte Group to bolster its Jewelry division; market share gains within the Fashion & Leather Goods segment; continued market leadership with the likes of Dior’s Sauvage being named the world leader in perfumes for 2022; and the expansion of the company’s store network and the development of production facilities. These improvements, we believe, more directly impact the company’s long-term fundamental outlook, regardless of the short-term macroeconomic landscape. Lastly, LVMH appointed Pharrell Williams as its new Men’s Creative Director, filling the role following the tragic passing of Virgil Abloh in 2021.

Rentokil Initial, the U.K.-based pest control and hygiene services company, was a leading contributor for the quarter. In late 2022, the company completed its previously announced $6.7 billion acquisition of Terminix to further solidify its position in the North American pest control market. We believed the acquisition, its largest ever, would provide operational synergies from scale efficiencies and in-market densification, as well as accelerate the consolidation of the U.S. pest control market. Initially, Rentokil estimated $150 million in cost synergies by 2025, and the company recently upgraded its target to at least $200 million. We are encouraged by the company’s integration progress and operations, which in turn have led to Rentokil’s highest operating margin in 20 years. We believe the fundamental improvements, combined with the resilient nature of the pest control business, will allow Rentokil to continue to unlock value in the years ahead.

Recent Portfolio Activity

BuysSells
NoneBrookfield Asset Management

During the quarter, we sold our position in Brookfield Asset Management.

We have been owners of Brookfield since the strategy’s inception. In December 2022, the company completed the spinoff of 25% of its asset management business, now known as Brookfield Asset Management (“Manager,” ticker: BAM). As part of the spinoff, the parent company, Brookfield Corporation (“Corporation,” ticker: BN), retained a 75% interest in the Manager. As such, we decided to sell our stake in the Manager and use the proceeds to top-up our investment in the Corporation. While we continue to find the Manager’s business attractive, we view Brookfield Corporation as a more optimal investment.

Conclusion

A core tenet of our investment philosophy is the commitment to understand businesses with a long-term perspective. For us, this is especially important during times of heightened uncertainty when macroeconomic events dominate headlines. We remain aware of short-term topics such as inflation, monetary policy and the recent shock to the banking system. However, we believe a competitive advantage of our investment process lies in the fact that, instead of reacting and repositioning our portfolio based on unknowns and unfolding events, our focus remains on business fundamentals. Fundamentals, we are convinced, are what dictate shareholder value in the long term. As such, we continue to attentively study what we believe are high-quality companies with sustainable competitive advantages poised to outperform their peers over full market cycles.

Disclosures

The opinions expressed herein are those of Aristotle Capital Management, LLC (Aristotle Capital) and are subject to change without notice. Past performance is not a guarantee or indicator of future results. This material is not financial advice or an offer to buy or sell any product. You should not assume that any of the securities transactions, sectors or holdings discussed in this report were or will be profitable, or that recommendations Aristotle Capital makes in the future will be profitable or equal the performance of the securities listed in this report. The portfolio characteristics shown relate to the Aristotle International Equity ADR strategy. Not every client’s account will have these characteristics. Aristotle Capital reserves the right to modify its current investment strategies and techniques based on changing market dynamics or client needs. There is no assurance that any securities discussed herein will remain in an account’s portfolio at the time you receive this report or that securities sold have not been repurchased. The securities discussed may not represent an account’s entire portfolio and, in the aggregate, may represent only a small percentage of an account’s portfolio holdings. The performance attribution presented is of a representative account from Aristotle Capital’s International Equity ADR Composite. The representative account is a discretionary client account which was chosen to most closely reflect the investment style of the strategy. The criteria used for representative account selection is based on the account’s period of time under management and its similarity of holdings in relation to the strategy. Recommendations made in the last 12 months are available upon request.

Returns are presented gross and net of investment advisory fees and include the reinvestment of all income. Gross returns will be reduced by fees and other expenses that may be incurred in the management of the account. Net returns are presented net of actual investment advisory fees and after the deduction of all trading expenses.

All investments carry a certain degree of risk, including the possible loss of principal. Investments are also subject to political, market, currency and regulatory risks or economic developments. International investments involve special risks that may in particular cause a loss in principal, including currency fluctuation, lower liquidity, different accounting methods and economic and political systems, and higher transaction costs. These risks typically are greater in emerging markets. Securities of small‐ and medium‐sized companies tend to have a shorter history of operations, be more volatile and less liquid. Value stocks can perform differently from the market as a whole and other types of stocks.

The material is provided for informational and/or educational purposes only and is not intended to be and should not be construed as investment, legal or tax advice and/or a legal opinion. Investors should consult their financial and tax adviser before making investments. The opinions referenced are as of the date of publication, may be modified due to changes in the market or economic conditions, and may not necessarily come to pass. Information and data presented has been developed internally and/or obtained from sources believed to be reliable. Aristotle Capital does not guarantee the accuracy, adequacy or completeness of such information.

Aristotle Capital Management, LLC is an independent registered investment adviser under the Advisers Act of 1940, as amended. Registration does not imply a certain level of skill or training. More information about Aristotle Capital, including our investment strategies, fees and objectives, can be found in our Form ADV Part 2, which is available upon request. ACM-2304-133

Performance Disclosures

Composite returns for all periods ended March 31, 2023 are preliminary pending final account reconciliation.

Past performance is not indicative of future results. The information provided should not be considered financial advice or a recommendation to purchase or sell any particular security or product.  Performance results for periods greater than one year have been annualized.

Returns are presented gross and net of investment advisory fees and include the reinvestment of all income. Gross returns will be reduced by fees and other expenses that may be incurred in the management of the account. Net returns are presented net of actual investment advisory fees and after the deduction of all trading expenses.

Index Disclosures

The MSCI EAFE Index (Europe, Australasia, Far East) is a free float-adjusted market capitalization-weighted index that is designed to measure the equity market performance of developed markets, excluding the United States and Canada. The MSCI EAFE Index consists of the following 21 developed market country indices: Australia, Austria, Belgium, Denmark, Finland, France, Germany, Hong Kong, Ireland, Israel, Italy, Japan, the Netherlands, New Zealand, Norway, Portugal, Singapore, Spain, Sweden, Switzerland and the United Kingdom. The MSCI ACWI captures large and mid-cap representation across 23 developed market countries and 24 emerging markets countries. With approximately 3,000 constituents, the Index covers approximately 85% of the global investable equity opportunity set. The MSCI ACWI Growth Index captures large and mid-cap securities exhibiting overall growth style characteristics across 23 developed markets countries and 24 emerging markets countries. The MSCI ACWI Value Index captures large and mid-cap securities exhibiting overall value style characteristics across 23 developed markets countries and 24 emerging markets countries. The MSCI ACWI ex USA Index captures large and mid-cap representation across 22 of 23 developed markets countries (excluding the United States) and 24 emerging markets countries. With approximately 2,300 constituents, the Index covers approximately 85% of the global equity opportunity set outside the United States. The MSCI Emerging Markets Index is a free float-adjusted market capitalization-weighted index that is designed to measure the equity market performance of emerging markets. The MSCI Emerging Markets Index consists of the following 24 emerging market country indexes: Brazil, Chile, China, Colombia, Czech Republic, Egypt, Greece, Hungary, India, Indonesia, Korea, Kuwait, Malaysia, Mexico, Peru, Philippines, Poland, Qatar, Saudi Arabia, South Africa, Taiwan, Thailand, Turkey and United Arab Emirates. The S&P 500® Index is the Standard & Poor’s Composite Index of 500 stocks and is a widely recognized, unmanaged index of common stock prices. The Brent Crude Oil Index is a major trading classification of sweet light crude oil that serves as a major benchmark price for purchases of oil worldwide. The MSCI Japan Index is designed to measure the performance of the large and mid-cap segments of the Japanese market. With approximately 250 constituents, the Index covers approximately 85% of the free float-adjusted market capitalization in Japan. The Bloomberg Global Aggregate Bond Index is a flagship measure of global investment grade debt from 28 local currency markets. This multi-currency benchmark includes treasury, government-related, corporate and securitized fixed-rate bonds from both developed and emerging markets issuers. The MSCI United Kingdom Index is designed to measure the performance of the large and mid-cap segments of the U.K. market. With nearly 100 constituents, the Index covers approximately 85% of the free float-adjusted market capitalization in the United Kingdom. The MSCI Europe Index captures large and mid-cap representation across 15 developed markets countries in Europe. With approximately 430 constituents, the Index covers approximately 85% of the free float-adjusted market capitalization across the European developed markets equity universe. These indices have been selected as the benchmarks and are used for comparison purposes only. The volatility (beta) of the Composite may be greater or less than the respective benchmarks. It is not possible to invest directly in these indices.

For more on International Equity, access the latest resources.

Rebrands acquired firm to Aristotle Pacific Capital, LLC

Reorganizes Certain Pacific Funds into new Aristotle Funds

LOS ANGELES, CA and NEWPORT BEACH, CA – APRIL 17, 2023 – Aristotle Capital Management, LLC (“Aristotle”) today announced it has completed the acquisition of Pacific Asset Management LLC, a leader in liquid credit investments, from Pacific Life Insurance Company (“Pacific Life”). Pacific Asset Management has officially been rebranded to Aristotle Pacific Capital, LLC (“Aristotle Pacific”) and currently manages over $20 billion in assets.

Aristotle Pacific will maintain its investment team and will continue to be led by Dominic Nolan, CFA, Chief Executive Officer, ensuring continuity of investment management expertise and nurturing the trusted connections they have built servicing their clients.

In addition, Aristotle further announces the reorganization of certain funds of Pacific Funds, Pacific Life’s publicly offered mutual fund complex, into new Aristotle Funds, following approval by shareholders of such certain Pacific Funds.  A newly formed Aristotle affiliate, Aristotle Investment Services, LLC, will serve as the Advisor and Administrator to the new Aristotle Funds.