(All MSCI index returns are shown net and in U.S. dollars unless otherwise noted.)
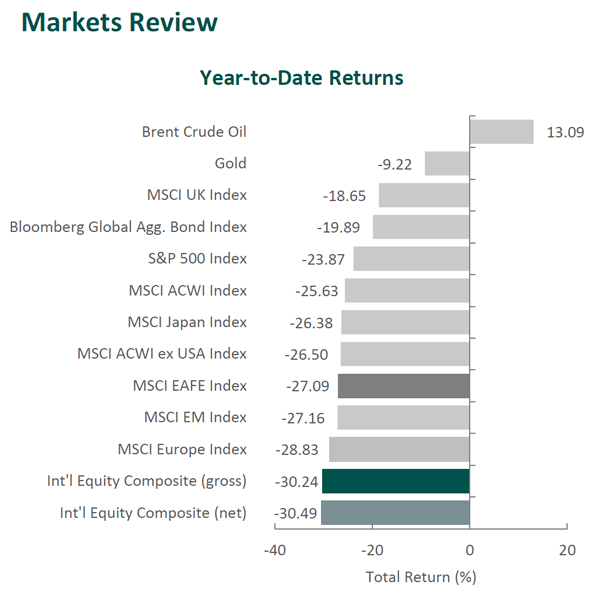
Markets Review
Sources: SS&C Advent, Bloomberg
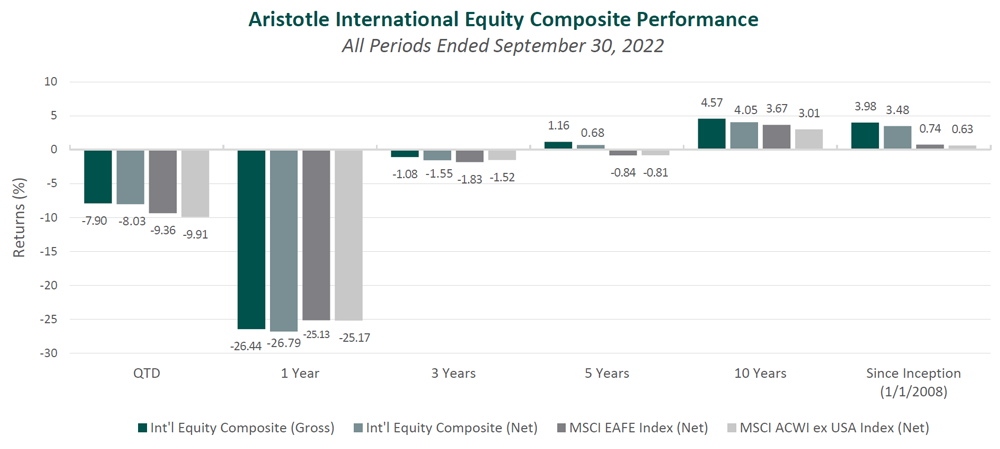
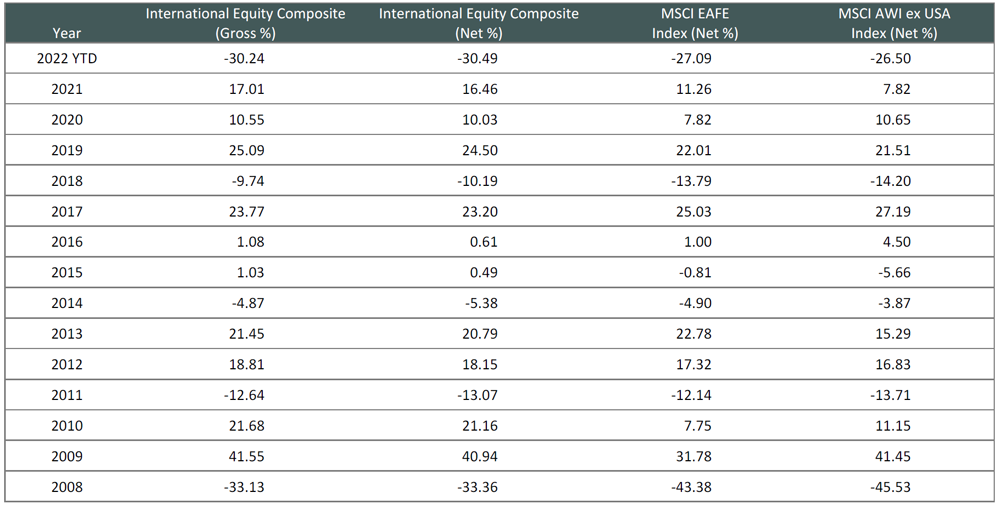
Past performance is not indicative of future results. Aristotle International Equity Composite returns are presented gross and net of investment advisory fees and include the reinvestment of all income. Gross returns will be reduced by fees and other expenses that may be incurred in the management of the account. Net returns are presented net of actual investment advisory fees and after the deduction of all trading expenses. Aristotle Capital Composite returns are preliminary pending final account reconciliation. Please see important disclosures at the end of this document.
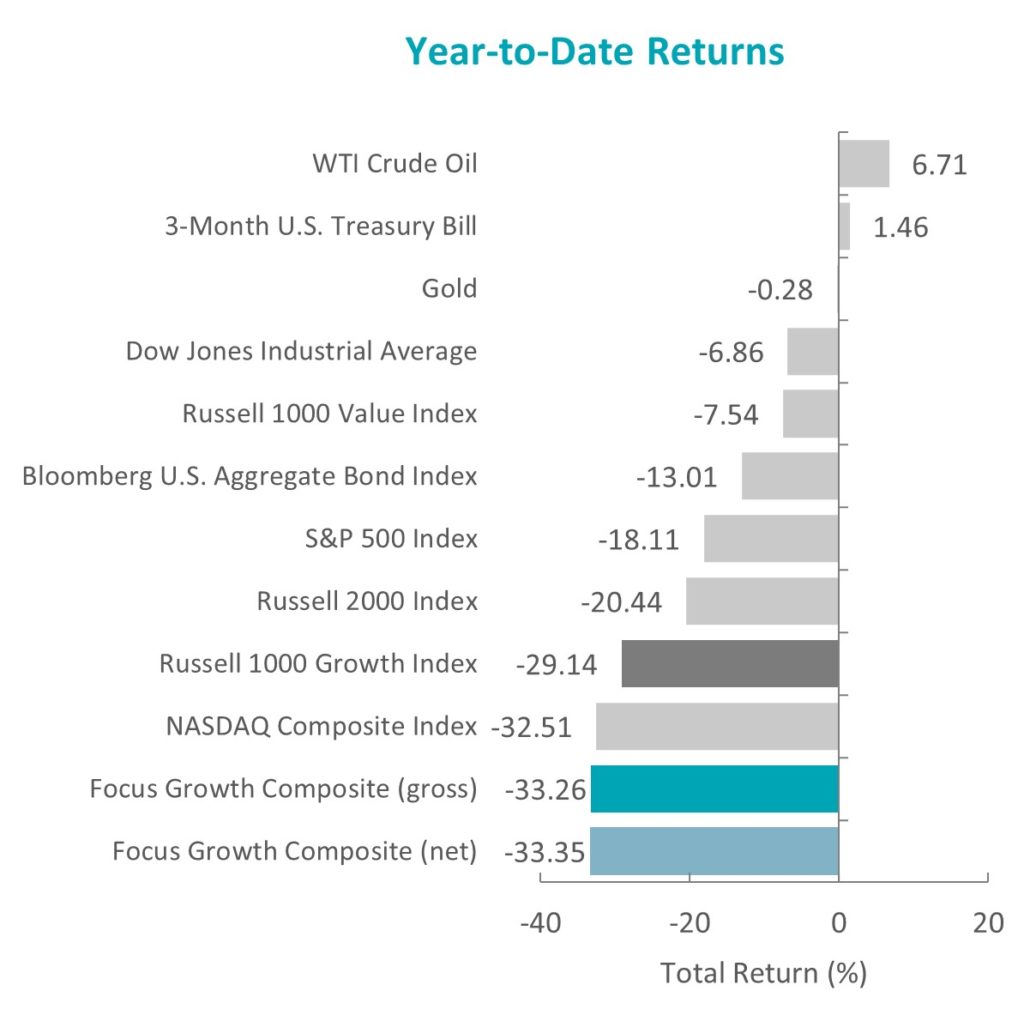
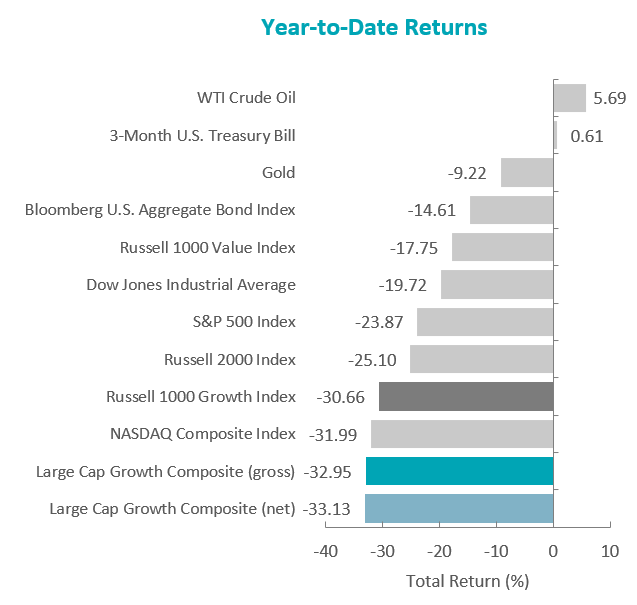
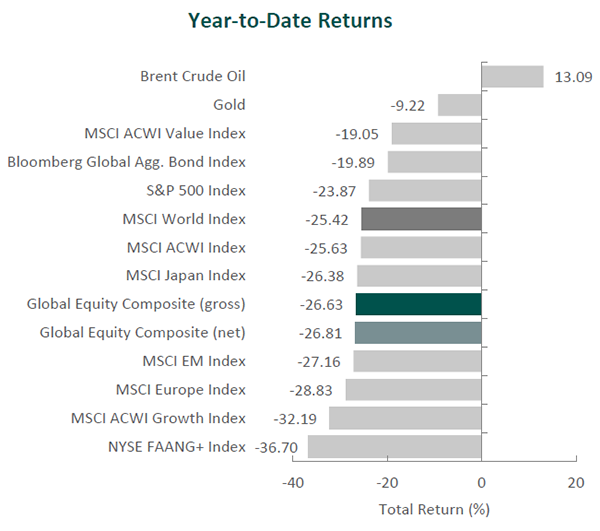
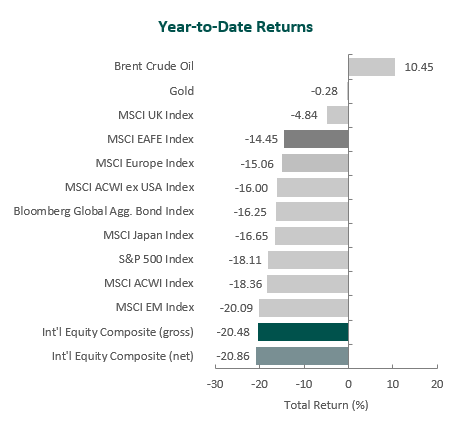
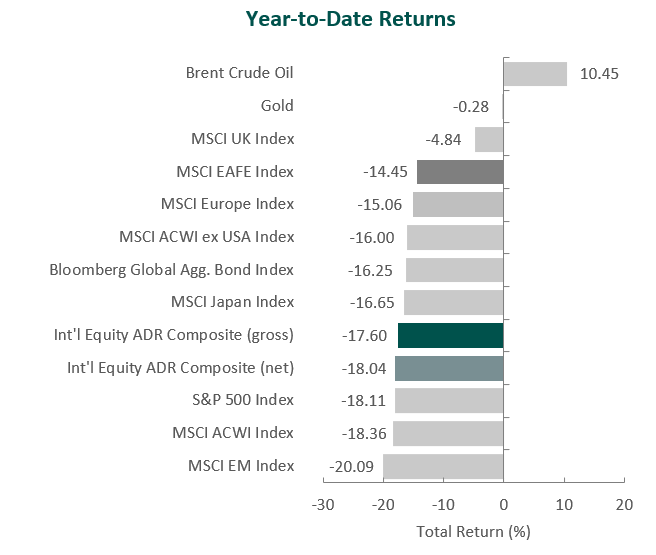
Global equity markets rebounded in the fourth quarter. Overall, the MSCI ACWI Index rose 9.76% during the period. Concurrently, the Bloomberg Global Aggregate Bond Index increased 4.55%. In terms of style, value stocks outperformed their growth counterparts during the quarter, with the MSCI ACWI Value Index beating the MSCI ACWI Growth Index by 8.93%.
The MSCI EAFE Index climbed by 17.34% during the fourth quarter, while the MSCI ACWI ex USA Index increased 14.28%. Within the MSCI EAFE Index, Europe & Middle East and the U.K. were the strongest performers, while Asia, though posting a positive double-digit return, performed the worst. On a sector basis, all eleven sectors within the MSCI EAFE Index posted positive returns, with Financials, Materials and Energy generating the largest gains. Conversely, Communication Services, Consumer Staples and Real Estate gained the least.
As 2022 came to a close, the global economy continued to navigate various headwinds, such as persistent inflation, central bank policy actions, geopolitical uncertainty, the continued war in Ukraine and ongoing impacts from the pandemic. As a result, the IMF projects global growth to slow from 6.0% in 2021 to 3.2% and 2.7% in 2022 and 2023, respectively. Meanwhile, the IMF expects global inflation to rise to 8.8% in 2022 and then fall to 6.5% in 2023 and 4.1% in 2024 as both restrictive monetary policy and further resolution of supply-chain issues take effect. On the currency front, the U.S. Dollar Index (DXY) reversed, falling 7.87% after five consecutive quarters of appreciation.
Despite tighter monetary policy in most regions, global inflation remained at multidecade highs. This provided reason for many central banks to maintain a hawkish stance, including the U.S. Federal Reserve, which made two additional rate hikes during the quarter, raising its benchmark rate to a range of 4.25% to 4.50%. Likewise, the European Central Bank raised its benchmark lending rate to 2.50%, and the Bank of England increased its benchmark rate to 3.50%—the highest level in 14 years. However, all three of these central banks slowed the pace of rate increases in their latest hike in order to assess progress made against inflation given the corresponding lag in economic effects. Additionally, the Bank of Japan announced a surprising hawkish shift to its yield curve control policy, allowing the 10-year bond yield to move 0.50%, instead of the previously set 0.25%, on either side of its 0.00% target. While this decision from the world’s largest creditor signals the beginning of tightening financial conditions in Japan, the central bank’s yield target remains unchanged, and officials have indicated increased bond buying in the future. Meanwhile, the People’s Bank of China cut the reserve requirement ratio for banks by 25 basis points, adding around $70 billion of liquidity into the Chinese economy. The accomodative approach in China comes on the heels of reported record-high COVID cases, as the country finally began easing its zero-COVID policy by shortening quarantine periods, relaxing contact tracing and lifting travel requirements. In Europe, U.K. instability continued as Prime Minister Truss’s controversial proposal for unfunded tax cuts—a stimulative approach to fiscal policy during a time of rampant inflation—sparked significant sell-offs in both gilts and sterling, which heightened market volatility. This led to Prime Minister Truss’s resignation after just 44 days in office, making her the shortest-serving prime minister in British history. She was replaced by Prime Minister Rishi Sunak, who has pledged to reverse many of Truss’s plans that caused turmoil in the U.K.
Lastly, on the geopolitical front, Russia withdrew its forces from Kherson, a significant strategic region forming a land bridge from Russia to Crimea. In addition to the success of Ukranian troops, the G7 formally set a price cap on Russian oil at $60 per barrel. This measure is expected to limit Russia’s ability to continue to finance its war in Ukraine.
Annual Markets Review
Global equity markets faltered in 2022, as the MSCI ACWI finished lower for the first three quarters of the year, leading to a full-year return of -18.36%. Additionally, the MSCI ACWI Value Index outperformed the MSCI ACWI Growth Index for the year by 21.06%, value’s second consecutive year of outperformance and the largest since 2000.
Meanwhile, despite fixed income’s tendency to provide stability when equities are turbulent, the Bloomberg Global Aggregate Bond Index fell 16.25%, as inflation and the corresponding interest rate environment remained primary themes. In addition, supply-chain disruptions, soaring commodity prices and COVID restrictions—particularly in China—persisted, while new factors such as geopolitical conflict came to the forefront of market attention. On the currency front, the U.S. dollar strengthened against global currencies during the year, rising approximately 7.87%, as measured by the DXY. This caused the euro to break parity with the dollar in July, the British pound to touch its lowest point in over 200 years against the dollar and the Japanese yen to hit a low not seen since 1990.
Although it was a challenging year for investors, these volatile periods are precisely why we emphasize the phrase, “not every quarter, not every year.” Short-term returns are always subject to change, and macroeconomic factors are impossible to predict. As such, we remain focused on the long-term fundamentals of businesses, and we strive to identify undervalued, high-quality companies that can weather the complex and changing market dynamics. We believe this steadfast approach will allow us to provide lasting long-term value to our clients.
Performance and Attribution Summary
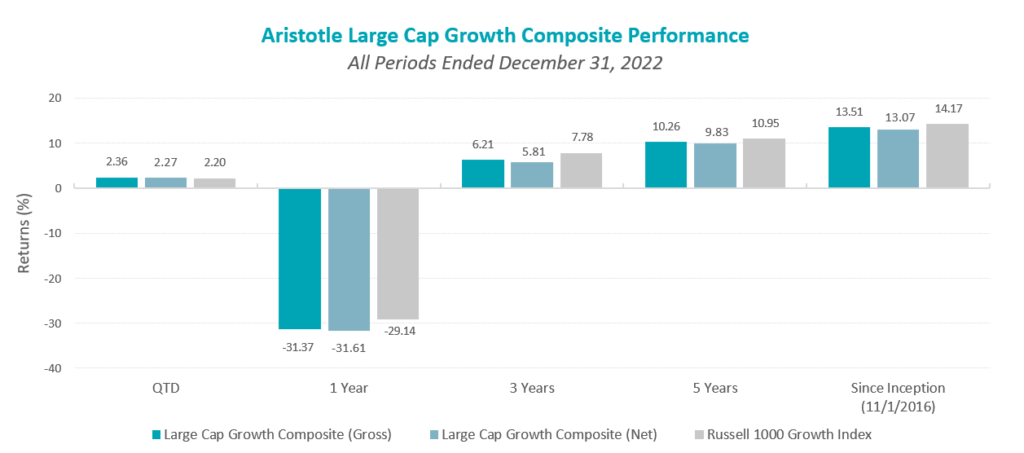
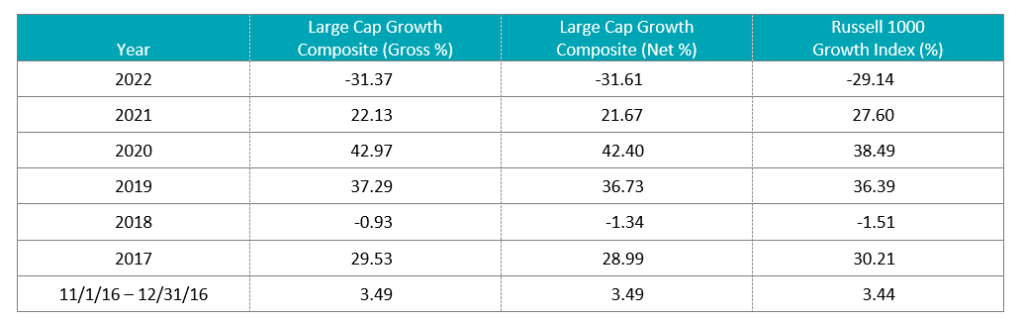
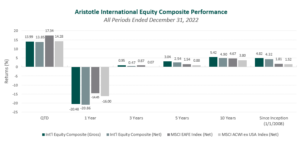
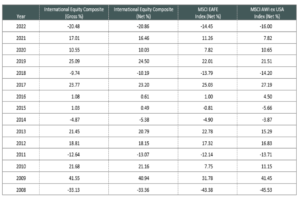
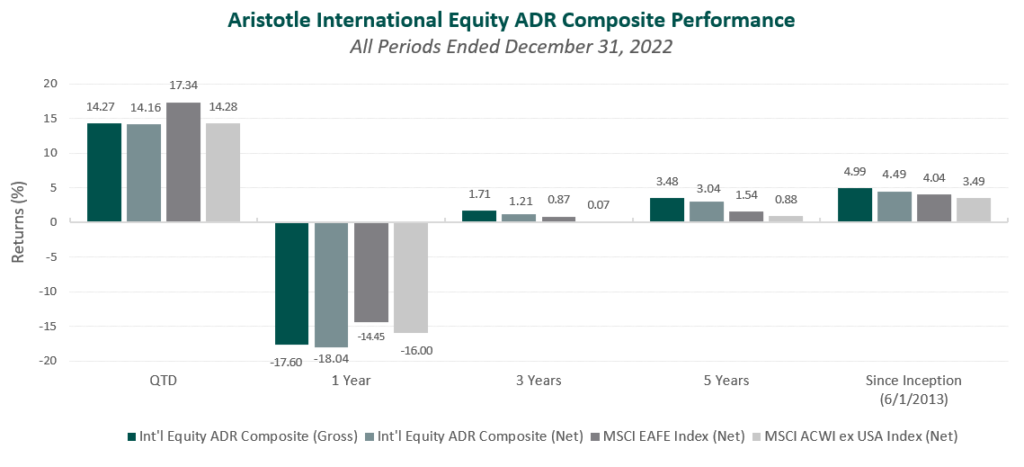
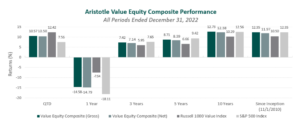
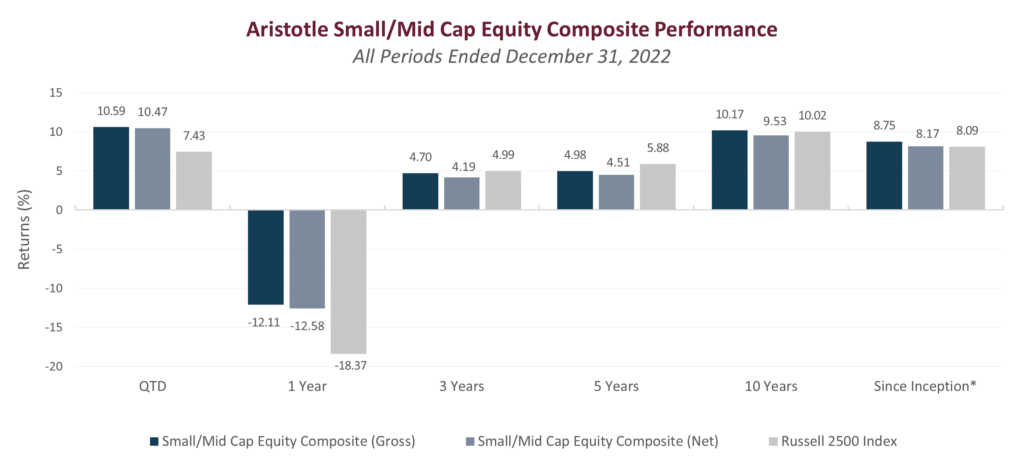
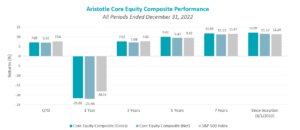
For the fourth quarter of 2022, Aristotle Capital’s International Equity Composite posted a total return of 13.99% gross of fees (13.85% net of fees), underperforming the MSCI EAFE Index, which returned 17.34%, and the MSCI ACWI ex USA Index, which returned 14.28%. Please refer to the table below for detailed performance.
| Performance (%) | 4Q22 | 1 Year | 3 Years | 5 Years | 10 Years | Since Inception* |
|---|---|---|---|---|---|---|
| International Equity Composite (gross) | 13.99 | -20.48 | 0.95 | 3.04 | 5.42 | 4.82 |
| International Equity Composite (net) | 13.85 | -20.86 | 0.47 | 2.54 | 4.90 | 4.32 |
| MSCI EAFE Index (net) | 17.34 | -14.45 | 0.87 | 1.54 | 4.67 | 1.81 |
| MSCI ACWI ex USA Index (net) | 14.28 | -16.00 | 0.07 | 0.88 | 3.80 | 1.52 |
Source: FactSet
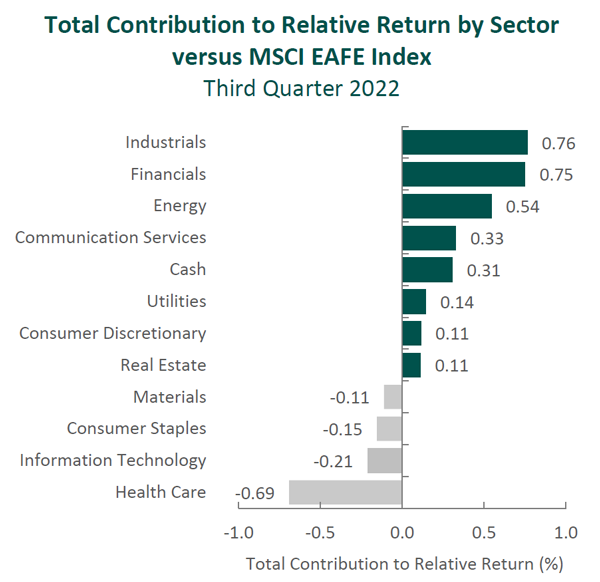
Past performance is not indicative of future results. Attribution results are based on sector returns which are gross of investment advisory fees. Attribution is based on performance that is gross of investment advisory fees and includes the reinvestment of income.
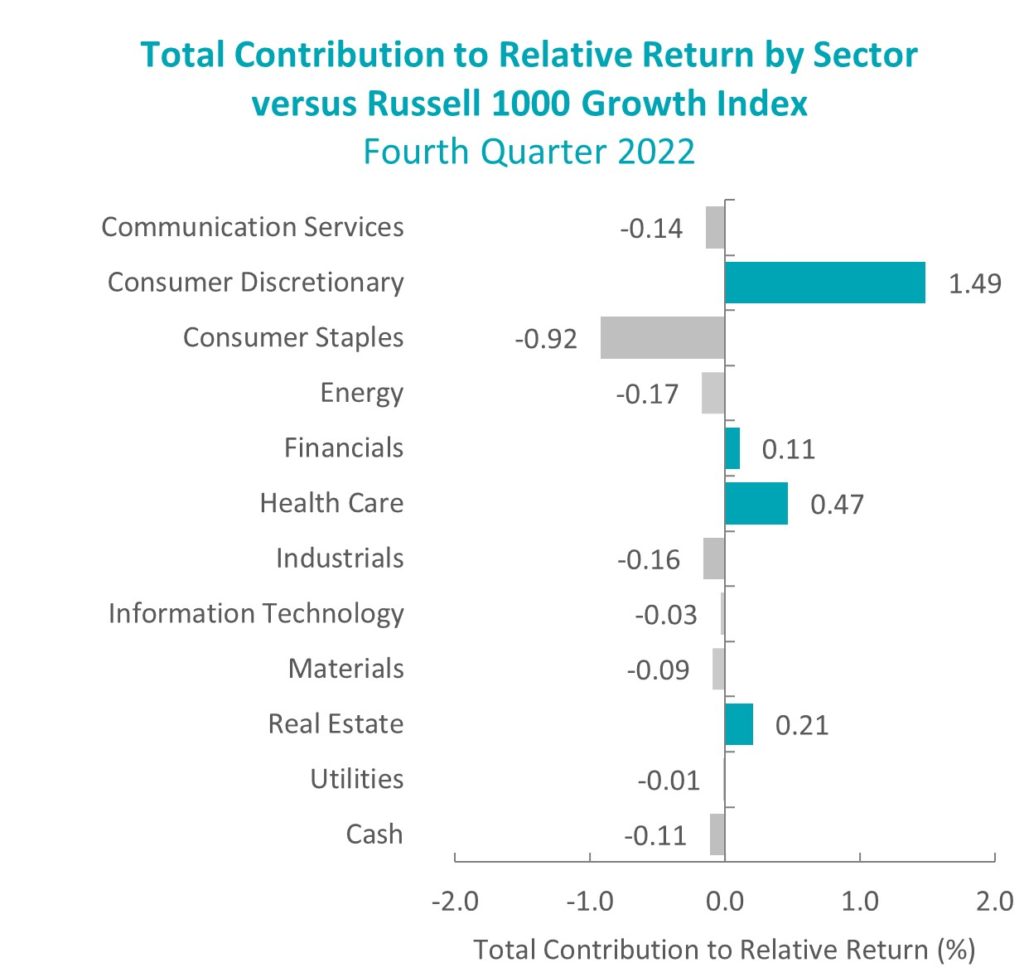
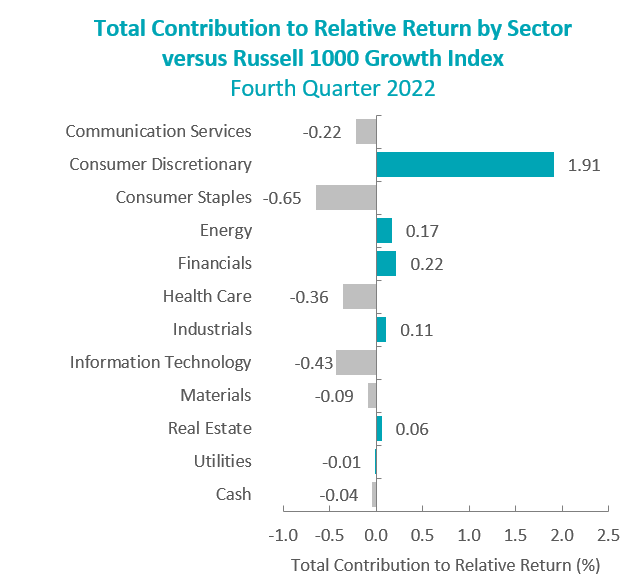
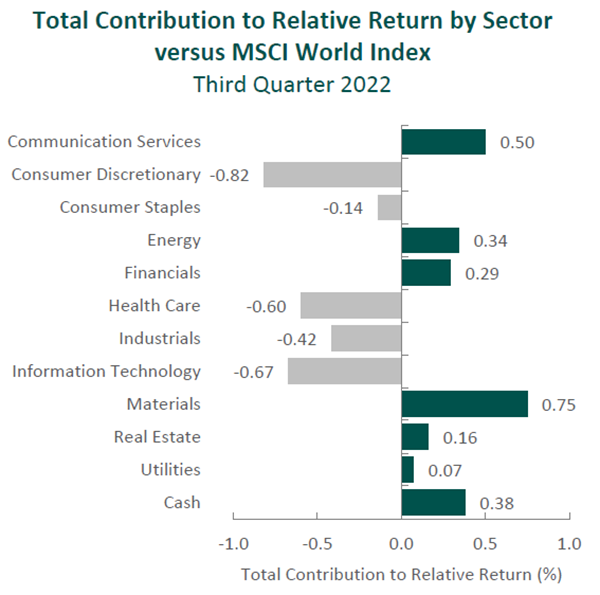
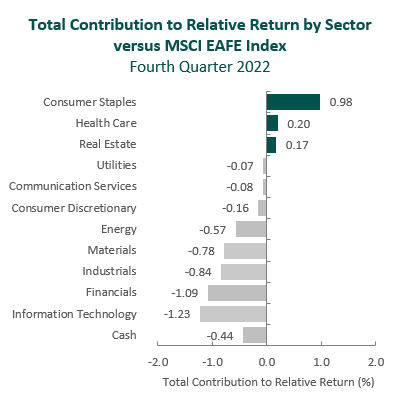
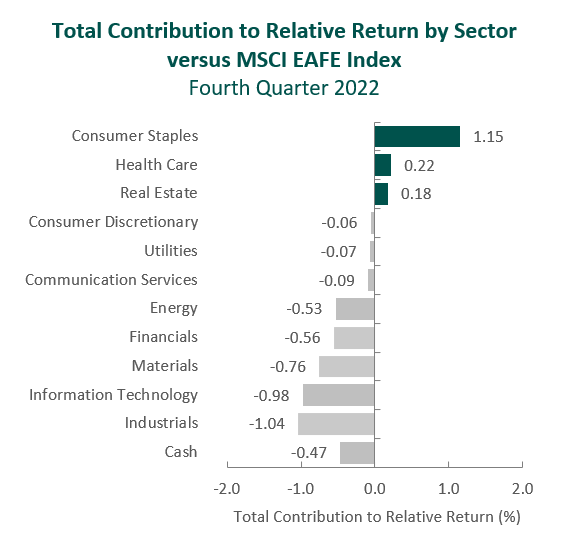
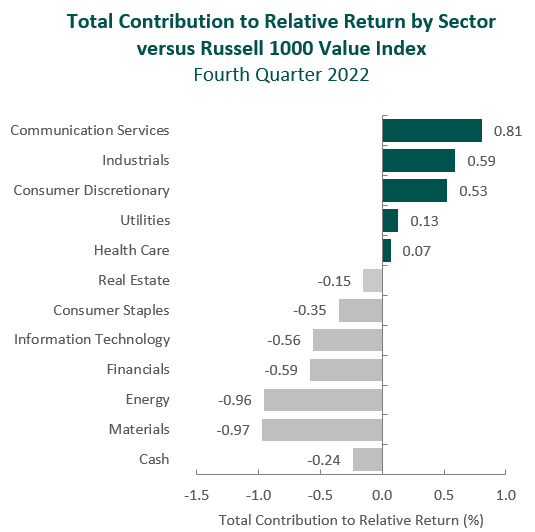
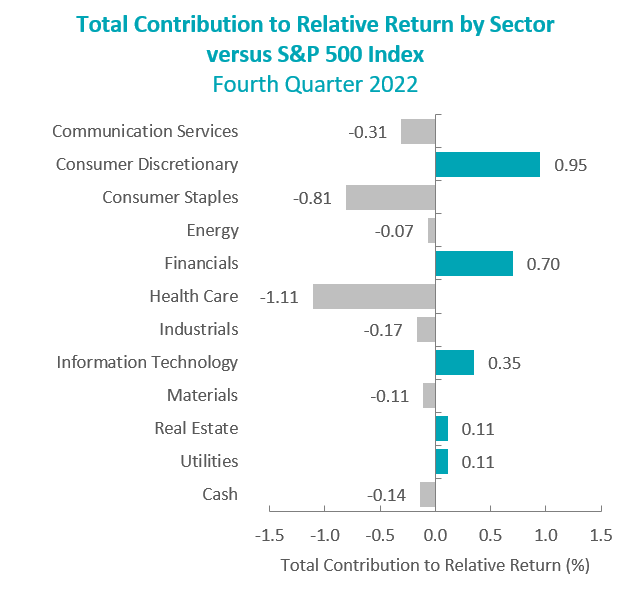
From a sector perspective in the fourth quarter, the portfolio’s underperformance relative to the MSCI EAFE Index can be attributed to security selection, while allocation effects had a slightly positive impact. Security selection in Financials, Information Technology and Industrials detracted the most from the portfolio’s relative performance. Conversely, security selection in Consumer Staples, a lack of exposure to Real Estate and an underweight in Health Care contributed to relative return.
Regionally, both security selection and allocation effects were responsible for the portfolio’s underperformance. Exposure to Canada and security selection in Asia detracted the most from relative performance, while security selection in the U.K. and an underweight in Asia contributed.
Contributors and Detractors for 4Q 2022
| Relative Contributors | Relative Detractors |
|---|---|
| Munich Reinsurance | Cameco |
| Erste Group Bank | Brookfield |
| Coca-Cola Europacific Partners | Accenture |
| Safran | Dassault Systèmes |
| TotalEnergies | Nidec |
Cameco, the world’s largest publicly traded uranium producer, was the largest detractor for the quarter. The company announced a strategic partnership with Brookfield Renewable to acquire Westinghouse Electric Company, one of the world’s largest nuclear services businesses, for a total enterprise value of $7.87 billion. Cameco’s 49% interest in Westinghouse will be funded with cash, equity issuance and debt. While the announcement and resulting equity issuance came as a surprise, our initial impression is positive. Industry consolidation and management’s prior prudence (i.e., net cash balance sheet and shutting production in tough times), we believe, uniquely positioned Cameco to pursue this strategic transaction. We recognize the deal increases Cameco’s financial leverage; however, we believe Westinghouse’s market-leading downstream capabilities will align well with Cameco’s production and fuel services to offer a highly competitive nuclear fuel solution. In addition to the acquisition, the company announced the production of the first packaged pounds of uranium since restarting McArthur River mine and Key Lake mill. Moreover, Cameco signed a uranium supply agreement with China Nuclear International Corporation, a subsidiary of one of the country’s largest nuclear power operators, China National Nuclear Corporation. We believe these events highlight Cameco’s continued market leadership and opportunistic mindset in a fast-changing energy landscape.
Brookfield, one of the world’s largest and most diversified private market investors, was one of the biggest detractors. In December, the company completed the previously announced spinoff of 25% of its asset management business. The asset management business is now known as Brookfield Asset Management (“Manager,” ticker: BAM), and the parent company is now known as Brookfield Corporation (“Corporation,” ticker: BN). Shareholders received one share of the Manager for every four shares owned of the Corporation, and the Corporation retained a 75% interest in the Manager. While the transaction has limited economic impact, the spinoff creates additional transparency, as well as a listed entity for shareholders to invest in the pure-play asset management business. We continue to hold our investment in both the Corporation and Manager.
Munich Re, the world’s largest reinsurance company, was the leading contributor for the quarter. Despite the negative impacts of Hurricane Ian—the deadliest hurricane to strike the state of Florida since 1935—and volatility in capital markets, Munich Re continued to experience strong fundamental developments to its overall business. Specifically, the company saw significant improvements in profitability in business units such as Life and Health Reinsurance and strong premium growth across all of its business units as it continues to win market share, leverage its global scale and demonstrate underwriting discipline. The company also announced the formation of its new Global Specialty Insurance (GSI) division, which will be comprised of various primary insurance businesses that are currently classified within the reinsurance segment. Management believes this restructuring will allow them to efficiently support the various business lines while driving further expansion in the specialty primary insurance space. Additionally, Munich Re remains committed to investing in technology that improves efficiency across its value chain, exemplified by its acquisition of apinity GmbH, an application programming interface (API) solutions provider. In the long run, we believe the company is well positioned to continue to win market share and improve profitability.
Safran, the French aerospace propulsion and equipment manufacturer, was a top contributor. As the leading supplier of narrow-body aircraft engines (approximately 70% market share), Safran has benefited as flight activities have increased and the aging fleet of aircraft has spurred demand for needed service. Part of our attraction to Safran is the nature of its product categories, which tend to exhibit both pricing power and a lengthy after-market business—the growth of which we identified as a catalyst. As such, during the quarter, the company made additional progress by signing a number of long-term service agreements, including a contract to support U.S. Army helicopters, as well as landing gear for Philippine Airlines. In addition, deliveries of the company’s latest-generation LEAP engines increased 54% from the second to third quarter of the year. Longer term, we believe Safran will benefit from the continued transition to LEAP engines as airlines upgrade their fleets to be more efficient and environmentally friendly.
Recent Portfolio Activity
| Buys | Sells |
|---|---|
| Koninklijke DSM | Carnival |
| Marui Group |
During the quarter, we sold our positions in Carnival and Marui Group and invested in Koninklijke DSM.
We first invested in Carnival, the world’s largest cruise line, during the second quarter of 2019. At the time, we believed the company was improving in quality, as the industry (and shipyards) had consolidated to a point where returns on capital could increase systematically over time. In addition, cruising is underpenetrated when compared to land-based alternatives. While, in our opinion, consumers’ appetite for cruising remains high—with cumulative advanced bookings at the upper end of historical ranges—the unprecedented operating environment during the pandemic required Carnival to add significant operating debt. As a result, we decided to exit our investment in Carnival to purchase shares of Koninklijke DSM, a business we view as more optimal.
We first invested in Japan-based Marui Group in the first quarter of 2016. At the time, we viewed the company as a credit card company disguised as a retailer. Over the years, Marui executed on two key catalysts. On the retail front, the company transitioned from a consignment-based model to a rental revenue-based business model, which improved profitability. Meanwhile, Marui’s credit card business continued to expand and shifted the group’s business mix from Retailing to the higher-margin FinTech segment, which is now ~95% of operating income. The shift was recognized by investors and index providers, with Marui moving from the Consumer Discretionary sector to the Financials sector. We decided to exit our investment during the fourth quarter as catalysts have largely played out and we view Koninklijke DSM as a more optimal investment.
Koninklijke DSM N.V.
Founded in 1902, Koninklijke (“royal” in Dutch) DSM (DSM) is a Dutch multinational corporation. Originally a mining company (DSM stands for Dutch State Mines), DSM is now a leading science-based company in the fields of health, nutrition and bioscience. The company has more than 20,000 employees (including ~1,500 scientists in 35 research laboratories) across over 40 countries. DSM produces pure active ingredients (e.g., vitamins, lipids, minerals, enzymes and UV filters) that go into a wide range of products, including food, drinks, medical nutrition, cosmetics, and pet and animal products.
Over the past two decades, DSM has gone through a dramatic transformation, divesting nearly all of its cyclical, commodity chemicals businesses and investing the proceeds in specialty nutrition product companies with more stable sales and higher profit margins. The pending merger with Firmenich (expected to close in the first half of 2023), a global flavors and fragrances ingredients company, completes DSM’s transition to a pure-play nutrition, health and ingredients company. The combined businesses will have more than €11 billion in annual revenue across four segments: Animal Nutrition & Health (29% of sales), Perfumery & Beauty (28%), Food & Beverage (24%) and Health, Nutrition & Care (19%).
High-Quality Business
Some of the quality characteristics we have identified for DSM include:
• Leading market share positions in numerous categories, including vitamins and premix (particularly in the Animal Nutrition & Health and Food & Beverage segments);
• Many markets DSM participates in are consolidated and enjoy stable margins due to high barriers to entry; and
• Scale and global footprint results in close relationships with customers (e.g., “Global Products, Local Solutions” strategy).
Attractive Valuation
Valuation is attractive based on our estimates for higher normalized cash earnings power. Moreover, we believe the current valuation reflects DSM’s historical status as a commodity conglomerate and does not fully appreciate the improvement in quality that can be created following the merger with Firmenich. We recognize the Firmenich transaction is the largest in DSM’s history and brings considerable integration risks; however, we believe current valuation provides a margin of safety for the long-term investor.
Compelling Catalysts
Catalysts we have identified for DSM, which we believe will cause its stock price to appreciate over our three- to five-year investment horizon, include:
• Successful integration of Firmenich merger, as well as previous bolt-on acquisitions, can produce revenue and expense synergies, along with an improved business mix;
• Continued market share gains from recently launched product innovations (e.g., Bovaer, an animal health nutritional product that reduces methane emissions); and
• Balance sheet optionality as low leverage allows for increased return of capital to shareholders while simultaneously continuing bolt-on acquisitions.
Conclusion
2022 proved a tumultuous year for most investors, with no shortage of macroeconomic and geopolitical events gripping the world’s attention and stirring volatility in markets. Global inflation reached multi-decade highs, central banks made drastic shifts in monetary policy, governments navigated instability and changes in leadership, and rising tensions between Eastern and Western nations came to a head with a ground war in Europe. This year serves as a staunch reminder that there is “always something” to consider in financial markets and economics. However, for us at Aristotle Capital, it is important to assess whether events are truly analyzable. In our opinion, macroeconomic factors and the market’s corresponding reactions are impossible to predict consistently. We will therefore, as we always have, stay focused on what we do best—the continuous study and better understanding of individual businesses. We remain convinced this “bottom-up” approach will allow us to best serve our clients, as fundamentals, not headline news, reflect long-term value.
Disclosures
The opinions expressed herein are those of Aristotle Capital Management, LLC (Aristotle Capital) and are subject to change without notice. Past performance is not a guarantee or indicator of future results. This material is not financial advice or an offer to buy or sell any product. You should not assume that any of the securities transactions, sectors or holdings discussed in this report were or will be profitable, or that recommendations Aristotle Capital makes in the future will be profitable or equal the performance of the securities listed in this report. The portfolio characteristics shown relate to the Aristotle International Equity strategy. Not every client’s account will have these characteristics. Aristotle Capital reserves the right to modify its current investment strategies and techniques based on changing market dynamics or client needs. There is no assurance that any securities discussed herein will remain in an account’s portfolio at the time you receive this report or that securities sold have not been repurchased. The securities discussed may not represent an account’s entire portfolio and, in the aggregate, may represent only a small percentage of an account’s portfolio holdings. The performance attribution presented is of a representative account from Aristotle Capital’s International Equity Composite. The representative account is a discretionary client account which was chosen to most closely reflect the investment style of the strategy. The criteria used for representative account selection is based on the account’s period of time under management and its similarity of holdings in relation to the strategy. Recommendations made in the last 12 months are available upon request.
Returns are presented gross and net of investment advisory fees and include the reinvestment of all income. Gross returns will be reduced by fees and other expenses that may be incurred in the management of the account. Net returns are presented net of actual investment advisory fees and after the deduction of all trading expenses.
All investments carry a certain degree of risk, including the possible loss of principal. Investments are also subject to political, market, currency and regulatory risks or economic developments. International investments involve special risks that may in particular cause a loss in principal, including currency fluctuation, lower liquidity, different accounting methods and economic and political systems, and higher transaction costs. These risks typically are greater in emerging markets. Securities of small‐ and medium‐sized companies tend to have a shorter history of operations, be more volatile and less liquid. Value stocks can perform differently from the market as a whole and other types of stocks.
The material is provided for informational and/or educational purposes only and is not intended to be and should not be construed as investment, legal or tax advice and/or a legal opinion. Investors should consult their financial and tax adviser before making investments. The opinions referenced are as of the date of publication, may be modified due to changes in the market or economic conditions, and may not necessarily come to pass. Information and data presented has been developed internally and/or obtained from sources believed to be reliable. Aristotle Capital does not guarantee the accuracy, adequacy or completeness of such information.
Aristotle Capital Management, LLC is an independent registered investment adviser under the Advisers Act of 1940, as amended. Registration does not imply a certain level of skill or training. More information about Aristotle Capital, including our investment strategies, fees and objectives, can be found in our ADV Part 2, which is available upon request.
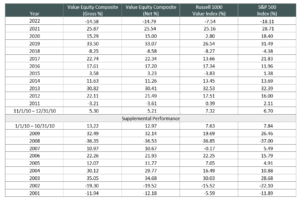
Composite returns for all periods ended December 31, 2022 are preliminary pending final account reconciliation.
Past performance is not indicative of future results. The information provided should not be considered financial advice or a recommendation to purchase or sell any particular security or product. Performance results for periods greater than one year have been annualized.
Returns are presented gross and net of investment advisory fees and include the reinvestment of all income. Gross returns will be reduced by fees and other expenses that may be incurred in the management of the account. Net returns are presented net of actual investment advisory fees and after the deduction of all trading expenses.
Aristotle Capital Management, LLC is an independent registered investment adviser under the Advisers Act of 1940, as amended. Registration does not imply a certain level of skill or training. More information about Aristotle Capital, including our investment strategies, fees and objectives, can be found in our Form ADV Part 2, which is available upon request. ACM-2301-13
The MSCI EAFE Index (Europe, Australasia, Far East) is a free float-adjusted market capitalization-weighted index that is designed to measure the equity market performance of developed markets, excluding the United States and Canada. The MSCI EAFE Index consists of the following 21 developed market country indices: Australia, Austria, Belgium, Denmark, Finland, France, Germany, Hong Kong, Ireland, Israel, Italy, Japan, the Netherlands, New Zealand, Norway, Portugal, Singapore, Spain, Sweden, Switzerland and the United Kingdom. The MSCI ACWI captures large and mid-cap representation across 23 developed market countries and 24 emerging markets countries. With approximately 3,000 constituents, the Index covers approximately 85% of the global investable equity opportunity set. The MSCI ACWI Growth Index captures large and mid-cap securities exhibiting overall growth style characteristics across 23 developed markets countries and 24 emerging markets countries. The MSCI ACWI Value Index captures large and mid-cap securities exhibiting overall value style characteristics across 23 developed markets countries and 24 emerging markets countries. The MSCI ACWI ex USA Index captures large and mid-cap representation across 22 of 23 developed markets countries (excluding the United States) and 24 emerging markets countries. With approximately 2,300 constituents, the Index covers approximately 85% of the global equity opportunity set outside the United States. The MSCI Emerging Markets Index is a free float-adjusted market capitalization-weighted index that is designed to measure the equity market performance of emerging markets. The MSCI Emerging Markets Index consists of the following 24 emerging market country indexes: Brazil, Chile, China, Colombia, Czech Republic, Egypt, Greece, Hungary, India, Indonesia, Korea, Kuwait, Malaysia, Mexico, Peru, Philippines, Poland, Qatar, Saudi Arabia, South Africa, Taiwan, Thailand, Turkey and United Arab Emirates. The S&P 500® Index is the Standard & Poor’s Composite Index of 500 stocks and is a widely recognized, unmanaged index of common stock prices. The Brent Crude Oil Index is a major trading classification of sweet light crude oil that serves as a major benchmark price for purchases of oil worldwide. The U.S. Dollar Index (DXY) is a measure of the value of the U.S. dollar relative to the value of a basket of currencies of the majority of the United States’ most significant trading partners. The MSCI Japan Index is designed to measure the performance of the large and mid-cap segments of the Japanese market. With approximately 250 constituents, the Index covers approximately 85% of the free float-adjusted market capitalization in Japan. The Bloomberg Global Aggregate Bond Index is a flagship measure of global investment grade debt from 28 local currency markets. This multi-currency benchmark includes treasury, government-related, corporate and securitized fixed-rate bonds from both developed and emerging markets issuers. The MSCI United Kingdom Index is designed to measure the performance of the large and mid-cap segments of the U.K. market. With nearly 100 constituents, the Index covers approximately 85% of the free float-adjusted market capitalization in the United Kingdom. The MSCI Europe Index captures large and mid-cap representation across 15 developed markets countries in Europe. With approximately 430 constituents, the Index covers approximately 85% of the free float-adjusted market capitalization across the European developed markets equity universe. These indices have been selected as the benchmarks and are used for comparison purposes only. The volatility (beta) of the Composite may be greater or less than the respective benchmarks. It is not possible to invest directly in these indices.

 Composite returns for all periods ended December 31, 2022 are preliminary pending final account reconciliation.
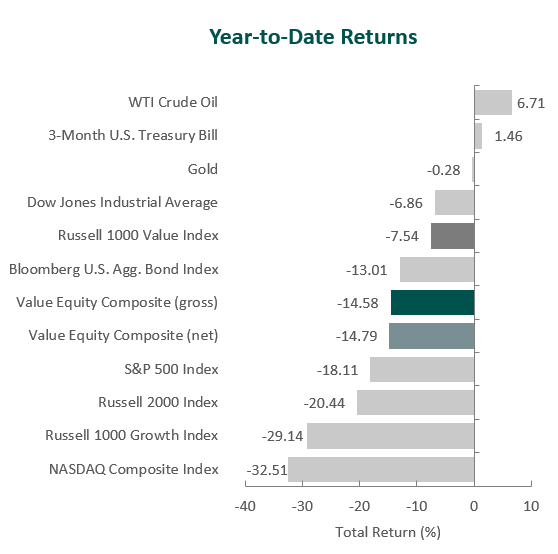


 Composite returns for all periods ended December 31, 2022 are preliminary pending final account reconciliation.