(All MSCI index returns are shown net and in U.S. dollars unless otherwise noted.)
Markets Review

Sources: SS&C Advent, Bloomberg
Past performance is not indicative of future results. Aristotle International Equity Composite returns are presented gross and net of investment advisory fees and include the reinvestment of all income. Gross returns will be reduced by fees and other expenses that may be incurred in the management of the account. Net returns are presented net of actual investment advisory fees and after the deduction of all trading expenses. Aristotle Capital Composite returns are preliminary pending final account reconciliation. Please see important disclosures at the end of this document.
Global equity markets continued to rally for the second quarter of the year, as the MSCI ACWI Index increased 6.18% during the period. Concurrently, the Bloomberg Global Aggregate Bond Index decreased 1.53%. In terms of style, growth stocks outperformed their value counterparts during the quarter, with the MSCI ACWI Growth Index beating the MSCI ACWI Value Index by 6.22%.
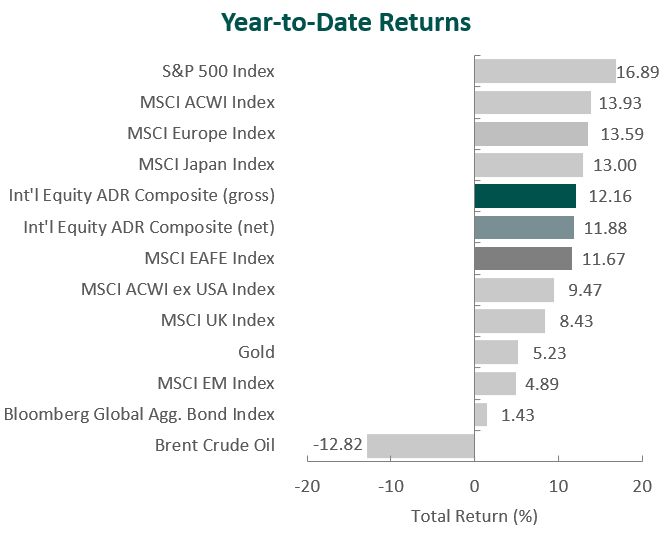
The MSCI EAFE Index climbed 2.95% during the second quarter, while the MSCI ACWI ex USA Index increased 2.44%. Within the MSCI EAFE Index, Asia and Europe & Middle East were the strongest-performing regions, while the U.K. gained the least. On a sector basis, seven out of the eleven sectors within the MSCI EAFE Index posted positive returns, with Industrials, Information Technology and Consumer Discretionary generating the largest gains. Conversely, Communication Services, Real Estate and Materials were the worst performers.
Although the global economy continues to recover with improved supply-chain dynamics, lower food and energy costs, and resilient demand, the outlook remains uncertain as geopolitical tensions persist, China’s recovery underwhelms and global monetary policy decisions lead to unintended side effects. Correspondingly, the IMF slightly lowered its growth forecasts and now projects global growth to fall to 2.8% in 2023 from 3.4% in 2022, before settling at 3.0% in 2024.
In addition to the dampened outlook, elevated levels of inflation persisted, and progress toward disinflation was mixed on a regional basis. The U.S. and eurozone reported inflation of 4.0% and 6.1% in May, respectively, down from 4.9% and 7.0% in April. However, improvement in U.K. inflation stalled, and Japan’s index that excludes fuel rose 4.3 % in May from a year earlier, its highest mark in 42 years. Overall, the IMF increased its projection for global inflation to 7.0% from 6.6% for the year. Given the mixed inflation data, there was a wide range of central bank policy actions during the quarter. Central banks in some areas, including the eurozone and U.K., continued to increase rates to combat inflation. However, the U.S. Federal Reserve held rates steady in June after raising them in May, and the Bank of Japan maintained its highly accommodative stance.
Meanwhile, China cut the interest rate on its one-year medium-term lending facility as the country’s industrial output and retail sales growth missed forecasts. Despite the relaxation of the strict zero-COVID guidelines, sluggish demand, potential deflation and increased COVID cases have deterred a smooth recovery.
On the geopolitical front, tensions in Asia continued to build as the U.S. and Taiwan signed the U.S.-Taiwan Initiative on 21st Century Trade, which furthers trade interests between the two countries. However, the U.S. and China kept dialogue open, as U.S. Secretary of State Antony Blinken met with President Xi Jinping in Beijing. In Eastern Europe, Ukrainian troops initiated a counteroffensive intended to secure additional ground in eastern Ukraine. Western countries reaffirmed their support for Ukraine, as the U.S. committed an additional $1.3 billion of aid and the European Union offered €50 billion through 2027 to rebuild the nation.
Performance and Attribution Summary
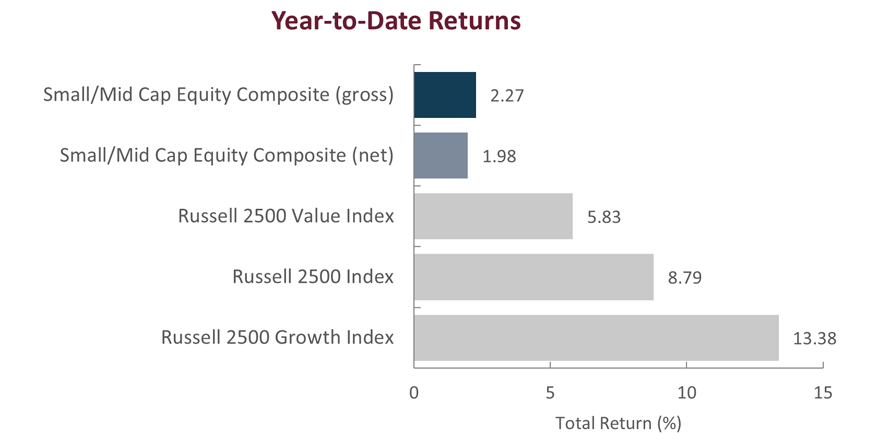
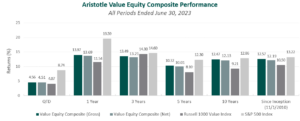
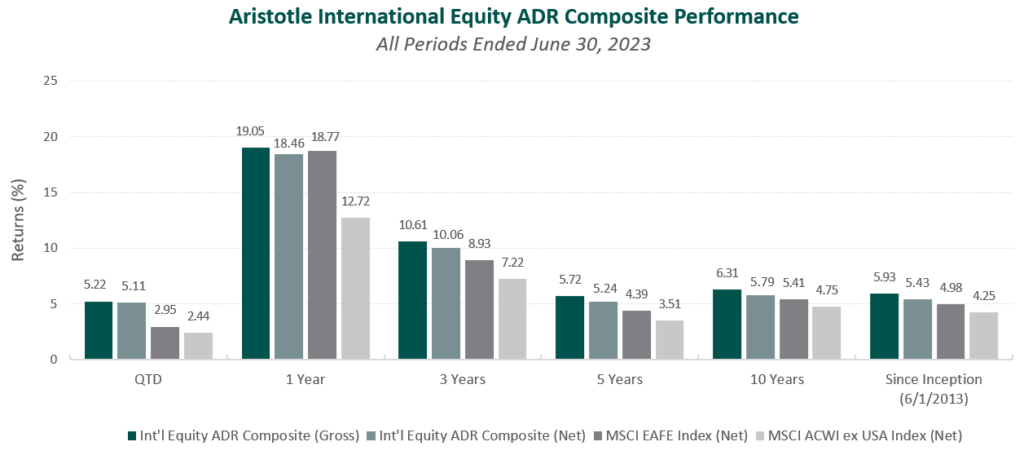
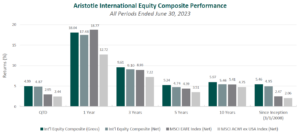
For the second quarter of 2023, Aristotle Capital’s International Equity Composite posted a total return of 4.99% gross of fees (4.87% net of fees), outperforming the MSCI EAFE Index, which returned 2.95%, and the MSCI ACWI ex USA Index, which returned 2.44%. Please refer to the table below for detailed performance.
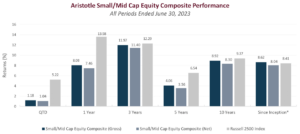
| Performance (%) | 2Q23 | YTD | 1 Year | 3 Years | 5 Years | 10 Years | Since Inception* |
|---|---|---|---|---|---|---|---|
| International Equity Composite (gross) | 4.99 | 12.44 | 18.04 | 9.61 | 5.24 | 5.97 | 5.46 |
| International Equity Composite (net) | 4.87 | 12.19 | 17.48 | 9.10 | 4.74 | 5.46 | 4.95 |
| MSCI EAFE Index (net) | 2.95 | 11.67 | 18.77 | 8.93 | 4.39 | 5.41 | 2.47 |
| MSCI ACWI ex USA Index (net) | 2.44 | 9.47 | 12.72 | 7.22 | 3.51 | 4.75 | 2.06 |
Source: FactSet
Past performance is not indicative of future results. Attribution results are based on sector returns which are gross of investment advisory fees. Attribution is based on performance that is gross of investment advisory fees and includes the reinvestment of income.
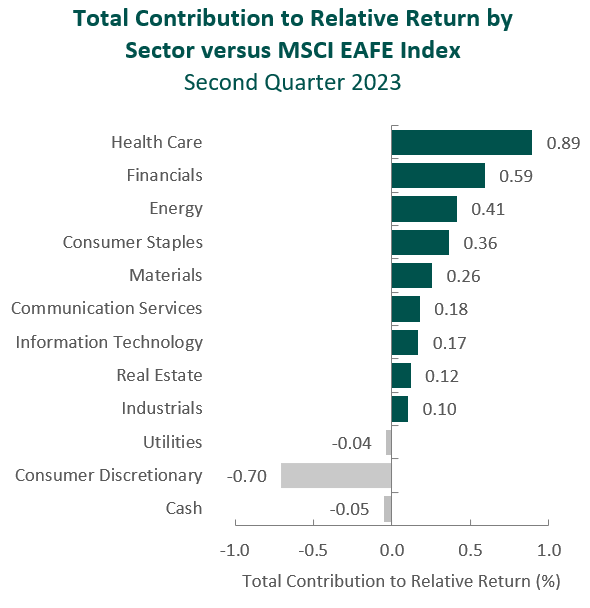
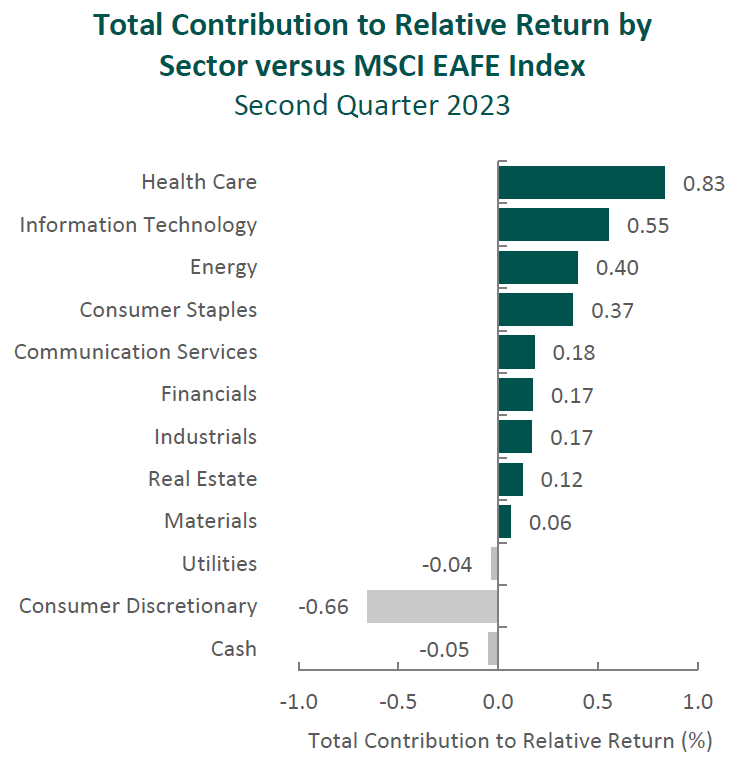
From a sector perspective in the second quarter, the portfolio’s outperformance relative to the MSCI EAFE Index can be primarily attributed to security selection, while allocation effects also had a positive impact. Security selection in Health Care, Energy and Information Technology contributed the most to the portfolio’s relative performance. Conversely, security selection in Consumer Discretionary, a lack of exposure to Utilities and an overweight in Energy detracted from relative return.
Regionally, both security selection and allocation effects were responsible for the portfolio’s outperformance. Security selection in the U.K. and Europe contributed the most to relative performance, while security selection and an underweight in Asia detracted.
Contributors and Detractors for 2Q 2023
| Relative Contributors | Relative Detractors |
|---|---|
| Cameco | DSM-Firmenich |
| Alcon | Pan Pacific International |
| Credicorp | Heineken |
| Ashtead Group | DBS Group |
| Experian | FANUC |
Cameco, the world’s largest publicly traded uranium producer, was the top contributor during the period. Over the past year, there has been a rise in support from governments and policymakers for nuclear energy as countries realize it can play a crucial role in lowering dependence on fossil fuels to meet environmental pledges and goals. In addition, Russia’s war in Ukraine had led to an increase in the price of competing carbon fuels and heightened attention on energy security. Although such global market dynamics have likely favored Cameco in the short term, we believe the company will benefit long term from its financial discipline and advantaged assets. (Its Canadian mines—Cigar Lake and McArthur River/Key Lake—produce some of the world’s highest-grade uranium.) Cameco has also slowly ramped up production while obtaining long‐term contracts. As such, in 2022, Cameco signed a record number of long-term supply contracts and conversion services (where yellow cake is processed and readied for enrichment operations). This success has continued into 2023, with Cameco having recently secured an additional 12-year contract with Energoatom, Ukraine’s state-owned nuclear energy company, as well as a 10-year agreement with Bulgaria. Central and Eastern Europe are new markets for Cameco, and this supports our belief that the company is well-positioned to win new business in the regions that were historically dominated by Russia. Moreover, we look forward to Cameco’s planned acquisition of Westinghouse Electric Company (expected to close during the second half of 2023), as we believe Westinghouse’s market-leading downstream capabilities will align well with Cameco’s production and fuel services to offer a highly competitive nuclear fuel solution.
Alcon, the eye care devices, equipment and consumables provider, was also a leading contributor during the quarter. In addition to a backdrop of resilient and robust demand across all of its segments, Alcon’s focus on executing its commercial strategy, pricing improvements and product development demonstrates the strength of the business. As an innovative leader in the eye care industry, Alcon develops cutting-edge products such as Total30, the first reusable lenses using water gradient technology created for astigmatic wearers, and the ARGOS Biometer, which enables surgeons to conduct 3D digital image-guided cataract surgery. Products such as these have allowed Alcon to further penetrate its primary end markets and win market share from competitors. While the company continues to navigate challenges such as inflation and supply-chain inefficiencies, we believe Alcon’s prudent decisions that have helped maintain operational efficiency, its thoughtful approach to acquisitions, and the advantageous industry dynamics highlight the high-quality nature of the company and the long-term sustainability of its business model.
DSM-Firmenich (DSM), previously known as Koninklijke DSM, a nutrition, health and ingredients company, was the largest detractor for the period. The company completed its merger with Firmenich International during the quarter. We expect that a successful integration of the two companies will further solidify DSM’s leading market position in health, nutrition, flavors and fragrances. DSM also completed the sale of its Engineering Materials business, culminating two decades of transitioning into a “pure-play” nutrition, health and ingredients company. Despite the milestone, the company continues to manage weak near-term market dynamics that have caused soft volumes across most of its segments, especially vitamins, and elevated levels of high-priced inventories. As is usually the case, we will be aware of such short-term headwinds but will focus our attention on ensuring fundamentals improve and catalysts realize over time.
Heineken, the Dutch brewer that owns a global portfolio of beer brands, was one of the largest detractors. The company saw volumes weaken in several emerging markets. They included Nigeria, whose consumers faced a grain crisis, and Vietnam, which experienced an uptick in unemployment as well as a real estate crisis. Heineken may have been slow to react to the changing conditions and is thus working through high stock levels. As we look past cyclical disruptions, our conviction remains that Heineken’s brands possess the pricing power to overcome inflationary pressures and are singularly poised to gain share in developing markets as consumers switch to premium beers. In addition, we appreciate Heineken’s more balanced approach between price and volume, as well as cost reduction, which could drive further improvements in profitability.
Recent Portfolio Activity
| Buys | Sells |
|---|---|
| None | None |
Consistent with our long-term horizon and low turnover, there were no new purchases or sales completed during the quarter.
Conclusion
At Aristotle Capital, we take a bottom-up approach to studying businesses. While macroeconomic factors such as inflation, monetary policy decisions and geopolitical conflicts may continue to dominate the current news cycle, we take a long-term perspective, attempting to identify, what we believe to be, high-quality companies that can successfully navigate periods of boom and bust. We spend very little time attempting to predict the outcome of macro or geopolitical events but rather spend considerable time attempting to identify businesses that are resilient. In our view, the fundamentals of a business are the most important determinants of its long-term stock price performance. Consequently, we believe the best way to consistently add value for our clients is to maintain a long-term view and focus on deeply understanding individual companies’ key attributes, value drivers and progress toward improvement.
The opinions expressed herein are those of Aristotle Capital Management, LLC (Aristotle Capital) and are subject to change without notice. Past performance is not a guarantee or indicator of future results. This material is not financial advice or an offer to buy or sell any product. You should not assume that any of the securities transactions, sectors or holdings discussed in this report were or will be profitable, or that recommendations Aristotle Capital makes in the future will be profitable or equal the performance of the securities listed in this report. The portfolio characteristics shown relate to the Aristotle International Equity strategy. Not every client’s account will have these characteristics. Aristotle Capital reserves the right to modify its current investment strategies and techniques based on changing market dynamics or client needs. There is no assurance that any securities discussed herein will remain in an account’s portfolio at the time you receive this report or that securities sold have not been repurchased. The securities discussed may not represent an account’s entire portfolio and, in the aggregate, may represent only a small percentage of an account’s portfolio holdings. The performance attribution presented is of a representative account from Aristotle Capital’s International Equity Composite. The representative account is a discretionary client account which was chosen to most closely reflect the investment style of the strategy. The criteria used for representative account selection is based on the account’s period of time under management and its similarity of holdings in relation to the strategy. Recommendations made in the last 12 months are available upon request.
Returns are presented gross and net of investment advisory fees and include the reinvestment of all income. Gross returns will be reduced by fees and other expenses that may be incurred in the management of the account. Net returns are presented net of actual investment advisory fees and after the deduction of all trading expenses.
All investments carry a certain degree of risk, including the possible loss of principal. Investments are also subject to political, market, currency and regulatory risks or economic developments. International investments involve special risks that may in particular cause a loss in principal, including currency fluctuation, lower liquidity, different accounting methods and economic and political systems, and higher transaction costs. These risks typically are greater in emerging markets. Securities of small‐ and medium‐sized companies tend to have a shorter history of operations, be more volatile and less liquid. Value stocks can perform differently from the market as a whole and other types of stocks.
The material is provided for informational and/or educational purposes only and is not intended to be and should not be construed as investment, legal or tax advice and/or a legal opinion. Investors should consult their financial and tax adviser before making investments. The opinions referenced are as of the date of publication, may be modified due to changes in the market or economic conditions, and may not necessarily come to pass. Information and data presented has been developed internally and/or obtained from sources believed to be reliable. Aristotle Capital does not guarantee the accuracy, adequacy or completeness of such information.
Aristotle Capital Management, LLC is an independent registered investment adviser under the Advisers Act of 1940, as amended. Registration does not imply a certain level of skill or training. More information about Aristotle Capital, including our investment strategies, fees and objectives, can be found in our Form ADV Part 2, which is available upon request. ACM-2307-43

Composite returns for all periods ended June 30, 2023 are preliminary pending final account reconciliation.
Past performance is not indicative of future results. The information provided should not be considered financial advice or a recommendation to purchase or sell any particular security or product. Performance results for periods greater than one year have been annualized.
Returns are presented gross and net of investment advisory fees and include the reinvestment of all income. Gross returns will be reduced by fees and other expenses that may be incurred in the management of the account. Net returns are presented net of actual investment advisory fees and after the deduction of all trading expenses.
The MSCI EAFE Index (Europe, Australasia, Far East) is a free float-adjusted market capitalization-weighted index that is designed to measure the equity market performance of developed markets, excluding the United States and Canada. The MSCI EAFE Index consists of the following 21 developed market country indexes: Australia, Austria, Belgium, Denmark, Finland, France, Germany, Hong Kong, Ireland, Israel, Italy, Japan, the Netherlands, New Zealand, Norway, Portugal, Singapore, Spain, Sweden, Switzerland and the United Kingdom. The MSCI ACWI captures large and mid-cap representation across 23 developed market countries and 24 emerging markets countries. With approximately 3,000 constituents, the Index covers approximately 85% of the global investable equity opportunity set. The MSCI ACWI Growth Index captures large and mid-cap securities exhibiting overall growth style characteristics across 23 developed markets countries and 24 emerging markets countries. The MSCI ACWI Value Index captures large and mid-cap securities exhibiting overall value style characteristics across 23 developed markets countries and 24 emerging markets countries. The MSCI ACWI ex USA Index captures large and mid-cap representation across 22 of 23 developed markets countries (excluding the United States) and 24 emerging markets countries. With approximately 2,300 constituents, the Index covers approximately 85% of the global equity opportunity set outside the United States. The MSCI Emerging Markets Index is a free float-adjusted market capitalization-weighted index that is designed to measure the equity market performance of emerging markets. The MSCI Emerging Markets Index consists of the following 24 emerging market country indexes: Brazil, Chile, China, Colombia, Czech Republic, Egypt, Greece, Hungary, India, Indonesia, Korea, Kuwait, Malaysia, Mexico, Peru, Philippines, Poland, Qatar, Saudi Arabia, South Africa, Taiwan, Thailand, Turkey and United Arab Emirates. The S&P 500® Index is the Standard & Poor’s Composite Index of 500 stocks and is a widely recognized, unmanaged index of common stock prices. The Brent Crude Oil Index is a major trading classification of sweet light crude oil that serves as a major benchmark price for purchases of oil worldwide. The MSCI Japan Index is designed to measure the performance of the large and mid-cap segments of the Japanese market. With approximately 250 constituents, the Index covers approximately 85% of the free float-adjusted market capitalization in Japan. The Bloomberg Global Aggregate Bond Index is a flagship measure of global investment grade debt from 28 local currency markets. This multi-currency benchmark includes treasury, government-related, corporate and securitized fixed-rate bonds from both developed and emerging markets issuers. The MSCI United Kingdom Index is designed to measure the performance of the large and mid-cap segments of the U.K. market. With nearly 100 constituents, the Index covers approximately 85% of the free float-adjusted market capitalization in the United Kingdom. The MSCI Europe Index captures large and mid-cap representation across 15 developed markets countries in Europe. With approximately 430 constituents, the Index covers approximately 85% of the free float-adjusted market capitalization across the European developed markets equity universe. These indexes have been selected as the benchmarks and are used for comparison purposes only. The volatility (beta) of the Composite may be greater or less than the respective benchmarks. It is not possible to invest directly in these indexes.