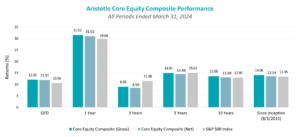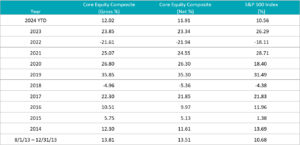
Markets Review

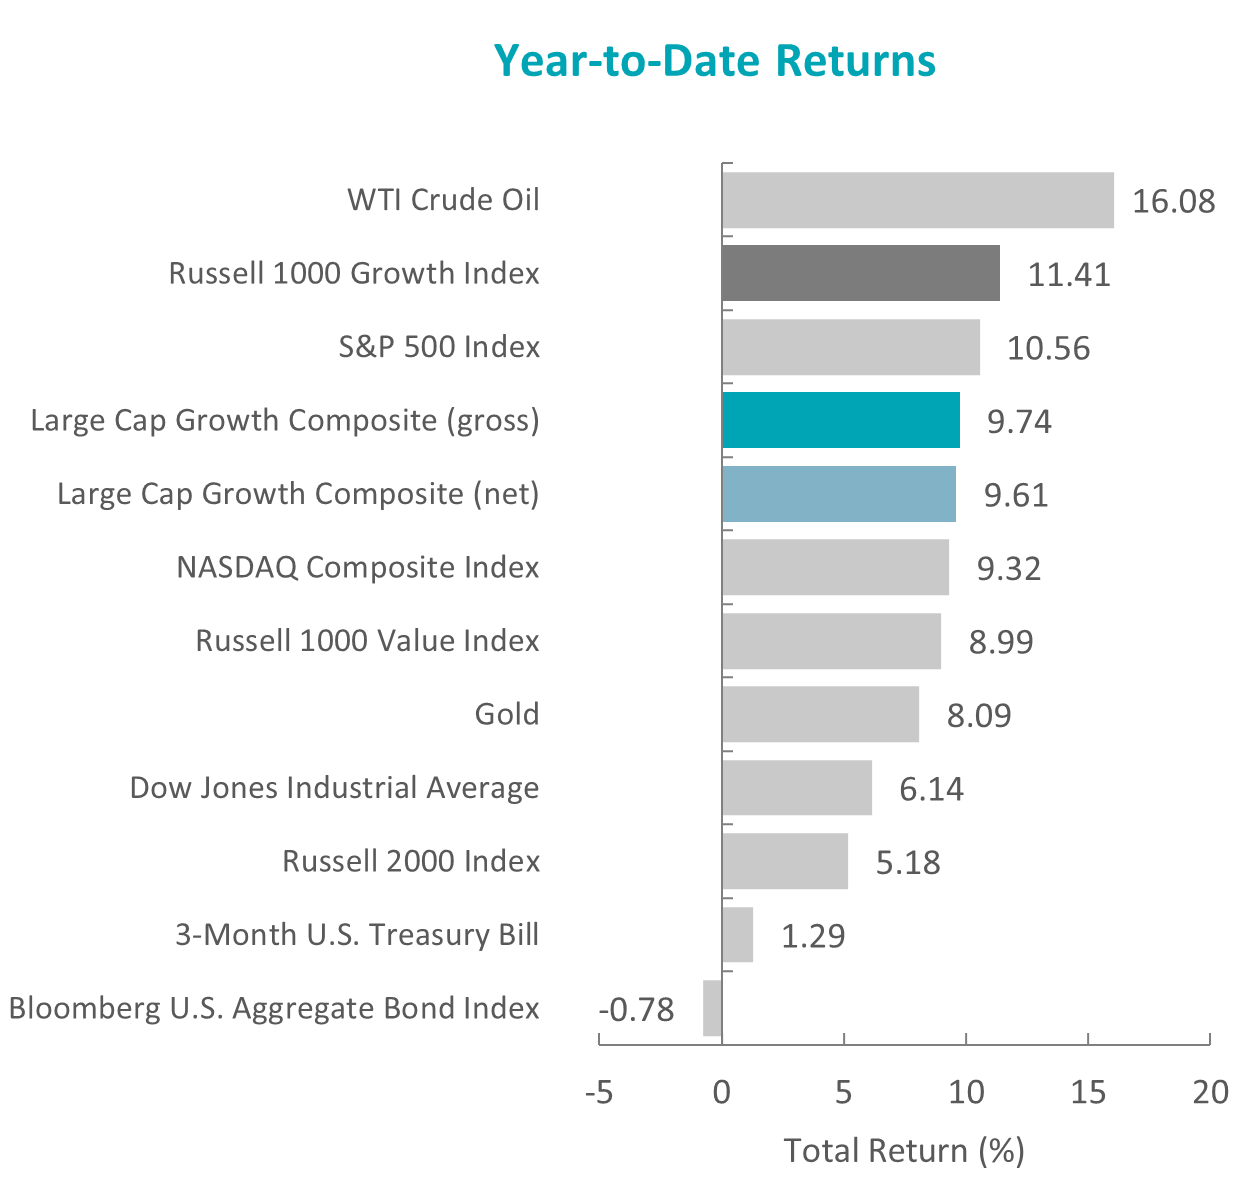
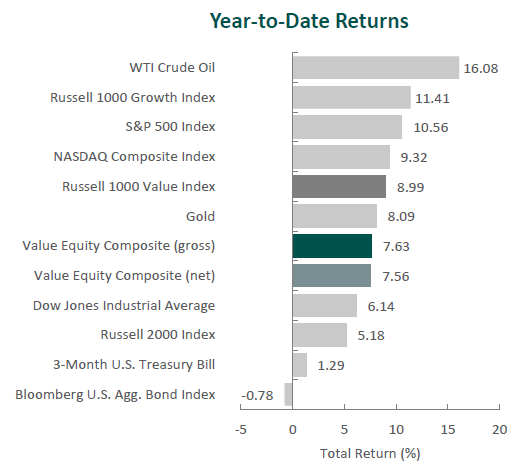
Sources: CAPS CompositeHubTM, Bloomberg
Past performance is not indicative of future results. Aristotle Value Equity Composite returns are presented gross and net of investment advisory fees and include the reinvestment of all income. Gross returns will be reduced by fees and other expenses that may be incurred in the management of the account. Net returns are presented net of actual investment advisory fees and after the deduction of all trading expenses. Aristotle Capital Composite returns are preliminary pending final account reconciliation. Please see important disclosures at the end of this document.
After three consecutive positive quarters, the U.S. equity market pulled back, as the S&P 500 Index declined 3.27% during the quarter. Concurrently, the Bloomberg U.S. Aggregate Bond Index also fell, dropping 3.23% for the quarter. In terms of style, the Russell 1000 Growth Index slightly outperformed its value counterpart by 0.03%.

Declines were broad-based, as ten out of the eleven sectors within the Russell 1000 Value Index finished lower. Consumer Discretionary, Utilities and Real Estate were the worst-performing sectors. Meanwhile, Energy was the only sector in the green, and Financials and Information Technology declined the least.

Economic growth in the U.S. remained steady, as data released during the quarter showed real GDP increased at an annual rate of 2.1%. The increase was driven by higher levels of consumer and government spending, as well as nonresidential fixed investment. The labor market remained tight during the period, with a 3.8% unemployment rate in August, while average hourly earnings for all employees increased by 4.3% year-over-year.

There was an uptick in inflation reported during the quarter, as annualized CPI increased from 3.0% in June to 3.7% in August. In addition, oil hit its highest level of the year, with both WTI and Brent eclipsing $90 a barrel. Given the concerns about rebounding inflation, 10-year and 30-year Treasury yields spiked to their highest marks since 2007 and 2011, finishing the quarter at 4.59% and 4.73%, respectively. However, the broader trend of disinflation continues, as the 3.7% August CPI figure is still less than half the 8.3% increase the Index experienced the year prior.

After raising its benchmark federal funds rate to a range of 5.25% to 5.50% in July, the Federal Reserve (Fed) held interest rates steady in September, citing a solid pace of expanding economic activity, a slightly softer—yet still strong—labor market and tighter credit conditions. The Fed indicated that it would continue to monitor cumulative monetary policy, the lagged effects of policy decisions, and economic and financial developments when determining the extent of additional rate increases.

On the corporate earnings front, S&P 500 companies reported a 4.1% decline in earnings, the third straight quarter that saw a year-over-year decrease. Despite the drop, fewer companies discussed “recession” and “inflation” during the reporting period. Furthermore, aggregate earnings estimates for the third quarter increased by 0.4% (above the 10-year average of -3.4%), the first increase in nearly two years.

Performance and Attribution Summary

For the third quarter of 2023, Aristotle Capital’s Value Equity Composite posted a total return of -2.99% gross of fees (-3.05% net of fees), outperforming the -3.16% return of the Russell 1000 Value Index and the -3.27% return of the S&P 500 Index. Please refer to the table for detailed performance.

Performance (%) 3Q23 YTD 1 Year3 Years5 Years10 Years
Value Equity Composite (gross)-2.995.3816.529.478.8611.25
Value Equity Composite (net)-3.055.1916.239.198.5610.91
Russell 1000 Value Index-3.161.7914.4411.056.228.44
S&P 500 Index-3.2713.0721.6210.159.9111.91
Past performance is not indicative of future results. Aristotle Value Equity Composite returns are presented gross and net of investment advisory fees and include the reinvestment of all income. Gross returns will be reduced by fees and other expenses that may be incurred in the management of the account. Net returns are presented net of actual investment advisory fees and after the deduction of all trading expenses. Aristotle Capital Composite returns are preliminary pending final account reconciliation. Please see important disclosures at the end of this document.

Source: FactSet
Past performance is not indicative of future results. Attribution results are based on sector returns which are gross of investment advisory fees. Attribution is based on performance that is gross of investment advisory fees and includes the reinvestment of income.

The portfolio’s outperformance relative to the Russell 1000 Value Index in the third quarter can be attributed to security selection, while allocation effects had a negative impact. Security selection in Health Care, Consumer Discretionary and Communication Services contributed the most to relative performance. Conversely, an underweight in Energy and security selection in Materials and Information Technology detracted. (Relative weights are the result of bottom-up security selection.)

Contributors and Detractors for 3Q 2023

Relative ContributorsRelative Detractors
AmgenXylem
Phillips 66Microchip Technology
BlackstoneCorteva
Mitsubishi UFJ FinancialMartin Marietta Materials
AdobeLennar

Amgen, the biopharmaceutical company, was the top contributor for the quarter. The company continues to leverage its innovative platform to strengthen its product portfolio, offset maturing products, such as Epogen and Neulasta, and increase market share. Over the past year, Amgen has reported double-digit volume growth, operating margin expansion to over 40% and record levels of sales for cholesterol drug Repatha, bone-strengthening drug Prolia and cancer drug Blincyto. Additionally, the company remains well positioned to benefit from the continued development and commercialization of biosimilars such as Amgevita, the first biosimilar to Humira, and the successful integration of Otezla to bolster its inflammation segment. Lastly, the FTC agreed to allow Amgen to proceed with its $27.8 billion acquisition of Horizon Therapeutics. We note that this is yet another unsuccessful attempt by the FTC to block an M&A transaction of one of our holdings (see below re: Activision Blizzard). The transaction closed on October 6, 2023 and brings expertise in rare disease therapies (including bulging eye-drug Tepezza) as well as adds to Amgen’s immunology portfolio.

Phillips 66, a diversified refiner, chemicals and midstream energy company, was a leading contributor for the quarter. While still perceived by many as just a refiner, we continue to be impressed by the company’s ongoing transformation to a more diversified energy business. Consistent with this strategy, Phillips 66 completed the acquisition of DCP Midstream, which expands its NGL (natural gas liquids) business that now spans the entire natural gas value chain, from wellhead to end user. In addition, the company remains on track in converting its San Francisco refinery into one of the world’s largest renewable fuels facilities, with commercial operations set to begin in early 2024. The firm has also made progress on various projects designed to enhance efficiency, increase utilization and bolster capture rates, which can deliver $800 million in cost savings by the end of 2023. With these improvements, as well as further optimization of its midstream and chemicals businesses, we believe Phillips 66 is well positioned to increase its FREE cash flow generation as it continues to become “much more than a refiner.” 

Xylem, the water equipment and services supplier, was the largest detractor for the quarter. After closing the transformational acquisition of Evoqua in May 2023, long-time CEO Patrick Decker announced he would retire at the end of 2023 and COO Matthew Pine will step into the top position. Concurrently, Xylem announced a change in its CFO, with William Grogan joining from IDEX Corporation where he served as CFO since 2017. While C-suite turnover is not desirable, it is inevitable. Moreover, we see the company’s succession planning as well thought out and well executed. Meanwhile, Xylem reported double-digit increases in revenue across all segments and end markets amid strong global demand from public utilities, as well as industrial, commercial and residential clients, that seek solutions to treat, test, transport and preserve water. We believe Xylem’s portfolio of highly differentiated pumps, recognized for their quality and critical uses, as well as the company’s ability to cross‐sell and link other products such as sensors and smart meters, will make it a one‐stop shop for utilities and protect the company from pure price competition. In our opinion, long‐term trends, such as water scarcity and the need to replace aging water infrastructure, create strong underlying demand for Xylem’s products through various parts of the economic cycle. We will evaluate the announced management transitions and will closely monitor the company’s ongoing integration of Evoqua.

Microchip Technology, the microcontroller (MCU) and analog semiconductor producer, was a primary detractor for the period. Despite posting record levels of sales, margins and gross profit, management indicated it expects a challenging near-term demand environment due to weakness in China, a slowdown in Europe and early signs of weakness in auto. The company has also accommodated some push-out requests from customers, which will translate into lower sales for the coming months. Despite operating in a cyclical industry, Microchip has been able to generate 15+ years of robust FREE cash flow and margins, while lowering its debt (has paid down $6.8 billion of debt over the last 20 quarters, reducing net leverage to 1.29x) and consistently returning money to shareholders. This, we believe, speaks to management’s proven ability to manage the business through economic cycles, while taking advantage of its broad portfolio to continue gaining share in areas including IoT, 5G infrastructure, autonomous driving and data centers.

Recent Portfolio Activity

BuysSells
NoneActivision Blizzard

During the quarter, we sold our position in Activision Blizzard.

We first purchased Activision Blizzard, one of the largest video game companies in the world, during the second quarter of 2023. We have long appreciated the critical role Activision Blizzard’s gaming franchises play for PlayStation, Xbox and the broader gaming industry. Moreover, we believe the company is on the path toward increasing its revenue from new products that rely on in-game transactions and advertising, as well as through further leveraging its intellectual property from consoles and PCs into mobile games. At the time of purchase, there was heightened uncertainty regarding whether regulators would approve the pending acquisition of the company by Microsoft, a current Value Equity holding. This, we believe, provided an opportunity for us to own Activision Blizzard at an attractive discount to our estimates of intrinsic value should the company remain independent. Conversely, if the transaction commenced and Activision Blizzard was indeed acquired, we would still benefit through our investment in Microsoft. As such, rather than attempting to predict regulatory approval of the transaction, we instead saw the company as an optimal investment. With the uncertainties regarding regulatory approval nearly disappearing, we decided to exit our investment.

Conclusion

Rather than attempting to predict short-term market dynamics, at Aristotle Capital, we stay focused on understanding company fundamentals while carefully monitoring the long-term evolution of our portfolio of holdings. Our approach to understanding individual businesses reveals more insightful conclusions than would undue time spent concentrating on ever-changing and often unclear macroeconomic signals. While we strive to remain macro aware, our goal instead is to invest in businesses which are run by what we believe are capable and proven management teams that have the skill to navigate changing factors such as inflation, interest rates and government policy. We also analyze how such factors could alter the fundamentals of a business and whether those impacts are long term in nature.

We aim to find companies with high-quality characteristics that can succeed over full market cycles. It is our belief that a disciplined, research-oriented approach to finding great companies, as well as a consistent, well-executed portfolio management process, is how we can add the most value for our clients.

Disclosures

The opinions expressed herein are those of Aristotle Capital Management, LLC (Aristotle Capital) and are subject to change without notice. Past performance is not a guarantee or indicator of future results. This material is not financial advice or an offer to purchase or sell any product. You should not assume that any of the securities transactions, sectors or holdings discussed in this report were or will be profitable, or that recommendations Aristotle Capital makes in the future will be profitable or equal the performance of the securities listed in this report. The portfolio characteristics shown relate to the Aristotle Value Equity strategy. Not every client’s account will have these characteristics. Aristotle Capital reserves the right to modify its current investment strategies and techniques based on changing market dynamics or client needs. There is no assurance that any securities discussed herein will remain in an account’s portfolio at the time you receive this report or that securities sold have not been repurchased. The securities discussed may not represent an account’s entire portfolio and, in the aggregate, may represent only a small percentage of an account’s portfolio holdings. The performance attribution presented is of a representative account from Aristotle Capital’s Value Equity Composite. The representative account is a discretionary client account which was chosen to most closely reflect the investment style of the strategy. The criteria used for representative account selection is based on the account’s period of time under management and its similarity of holdings in relation to the strategy. Recommendations made in the last 12 months are available upon request.

Returns are presented gross and net of investment advisory fees and include the reinvestment of all income. Gross returns will be reduced by fees and other expenses that may be incurred in the management of the account. Net returns are presented net of actual investment advisory fees and after the deduction of all trading expenses.

All investments carry a certain degree of risk, including the possible loss of principal. Investments are also subject to political, market, currency and regulatory risks or economic developments. International investments involve special risks that may in particular cause a loss in principal, including currency fluctuation, lower liquidity, different accounting methods and economic and political systems, and higher transaction costs. These risks typically are greater in emerging markets. Securities of small‐ and medium‐sized companies tend to have a shorter history of operations, be more volatile and less liquid. Value stocks can perform differently from the market as a whole and other types of stocks.

The material is provided for informational and/or educational purposes only and is not intended to be and should not be construed as investment, legal or tax advice and/or a legal opinion. Investors should consult their financial and tax adviser before making investments. The opinions referenced are as of the date of publication, may be modified due to changes in the market or economic conditions, and may not necessarily come to pass. Information and data presented has been developed internally and/or obtained from sources believed to be reliable. Aristotle Capital does not guarantee the accuracy, adequacy or completeness of such information.

Aristotle Capital Management, LLC is an independent registered investment adviser under the Advisers Act of 1940, as amended. Registration does not imply a certain level of skill or training. More information about Aristotle Capital, including our investment strategies, fees and objectives, can be found in our ADV Part 2, which is available upon request. ACM-2310-24

Performance Disclosures

Composite returns for all periods ended September 30, 2023 are preliminary pending final account reconciliation.

Past performance is not indicative of future results. The information provided should not be considered financial advice or a recommendation to purchase or sell any particular security or product. Performance results for periods greater than one year have been annualized. The Aristotle Value Equity strategy has an inception date of November 1, 2010; however, the strategy initially began at Mr. Gleicher’s predecessor firm in October 1997. A supplemental performance track record from January 1, 2001 through October 31, 2010 is provided above. The returns are based on two separate accounts and performance results are based on custodian data. During this time, Mr. Gleicher had primary responsibility for managing the two accounts, one account starting in November 2000 and the other December 2000.

Returns are presented gross and net of investment advisory fees and include the reinvestment of all income. Gross returns will be reduced by fees and other expenses that may be incurred in the management of the account. Net returns are presented net of actual investment advisory fees and after the deduction of all trading expenses.

Index Disclosures

The Russell 1000 Value® Index measures the performance of the large cap value segment of the U.S. equity universe. It includes those Russell 1000 Index companies with lower price-to-book ratios and lower expected growth values. The S&P 500® Index is the Standard & Poor’s Composite Index of 500 stocks and is a widely recognized, unmanaged index of common stock prices. The Russell 1000® Growth Index measures the performance of the large cap growth segment of the U.S. equity universe. It includes those Russell 1000 companies with higher price-to-book ratios and higher forecasted growth values. The Russell 2000® Index measures the performance of the small cap segment of the U.S. equity universe. The Russell 2000 Index is a subset of the Russell 3000® Index representing approximately 10% of the total market capitalization of that index. It includes approximately 2,000 of the smallest securities based on a combination of their market cap and current index membership. The Dow Jones Industrial Average® is a price-weighted measure of 30 U.S. blue-chip companies. The Index covers all industries except transportation and utilities. The NASDAQ Composite Index measures all NASDAQ domestic and international based common type stocks listed on The NASDAQ Stock Market. The NASDAQ Composite includes over 3,000 companies, more than most other stock market indexes. The Bloomberg U.S. Aggregate Bond Index is an unmanaged index of domestic investment grade bonds, including corporate, government and mortgage-backed securities. The WTI Crude Oil Index is a major trading classification of sweet light crude oil that serves as a major benchmark price for oil consumed in the United States. The Brent Crude Oil Index is a major trading classification of sweet light crude oil that serves as a major benchmark price for purchases of oil worldwide. The 3-Month U.S. Treasury Bill is a short-term debt obligation backed by the U.S. Treasury Department with a maturity of three months. Consumer Price Index is a measure of the average change over time in the prices paid by urban consumers for a market basket of consumer goods and services. The volatility (beta) of the Composite may be greater or less than its respective benchmarks. It is not possible to invest directly in these indexes.

Host: Alex Warren, CFA, CAIA

Guest: Maria Katsileros, CIMC, CSRIC

September 21, 2023

Episode Length: 13:43

In this episode, we speak with Maria Katsileros, Client Portfolio Manager at Aristotle Capital Boston. Maria shares her thoughts on the low valuations of U.S. small cap stocks relative to their own history and larger cap peers, cycles, and tailwinds for the asset class. The conversation also touches on the importance of active management in the space, opportunities in the market, and why small caps deserve a place in portfolios today.

SHOW NOTES
  • Host introduction (0:00-0:19)
  • Episode introduction (0:20-0:45)
  • Introduction of the episode’s guest: Maria Katsileros (0:46-1:31)
  • How have small caps performed in macro environments like the current one? (1:32-2:55)
  • The opportunity in small caps (2:56-4:02)
  • Mean reversion and what will cause a change in fortunes for small caps(4:03-5:30)
  • Other tailwinds supporting small caps (5:31-6:47)
  • Separating the wheat from the chaff in the Russell 2000 Index (6:48-9:26)
  • Where is the investment team seeing opportunities today? (9:27-10:06)
  • Potential trade-offs of timing small cap exposure (10:07-11:27)
  • Why do small caps deserve a place in portfolios today? (11:28-12:40)
  • Conclusion (12:41-13:07)
  • Disclosure (13:10-13:43)
TRANSCRIPT

Alex Warren: Welcome to the Power of Patience, Aristotle’s podcast where we share our views on topics actively explored by our investment teams and across the organization. I’m Alex Warren, product specialist at Aristotle, and I’ll be your host today.

Coming up on today’s episode, we’ll be speaking with Maria Katsileros, Client Portfolio Manager at Aristotle Capital Boston. If you enjoy this podcast, please like and share it on LinkedIn to help spread the word.

Today on the show we’ll discuss the current state of US small-cap stocks, opportunities versus their larger peers, and why small-caps deserve a place in portfolios today.

Without further ado, let’s get started. Maria, thank you so much for joining us today. To lead off the discussion, can you tell me a bit about yourself and your role at Aristotle Capital Boston?

Maria Katsileros: Thank you, Alex. As Alex mentioned, my name is Maria Katsileros and I’m the Client Portfolio Manager for Aristotle Capital Boston, and I’m also a member of the investment team. I’ve been in the industry for 25 years, and prior to joining Aristotle, I was a Senior Vice President and Senior Investment Strategist at a trillion-dollar global asset management firm based out of their North American headquarters in Boston.

In my current role, I serve as the primary day-to-day contact for Aristotle Boston’s clients, providing macroeconomic and asset class-specific insights as well as assisting clients in their servicing needs.

Alex Warren: Wonderful, thank you, Maria. Now let’s dive right in.

It’s been a challenging macro environment for global investors. How have small-caps performed in times like these?

Maria Katsileros: Yes, Alex, it has been a challenging environment. A little over a year ago, we saw inflation peak at 9.1%, and since then it’s rolled over, but remains sticky, and above the Fed’s 2% target. The Fed raised rates by 5% in the past year and a half to tame inflationary pressures, and GDP growth has slowed to below 2% trend.

What’s interesting though is when you look at small-caps historically in similar periods, the asset class has performed quite well. We analyzed all time periods going back to 1950 where inflation started above 3% and was decelerating, meaning it was decreasing in its pace of change, and what we found was that the average return for small-caps during those 18 periods was a little over 20%. And when you compare that to how large-caps performed during those similar time periods, small-caps outperform large-caps by on average of 5%.

Additionally, when looking at historical environments, when inflation was high, but slowing, and economic growth was below trend, so similar to the period where we are today, small-caps were the best performing asset class, posting on average 25% return, almost twice that of the S&P and both corporate and government bonds.

Alex Warren: That makes sense. Now, why do you see an opportunity in US small-caps?

Maria Katsileros: So Alex, when you look at the long-term averages going back to 1928, small-caps have outperformed large-caps by on average by 2%. But we’ve been in a large-cap cycle for the past 14 years, basically since the Great Financial Crisis of 2008, where large-caps have outperformed small-caps by 300 basis points on an average annualized basis.

If you believe as we do that, the markets tend to be mean reverting, the likelihood that the large-cap cycle will end and a small-cap cycle will begin is more likely than not to occur to get us back to those historical norms.

This has happened in the past, so when looking at the Russell 2000 Index, going back to its inception, there have been 81 periods where the five-year trailing return is below the 10.5% average annualized return for the asset class. In all 81 periods, 100% of the time, the five-year return has been higher to get us back to the 10.5% average annualized return, essentially reverting back to the mean.

Alex Warren: Now, Maria, you mentioned mean reversion a moment ago. What do you think will cause a change in fortunes for small-caps?

Maria Katsileros: I’m sure you’ve heard the rhetoric that we’re long in the tooth on this cycle because cycles tend to last eight to 10 years and we’re kind of rubbing up against that if not over that. But the reality is that cycles don’t start and stop based on the number of years. What determines a cycle is based on historical valuations. So it’s purely valuation driven. So when you’re looking at the current valuations, small-caps are cheap not only on an absolute basis but also relative to large-caps and mid-caps. From an absolute basis standpoint, looking at the P/E, so the price to earnings ratio of the Russell 2000 Index, to get as attractively priced as we are today, you have to look back to the 2008 financial crisis.

On a P/E standpoint from a relative basis, when you’re comparing small-caps to large-caps, you have to go back a little over two decades to the 2001 recession that followed the tech bubble bursts of March of 2000 to get as attractive price as we are today. And when you’re comparing them to mid-caps, the relative PEs are the cheapest they’ve been in 25 years. It’s not just on a P/E basis. Whether you’re looking at it from a trailing P/E, forward P/E, price to book, price to sales, enterprise value to free cash flow, so a number of different metrics, small-caps are more attractively priced than large-caps and mid-caps on all of those metrics.

Alex Warren: Those are some interesting stats. Now away from valuation, where do you see other tailwinds?

Maria Katsileros: So there are two macro tailwinds, Alex, that are supporting small-caps and that’s the Russell 2000 Index’s constitution as well as reshoring. From an Index constitution standpoint, large-caps are levered more towards goods, while small-caps are levered more towards services.

As you’ve heard during the past couple of earning seasons, companies are working through an inventory glut as goods spending trailed off after COVID, and instead, customers are spending on experiences, which benefit small-caps.

From a reshoring perspective, we’ve reached a peak of globalization. You’re starting to see reshoring occur to address a lot of the supply chain disruptions many businesses dealt with during the COVID shutdowns. And that’s specifically happening in the semiconductor as well as pharmaceutical industries. So listening to earnings calls, reshoring mentions have skyrocketed and you’re seeing U.S. companies become less dependent on Chinese imports.

Additionally, when you’re looking at manufacturing jobs in the Midwest, they’re three times higher than on the East or West Coast. Reshoring typically leads to CapEx spending, and small-caps have historically had a higher correlation to CapEx spending as compared to large-caps.

Alex Warren: Three times the job openings. Man, that’s a lot of jobs to fill.

Now, let’s take a look at the index. According to Bank of America research, 34% of the Russell 2000 are non-earners. How does the investment team separate the wheat from the chaff?

Maria Katsileros: So you’re spot on, Alex. The Russell 2000 index is comprised of 34% of non-earners. But what’s even more interesting is that the number has increased substantially over the past five years where non-earners were only 20% of the index historically. And in our view, it makes it even more important to not only have a management team that has expertise in the small-cap space, but also to conduct company-specific research.

So for listeners who may not be familiar with Aristotle Capital Boston, we specialize in US small-cap and SMID-cap portfolios. The two co-portfolio managers, Dave Adams and Jack McPherson, have been managing portfolios together for over 20 years, successfully navigating through multiple market environments. And they’re supported by a four member analyst team that has over 25 years of experience.

If I had to describe what we do at the highest level, we’re a high-quality core manager with a slight value tilt, and that value tilt is due to the contrarian front end of our process.

We’re looking for high-quality companies that have sustainable free cash flows, strong balance sheets, wide moats, and by wide moats, I mean strong industry dynamics, and strong management teams that are great capital allocators. But what we don’t want to do is pay up for that future cash flow. So we’re looking to buy those stocks when they’re trading at a discount to our estimate of intrinsic value, which is why we have that slight value tilt.

So to separate the wheat from the chaff, the team starts by narrowing down the universe, blending quantitative flagging tools with qualitative analysis. Those quantitative flagging tools are meant to weed out companies that are selling at excessive valuations or have highly levered balance sheets, allowing the team to truly focus their attention on those companies that either have the characteristics that make them good long-term investments or have the potential to have those characteristics.

From there, the investment process is solely focused on a qualitative assessment of each company where the PMs and the analysts sit down with the management teams, and they truly try to get an understanding of what they see in the opportunity in front of them. They want to understand the strategy, see how they will capitalize on that opportunity, and they want to understand the sensitivities in the business model to assess what the risks are.

We then apply a valuation methodology that looks at the company’s valuation relative to its history, relative to its peer group, and relative to the market overall. When we’re looking to invest in a company, we look to have at least a three to four times upside reward to downside risk before it enters the portfolio.

Alex Warren: Gotcha. Thank you, Maria.

Now let’s dive into a question that I think folks will find very interesting. Where are you seeing opportunities today?

Maria Katsileros: As mentioned earlier, we’re fundamental bottom-up managers, so we’re not looking to make those macro calls from a sector perspective. But what I can tell you is where we’re looking and spending our research time, which tells you where there might be attractive opportunities.

So we’re finding interesting opportunities in the IT, healthcare, and consumer spaces currently. If you had to group the stocks that we currently purchased in the portfolio into a theme, we’ll call it, the two new additions can be tied to automation and the utilization of AI or artificial intelligence to gain business efficiencies.

Alex Warren: Gotcha.

Now, some folks try to tactically overweight or underweight small-cap exposure based on what’s happening in the macro environment. What potential trade-offs are they making with that approach?

Maria Katsileros: Timing the market, Alex, is very hard, and getting both sides of the trade right, meaning timing that entry point and the exit points, is even harder. We typically see investors try to time going overweight the asset class once the Index is bottomed, but trying to determine the exact entry point is difficult, and if you don’t get it right, it can actually be very costly from a return standpoint. So why do I say that?

Our research shows that going back to the inception of the Russell 2000 Index and looking at periods when the market has bottomed, the forward one-year return on average is almost 64%. But missing just the first five trading days after the market bottom, your return decreases by 12% to 52%. Missing the first 10 days shaves off 20% of your return. And if you miss the first month, your return is almost cut in half at just 37%.

So since markets are forward discounting mechanisms, that’s truly a very short window to try to tactically time when to overweight to get the benefit of that strong return that I mentioned.

Alex Warren: Absolutely. That’s a staggering drop-off and frankly, I don’t think I’m smart enough to try to time markets like that.

Now, Maria, this has been a great conversation and we have time for one final question. Looking out over the next five to 10 years, why do you think small-caps deserve a spot in investor portfolios?

Maria Katsileros: If I had to sum it up, the key things to remember are that markets tend to be mean reverting, and the fact that small-caps have underperformed large-caps for such a long time and to the magnitude that they have, based on history, we’re more likely than not to see a small-cap cycle start. But that million-dollar question is when.

Unfortunately, I don’t have a crystal ball, so I can’t tell you whether it’s three months from now, six months from now, or a year from now. But historically, the cycles have started based on valuations. As we’ve discussed, small-cap valuations look attractive on both an absolute as well as a relative basis.

Additionally, small-caps are beneficiaries of the reshoring trend and the CapEx spending that accompanies it, as well as the experiential spending of consumers.

And finally, one thing that we haven’t touched upon is that the asset class itself is the first asset class to recover going into the early part of the economic cycle. So whether the Fed can pull off a soft landing or we go into a mild recession, once we enter the early part of the economic cycle, small-caps are going to lead the way out.

Alex Warren: That makes sense. Maria, thank you so much for your time today. That brings us to the end of this episode. We hope you’ve enjoyed it and learned more about Aristotle. Thank you for listening to the Power of Patience.

To learn more about Aristotle, please visit www.aristotlecap.com or follow the link in the show notes. If you enjoyed the show, please rate and review us on Spotify and Apple Podcast. On behalf of Aristotle, this is Alex Warren, and thank you for listening.

The opinions expressed herein are those of Aristotle Capital Boston and are subject to change without notice. This material is not financial advice or an offer to purchase or sell any product. Aristotle Boston reserves the right to modify its current investment strategies and techniques based on changing market dynamics or client needs.

Aristotle Capital Boston, LLC, is an independent investment advisor, registered under the Investment Advisors Act of 1940 as amended. Please see additional disclosures within the show notes.

DISCLOSURE

For additional disclosures please refer to www.aristotlecap.com

The last decade has been a story of large cap outperformance. Since June 2003, the Russell 3000 Index has grown four-fold, largely on the strength of the large cap companies in the Russell 1000 Index. The market capitalization of the next two thousand companies in the Index has fallen from a high of 9.5% to a twenty-year low of 5.5% in the spring of 2023. You can make the argument that large cap stocks are expensive or that U.S. small caps are cheap. We will focus on the latter, with small cap valuations low versus their larger peers as well as against their own history. Starting at a low in valuations and weaving in multiple tailwinds that could support small cap performance in the years ahead, we believe now may be the time for investors to take a second look.

To read the full thought piece, please use the link below. 

Key Takeaways:

  • Applying a “sustainable lens” to investing in Aristotle Atlantic’s secular themes can reveal positive sustainability attributes that can enhance the long-term potential of an investment.
  • Secular themes represent significant long-term shifts in spending patterns across industries and geographies, with many presenting unique opportunities that we believe can be aligned with the UN SDGs.
  • Cloud computing is a revolutionary technology that can provide cost reduction, efficiency improvement, cybersecurity enhancement and environmental sustainability.
  • Personalized health utilizes genetic data to optimize therapeutic outcomes, reduce waste and improve access to healthcare.
  • Secular themes that we identify as having positive sustainable attributes can enhance an investment view while aligning investment strategies with positive societal and environmental impacts.

To read the full thought piece, please use the link below. 

Luck is often defined as when preparation meets opportunity.  So it was on June 10th when thoroughbred racehorse Arcangelo won the 155th running of the Belmont Stakes, the third leg of horse racing’s Triple Crown, amongst the most famous annual races in the sport.

Not (yet) a household name, Arcangelo, a gray colt, was surely prepared for the greatest race day of his 3-year-old life.  As reported by The Daily Racing Form publication, he was sired by Arrogate out of the Tapit mare Modeling. His great-grandparents included Unbridled (winner of the 1990 Kentucky Derby and Breeders’ Cup Classic) and Storm Cat (a stallion whose breeding fee during the peak of his stud career was $500,000, the highest in North America at the time – now that’s a nice night’s work!).  Arcangelo, a Kentucky bred, is trained by Jena M. Antonucci.   He has improved his time, speed rating and placement in each of his races, culminating in this Belmont Stakes win.  But he had few races under his belt and was, therefore, perhaps overlooked in the betting.

To read the full article, please use the link below. 

Markets Review

The U.S. equity market continued its rebound, as the S&P 500 Index rose 8.74% during the quarter. However, the market rally has been remarkably concentrated, with just 25% of stocks outperforming the S&P 500 in the first 6-months of 2023. This makes it the narrowest market breadth in history for the first half of a year.1 Concurrently, the Bloomberg U.S. Aggregate Bond Index slightly declined, returning -0.84% for the quarter. In terms of style, the Russell 1000 Growth Index outperformed its value counterpart by 8.74%.

Sources: SS&C Advent, Bloomberg
Past performance is not indicative of future results. Aristotle Atlantic Focus Growth Composite returns are presented gross and net of investment advisory fees and include the reinvestment of all income. Gross returns will be reduced by fees and other expenses that may be incurred in the management of the account. Net returns are presented net of actual investment advisory fees and after the deduction of all trading expenses. Aristotle Atlantic Composite returns are preliminary pending final account reconciliation. Please see important disclosures at the end of this document.

Nine out of the eleven sectors within the Russell 1000 Growth Index finished higher for the quarter, with Information Technology, Communication Services and Consumer Discretionary gaining the most. Meanwhile, Energy, Real Estate and Consumer Staples were the worst-performing sectors.

Despite the positive trajectory of the market, economic data points were mixed. After expanding by 2.6% year-over-year in the fourth quarter of last year, growth in the U.S. slowed in the first quarter to 2.0% as private inventory investment and residential fixed investment declined. Nevertheless, personal consumption expenditures remained strong, increasing by 4.2% from last year. Meanwhile, inflation remained above its historical average of 3.8%, but the CPI continued to decline, as the figure fell from 4.9% to 4.0% for the 12-month periods ending in April and May, respectively. The moderation in prices was driven by a decline in the major energy component indexes. Lastly, the labor market remained tight, with unemployment at 3.7% in May.

In addition to economic data, lingering stress at regional banks, as well as political risk, came into focus during the period. Although significant efforts were previously made to provide stability to the U.S. banking system, the collapse of First Republic Bank, the largest banking failure since 2008, reignited concerns. However, the government quickly seized the bank and sold it to JPMorgan Chase, reassuring depositors. The government’s action, combined with minimal increases in default rates, resilient asset performance and loan growth, and stable deposits at other regional banks, eased fears surrounding the industry. Subsequently, attention turned to the approaching deadline to raise the federal debt ceiling. Concerns of a potential U.S. default mounted as the political parties refused to budge on concessions for a deal. After weeks of negotiations, an agreement was eventually reached to suspend the federal debt ceiling for two years while limiting the growth of federal discretionary spending during that same time span.

With the volatile and uncertain macroeconomic backdrop and continued pattern of disinflation, the Federal Reserve (Fed) held rates steady in June, marking the first pause after a ten-meeting hiking campaign that brought the benchmark rate to a range of 5.00% to 5.25%. The Federal Reserve Open Market Committee emphasized the need to account for the cumulative tightening of monetary policy and the lagging effects of monetary policy decisions, as well as other economic and financial developments, in order to determine whether additional policy firming would be needed to achieve the 2% goal for inflation.

On the corporate earnings front, S&P 500 companies reported a decline in earnings of 2.2%, the second straight quarter of a year-over-year decrease. However, results were better than initial expectations of a 6.7%2 decline, as companies referenced successful cost cutting, improved operational efficiency and waning inflationary pressures. Overall, 78% of S&P 500 companies exceeded EPS estimates (above the five-year average of 77%), and the number of companies mentioning inflation on earnings calls declined by over 12%.

Performance and Attribution Summary

For the second quarter of 2023, Aristotle Atlantic’s Focus Growth Composite posted a total return of 11.65% gross of fees (11.63% net of fees), underperforming the 12.81% total return of the Russell 1000 Growth Index.

Performance (%)2Q231 Year3 Years5 YearsSince Inception*
Focus Growth Composite (gross)11.6522.927.6011.7712.00
Focus Growth Composite (net)11.6322.807.5011.5311.74
Russell 1000 Growth Index12.8127.1113.7315.1314.72
*The Focus Growth Composite has an inception date of March 1, 2018. Past performance is not indicative of future results. Aristotle Atlantic Focus Growth Composite returns are presented gross and net of investment advisory fees and include the reinvestment of all income. Gross returns will be reduced by fees and other expenses that may be incurred in the management of the account. Net returns are presented net of actual investment advisory fees and after the deduction of all trading expenses. Aristotle Atlantic Composite returns are preliminary pending final account reconciliation. Please see important disclosures at the end of this document.

Sources: FactSet
Past performance is not indicative of future results. Attribution results are based on sector returns which are gross of investment advisory fees. Attribution is based on performance that is gross of investment advisory fees and includes the reinvestment of income. Please see important disclosures at the end of this document.

During the second quarter, the portfolio’s underperformance relative to the Russell 1000 Growth Index was due to allocation effects, while security selection contributed. Security selection in Financials, as well as overweights in Consumer Staples and Health Care, detracted the most from performance. Conversely, security selection in Information Technology and Consumer Discretionary, as well as an underweight in Industrials, contributed to relative results.

Contributors and Detractors for 2Q 2023

Relative ContributorsRelative Detractors
NvidiaMSCI
Guardant HealthDollar General
ServiceNowAdaptive Biotechnologies
AmazonPrologis
KLAVisa

Contributors

Nvidia

Nvidia contributed to outperformance, as the company benefits from increased demand for its Graphic Processing Unit (GPU) semiconductor systems used in accelerated computing that is used to power Artificial Intelligence (AI) and Large Language Models (LLM). The company reported strong first fiscal quarter 2024 results and issued guidance for the second quarter and fiscal year 2024 that was ahead of consensus due to continuing strong demand trends for its data center GPU systems.

Guardant Health

Guardant shares ended the quarter strong, recovering to some extent from the previous weakness in the quarter, as the company reported accelerating clinical volume growth and raised earnings guidance. In addition, the company announced additional U.S. commercial insurance coverage for their Guardant 360 test in the U.S. and government reimbursement in Japan. Lasty, the company completed a successful secondary offering, raising approximately $250 million. 

Detractors

Prologis

Prologis underperformed in the second quarter along with the real estate sector, as the appetite for risk in the broad market increased. Prologis’ results have shown less cyclicality during the recent downturn in the sector, so there is less scope for an earnings recovery as is the case in more beaten-down real estate companies. The company announced the acquisition of a 14 million square foot portfolio of industrial properties from Blackstone for $3.1 billion at the end of the second quarter. 

Adaptive Biotechnologies

Adaptive Biotechnology shares ended the quarter lower despite the company reporting a small revenue beat and accelerating clinical volumes. Clinical volumes rose 54% year-over-year in the quarter and grew 15% sequentially. The company is well-funded, and momentum is building in their minimal residual testing business. Additionally, the company’s drug development partner, Genetech, reported Food and Drug Administration’s (FDA) acceptance of an investigational new drug application on the collaboration’s first T-cell receptor-based therapy. The weakness during the quarter was most likely attributable to increasing interest rates and the negative implication of higher rates for emerging growth companies.    

Recent Portfolio Activity

The table below shows all buys and sells completed during the quarter, followed by a brief rationale.

BuysSells
NetflixDollar General
S&P GlobalMSCI

Buys

Netflix

Netflix is one of the leaders in streaming entertainment services that offers a broad selection of movies, TV series, documentaries and original content across numerous genres to its 223 million paid subscribers in over 190 countries. The company was initially founded as a DVD-by-mail service but has evolved into the world’s largest streaming-only platform and became one of the largest producers of original video content globally. Netflix offers a variety of subscription-only and ad-supported memberships, and its focus on original content and investment in technology to improve the user experience have enabled it to maintain a significant competitive advantage over streaming peers.

We initiated a position in Netflix and see new initiatives and further international expansion which can reaccelerate subscriber additions. The company recently introduced an advertising-supported membership plan that should enable it to augment revenue growth by tapping into the growing market for digital advertising while not cannibalizing its existing subscription-only plans. In addition, the company has recently implemented password-sharing restrictions, suggesting that the conversion of former password sharers to paying subscribers is tracking much better than expected. Netflix has led the transition from traditional linear TV to streaming and remains the dominant platform globally.

S&P Global

S&P Global provides financial information and analytics, including credit ratings, financial market benchmarks and workflow solutions. Originally McGraw-Hill Financial, the company changed its name in 2016. The company’s operations consist of five segments: ratings, commodity insights, indices, market intelligence and mobility.

We see S&P Global’s diversified business model as primarily subscription-based, which generates a sizeable recurring revenue stream and helps it navigate various market or macroeconomic environments. The company has a significant competitive advantage that provides substantial barriers to entry and sustainable competitive supremacy. We believe that technology-focused strategic investments made over the past few years should help accelerate organic growth over the next few years, as the company continuously seeks to improve its existing offerings while striving to meet ever-evolving client needs.

Sells

Dollar General

We sold our position in Dollar General, following a weaker-than-expected quarterly earnings report and a lowered earnings outlook. The company’s core consumer, while still employed, continues to be impacted by higher inflation. Additionally, we saw the negative impacts of lower-than-expected tax refunds and reductions in the Federal Supplemental Nutrition Assistance Program (SNAP). Dollar General remained committed to spending on customer experience and investing in price to help their customers through the tougher economic environment, as a result, reducing the earnings guidance by a greater amount than the sales reductions.

MSCI

We sold our position in MSCI, as its fast-growing ESG and Climate segment experienced a significant revenue growth deceleration in the most recently completed quarter, primarily driven by regulatory uncertainty in Europe and increasing anti-ESG sentiment in the U.S. However, the company remains well-positioned in the global ESG and Climate market long-term, but we feel S&P Global offers a more compelling opportunity currently.

Outlook

The equity markets in the second quarter were helped by a resilient economy that has been able to absorb an aggressive tightening cycle. There are segments of the economy, such as housing, that have bottomed out and started a recovery phase. This may complicate the Fed’s task of bringing down inflation and necessitate further rate hikes. One area that continues to garner attention is the commercial office real estate market. Cash flows on many commercial real estate properties will be challenged due to occupancy rates well below historical levels and the re-financing of debt at much higher levels. This may put a spotlight back on regional banks where many of these loans are held. On a positive note, AI has entered a new phase of significant investment. This has resulted in a build-up of computing power at many of the large technology companies. The result has been an equity market posting positive returns year-to-date but in a very narrow area of AI beneficiaries. A broadening out-of-equity market returns will depend on averting a recession. On the geopolitical front, the war in Ukraine has become more unstable with the recent turmoil within the Russian military. With many challenges to the economy, there are opportunities, as consumers have shifted to spending on services and the government enacted laws to get funding into areas, such as infrastructure, semiconductors and clean energy. Our focus remains at the company level, with an emphasis on seeking to invest in companies with secular tailwinds or strong product-driven cycles.

1 Source: Bank of America

2 Source: FactSet earnings insight

Disclosures

The opinions expressed herein are those of Aristotle Atlantic Partners, LLC (Aristotle Atlantic) and are subject to change without notice. Past performance is not a guarantee or indicator of future results. This material is not financial advice or an offer to purchase or sell any product. You should not assume that any of the securities transactions, sectors or holdings discussed in this report were or will be profitable, or that recommendations Aristotle Atlantic makes in the future will be profitable or equal the performance of the listed in this report. The portfolio characteristics shown relate to the Aristotle Atlantic Focus Growth strategy. Not every client’s account will have these characteristics. Aristotle Atlantic reserves the right to modify its current investment strategies and techniques based on changing market dynamics or client needs. There is no assurance that any securities discussed herein will remain in an account’s portfolio at the time you receive this report or that securities sold have not been repurchased. The securities discussed may not represent an account’s entire portfolio and, in the aggregate, may represent only a small percentage of an account’s portfolio holdings. The performance attribution presented is of a representative account from Aristotle Atlantic’s Focus Growth Composite. The representative account is a discretionary client account which was chosen to most closely reflect the investment style of the strategy. The criteria used for representative account selection is based on the account’s period of time under management and its similarity of holdings in relation to the strategy. Recommendations made in the last 12 months are available upon request. Returns are presented gross and net of investment advisory fees and include the reinvestment of all income. Gross returns will be reduced by fees and other expenses that may be incurred in the management of the account. Net returns are presented net of actual investment advisory fees and after the deduction of all trading expenses.

All investments carry a certain degree of risk, including the possible loss of principal. Investments are also subject to political, market, currency and regulatory risks or economic developments. International investments involve special risks that may in particular cause a loss in principal, including currency fluctuation, lower liquidity, different accounting methods and economic and political systems, and higher transaction costs. These risks typically are greater in emerging markets. Securities of small‐ and medium‐sized companies tend to have a shorter history of operations, be more volatile and less liquid. Value stocks can perform differently from the market as a whole and other types of stocks.

The material is provided for informational and/or educational purposes only and is not intended to be and should not be construed as investment, legal or tax advice and/or a legal opinion. Investors should consult their financial and tax adviser before making investments. The opinions referenced are as of the date of publication, may be modified due to changes in the market or economic conditions, and may not necessarily come to pass. Information and data presented has been developed internally and/or obtained from sources believed to be reliable. Aristotle Atlantic does not guarantee the accuracy, adequacy or completeness of such information.

Aristotle Atlantic Partners, LLC is an independent registered investment adviser under the Advisers Act of 1940, as amended. Registration does not imply a certain level of skill or training. More information about Aristotle Atlantic, including our investment strategies, fees and objectives, can be found in our Form ADV Part 2, which is available upon request.  AAP-2307-22

Performance Disclosures

Composite returns for all periods ended June 30, 2023 are preliminary pending final account reconciliation.

Past performance is not indicative of future results. Performance results for periods greater than one year have been annualized. Returns are presented gross and net of investment advisory fees and include the reinvestment of all income. Gross returns will be reduced by fees and other expenses that may be incurred in the management of the account. Net returns are presented net of actual investment advisory fees and after the deduction of all trading expenses.

Index Disclosures

The Russell 1000® Growth Index measures the performance of the large cap growth segment of the U.S. equity universe. It includes those Russell 1000 companies with higher price-to-book ratios and higher forecasted growth values. This index has been selected as the benchmark and is used for comparison purposes only. The Russell 1000® Value Index measures the performance of the large cap value segment of the U.S. equity universe. It includes those Russell 1000 companies with lower price-to-book ratios and lower expected growth values. The S&P 500® Index is the Standard & Poor’s Composite Index of 500 stocks and is a widely recognized, unmanaged index of common stock prices. The Russell 2000® Index measures the performance of the small cap segment of the U.S. equity universe. The Russell 2000 Index is a subset of the Russell 3000® Index representing approximately 10% of the total market capitalization of that index. It includes approximately 2,000 of the smallest securities based on a combination of their market cap and current index membership. The Dow Jones Industrial Average® is a price-weighted measure of 30 U.S. blue-chip companies. The Index covers all industries except transportation and utilities. The NASDAQ Composite Index measures all NASDAQ domestic and international based common type stocks listed on The NASDAQ Stock Market. The NASDAQ Composite includes over 3,000 companies, more than most other stock market indices. The Bloomberg U.S. Aggregate Bond Index is an unmanaged index of domestic investment grade bonds, including corporate, government and mortgage-backed securities. The WTI Crude Oil Index is a major trading classification of sweet light crude oil that serves as a major benchmark price for oil consumed in the United States. The 3-Month U.S. Treasury Bill is a short-term debt obligation backed by the U.S. Treasury Department with a maturity of three months.  The Consumer Price Index (CPI) is a measure of the average change over time in the prices paid by urban consumers for a market basket of consumer goods and services. While stock selection is not governed by quantitative rules, a stock typically is added only if the company has an excellent reputation, demonstrates sustained growth and is of interest to a large number of investors. The volatility (beta) of the Composite may be greater or less than its respective benchmarks. It is not possible to invest directly in these indices.


Markets Review

The U.S. equity market continued its rebound, as the S&P 500 Index rose 8.74% during the quarter. However, the market rally has been remarkably concentrated, with just 25% of stocks outperforming the S&P 500 in the first 6-months of 2023. This makes it the narrowest market breadth in history for the first half of a year.1 Concurrently, the Bloomberg U.S. Aggregate Bond Index slightly declined, returning -0.84% for the quarter. In terms of style, the Russell 1000 Growth Index outperformed its value counterpart by 8.74%.

On a sector basis, nine out of eleven sectors within the S&P 500 Index finished higher for the quarter, with Information Technology, Consumer Discretionary and Communication Services posting the largest gains. The worst performers were Utilities, Energy and Consumer Staples.

Sources: SS&C Advent, Bloomberg
Past performance is not indicative of future results. Aristotle Atlantic Core Equity Composite returns are presented gross and net of investment advisory fees and include the reinvestment of all income. Gross returns will be reduced by fees and other expenses that may be incurred in the management of the account. Net returns are presented net of actual investment advisory fees and after the deduction of all trading expenses. Aristotle Atlantic Composite returns are preliminary pending final account reconciliation. Please see important disclosures at the end of this document.

Despite the positive trajectory of the market, economic data points were mixed. After expanding by 2.6% year-over-year in the fourth quarter of last year, growth in the U.S. slowed in the first quarter to 2.0% as private inventory investment and residential fixed investment declined. Nevertheless, personal consumption expenditures remained strong, increasing by 4.2% from last year. Meanwhile, inflation remained above its historical average of 3.8%, but the CPI continued to decline, as the figure fell from 4.9% to 4.0% for the 12-month periods ending in April and May, respectively. The moderation in prices was driven by a decline in the major energy component indexes. Lastly, the labor market remained tight, with unemployment at 3.7% in May.

In addition to economic data, lingering stress at regional banks, as well as political risk, came into focus during the period. Although significant efforts were previously made to provide stability to the U.S. banking system, the collapse of First Republic Bank, the largest banking failure since 2008, reignited concerns. However, the government quickly seized the bank and sold it to JPMorgan Chase, reassuring depositors. The government’s action, combined with minimal increases in default rates, resilient asset performance and loan growth, and stable deposits at other regional banks, eased fears surrounding the industry. Subsequently, attention turned to the approaching deadline to raise the federal debt ceiling. Concerns of a potential U.S. default mounted as the political parties refused to budge on concessions for a deal. After weeks of negotiations, an agreement was eventually reached to suspend the federal debt ceiling for two years while limiting the growth of federal discretionary spending during that same time span.

With the volatile and uncertain macroeconomic backdrop and continued pattern of disinflation, the Federal Reserve (Fed) held rates steady in June, marking the first pause after a ten-meeting hiking campaign that brought the benchmark rate to a range of 5.00% to 5.25%. The Federal Reserve Open Market Committee emphasized the need to account for the cumulative tightening of monetary policy and the lagging effects of monetary policy decisions, as well as other economic and financial developments, in order to determine whether additional policy firming would be needed to achieve the 2% goal for inflation.

On the corporate earnings front, S&P 500 companies reported a decline in earnings of 2.2%, the second straight quarter of a year-over-year decrease. However, results were better than initial expectations of a 6.7%2 decline, as companies referenced successful cost cutting, improved operational efficiency and waning inflationary pressures. Overall, 78% of S&P 500 companies exceeded EPS estimates (above the five-year average of 77%), and the number of companies mentioning inflation on earnings calls declined by over 12%.

Performance and Attribution Summary

For the second quarter of 2023, Aristotle Atlantic’s Core Equity Composite posted a total return of 9.29 % gross of fees (9.18% net of fees), outperforming the S&P 500 Index, which recorded a total return of 8.74%.

Performance (%) 2Q231 Year3 Years5 Years7 YearsSince Inception*
Core Equity Composite (gross)9.2917.3011.9312.2613.8413.06
Core Equity Composite (net)9.1816.8311.4611.8013.3812.54
S&P 500 Index8.7419.5914.6012.3013.3812.41
*The Core Equity Composite has an inception date of August 1, 2013. Past performance is not indicative of future results. Aristotle Atlantic Core Equity Composite returns are presented gross and net of investment advisory fees and include the reinvestment of all income. Gross returns will be reduced by fees and other expenses that may be incurred in the management of the account. Net returns are presented net of actual investment advisory fees and after the deduction of all trading expenses. Aristotle Atlantic Composite returns are preliminary pending final account reconciliation. Please see important disclosures at the end of this document.

Source: FactSet
Past performance is not indicative of future results. Attribution results are based on sector returns which are gross of investment advisory fees. Attribution is based on performance that is gross of investment advisory fees and includes the reinvestment of income. Please see important disclosures at the end of this document.

During the second quarter, the portfolio’s outperformance relative to the S&P 500 Index was due to security selection and allocation effects. Security selection in Information Technology and Industrials, as well as an underweight in Energy, contributed the most to relative performance. Conversely, security selection in Health Care, Communication Services and Materials detracted from relative performance.

Contributors and Detractors for 2Q 2023

Relative ContributorsRelative Detractors
BroadcomAdaptive Biotechnologies
Guardant HealthCatalent
NVIDIAEstee Lauder
Chart IndustriesDollar General
MicrosoftThermo Fisher Scientific

Contributors

Broadcom

Broadcom contributed to outperformance, as the company is seen as a key beneficiary of the investment in generative Artificial Intelligence (AI) and Large Language Models (LLM). The company’s Application-Specific Integrated Circuit (ASIC) chips are being custom-built for customers to use in their data centers for accelerated computing. Broadcom’s networking chipsets are also expected to see increased levels of demand, as customers increase investments to enable the high-speed data transfer required by advanced AI training and inference. The company also announced a new multi-year supplier relationship with Apple, the company’s largest customer.

Guardant Health

Guardant shares ended the quarter strong, recovering to some extent from the previous weakness in the quarter, as the company reported accelerating clinical volume growth and raised earnings guidance. In addition, the company announced additional U.S. commercial insurance coverage for their Guardant 360 test in the U.S. and government reimbursement in Japan. Lasty, the company completed a successful secondary offering, raising approximately $250 million.

Detractors

Adaptive Biotechnologies

Adaptive Biotechnology shares ended the quarter lower despite the company reporting a small revenue beat and accelerating clinical volumes. Clinical volumes rose 54% year-over-year in the quarter and grew 15% sequentially. The company is well-funded, and momentum is building in their minimal residual testing business. Additionally, the company’s drug development partner, Genetech, reported Food and Drug Administration’s (FDA) acceptance of an investigational new drug application on the collaboration’s first T-cell receptor-based therapy. The weakness during the quarter was most likely attributable to increasing interest rates and the negative implication of higher rates for emerging growth companies.

Estee Lauder

Estee Lauder shares were weak during the second quarter, following an inline earnings report where Estee again pushed out the timing of a recovery in their travel retail business due to sluggish travel trends in China and an inventory overhand in that end market. Estee reduced fiscal 2023 earnings guidance again and pushed the timing of the recovery toward the end of this calendar year. Outside of travel retail, growth was solid in the Americas, Europe, APAC, Emerging Markets and China.

Recent Portfolio Activity

The table below shows all buys and sells completed during the quarter, followed by a brief rationale.

BuysSells
SynopsysCatalent
NetflixThe Walt Disney Company

Buys

Synopsys

Synopsys provides products and services used across the entire Silicon to Software™ spectrum to bring Smart Everything to life. From engineers creating advanced semiconductors to product teams developing advanced electronic systems to software developers seeking to ensure the security and quality of their code, its customers trust that its technologies will enable them to meet new requirements for low power as well as reliability, mobility and security.

We initiated a position in Synopsys, as we see the company to be a key beneficiary of the continued long-term growth in semiconductor systems for use in the automotive, mobile and communications infrastructure, data center, networking and AI end markets. The research and design requirements for these semiconductors continue to increase in complexity, and semiconductor companies will continue to leverage Synopsys’ design tools to enhance efficiencies and reduce the time and cost of the design and manufacturing cycle.

Netflix

Netflix is one of the leaders in streaming entertainment services that offers a broad selection of movies, TV series, documentaries and original content across numerous genres to its 223 million paid subscribers in over 190 countries. The company was initially founded as a DVD-by-mail service but has evolved into the world’s largest streaming-only platform and became one of the largest producers of original video content globally. Netflix offers a variety of subscription-only and ad-supported memberships, and its focus on original content and investment in technology to improve the user experience have enabled it to maintain a significant competitive advantage over streaming peers.

We initiated a position in Netflix and see new initiatives and further international expansion which can reaccelerate subscriber additions. The company recently introduced an advertising-supported membership plan that should enable it to augment revenue growth by tapping into the growing market for digital advertising while not cannibalizing its existing subscription-only plans. In addition, the company has recently implemented password-sharing restrictions, suggesting that the conversion of former password sharers to paying subscribers is tracking much better than expected. Netflix has led the transition from traditional linear TV to streaming and remains the dominant platform globally.

Sells

Catalent

We sold our position in Catalent, following an unexpected pre-announcement of productivity issues and high costs at three of their largest production facilities. This announcement came less than a month after Catalent provided a positive update at a broker conference. In addition, the CFO was replaced concurrent with this warning. Our concerns were with the ongoing execution, as during the previous quarter the company attempted to assure investors that quality was their number one priority. These additional issues raised competitive concerns, as other scale contract drug manufacturing companies were executing better. While rumors were in the marketplace that Catalent could be an acquisition target, we believe these most recent issues would lead a potential suitor to be more cautious, and we do not believe the fundamentals of the story warrant continued investment in the company. 

The Walt Disney Company

We sold our position in Disney, as the shift to streaming since the launch of Disney Plus nearly three years ago has been more challenging than expected. Overall company margins have declined, primarily driven by losses in the streaming segment, as Disney Plus strives to attract more subscribers. The focus on growth and profitability in streaming has come at the expense of reduced licensing revenues, as content shifts from the company’s traditional linear networks to Disney Plus. Additionally, Disney is going through this challenging transition amidst upheaval in senior management.

Outlook

The equity markets in the second quarter were helped by a resilient economy that has been able to absorb an aggressive tightening cycle. There are segments of the economy, such as housing, that have bottomed out and started a recovery phase. This may complicate the Fed’s task of bringing down inflation and necessitate further rate hikes. One area that continues to garner attention is the commercial office real estate market. Cash flows on many commercial real estate properties will be challenged due to occupancy rates well below historical levels and the re-financing of debt at much higher levels. This may put a spotlight back on regional banks where many of these loans are held. On a positive note, AI has entered a new phase of significant investment. This has resulted in a build-up of computing power at many of the large technology companies. The result has been an equity market posting positive returns year-to-date but in a very narrow area of AI beneficiaries. A broadening out-of-equity market returns will depend on averting a recession. On the geopolitical front, the war in Ukraine has become more unstable with the recent turmoil within the Russian military. With many challenges to the economy, there are opportunities, as consumers have shifted to spending on services and the government enacted laws to get funding into areas, such as infrastructure, semiconductors and clean energy. Our focus remains at the company level, with an emphasis on seeking to invest in companies with secular tailwinds or strong product-driven cycles.

1Source: Bank of America

2Source: FactSet earnings insight

Disclosures

The opinions expressed herein are those of Aristotle Atlantic Partners, LLC (Aristotle Atlantic) and are subject to change without notice. Past performance is not a guarantee or indicator of future results. This material is not financial advice or an offer to purchase or sell any product. You should not assume that any of the securities transactions, sectors or holdings discussed in this report were or will be profitable, or that recommendations Aristotle Atlantic makes in the future will be profitable or equal the performance of the securities listed in this report. The portfolio characteristics shown relate to the Aristotle Atlantic Core Equity strategy. Not every client’s account will have these characteristics. Aristotle Atlantic reserves the right to modify its current investment strategies and techniques based on changing market dynamics or client needs. There is no assurance that any securities discussed herein will remain in an account’s portfolio at the time you receive this report or that securities sold have not been repurchased. The securities discussed may not represent an account’s entire portfolio and, in the aggregate, may represent only a small percentage of an account’s portfolio holdings. The performance attribution presented is of a representative account from Aristotle Atlantic’s Core Equity Composite. The representative account is a discretionary client account which was chosen to most closely reflect the investment style of the strategy. The criteria used for representative account selection is based on the account’s period of time under management and its similarity of holdings in relation to the strategy. Recommendations made in the last 12 months are available upon request. Returns are presented gross and net of investment advisory fees and include the reinvestment of all income. Gross returns will be reduced by fees and other expenses that may be incurred in the management of the account. Net returns are presented net of actual investment advisory fees and after the deduction of all trading expenses.

All investments carry a certain degree of risk, including the possible loss of principal. Investments are also subject to political, market, currency and regulatory risks or economic developments. International investments involve special risks that may in particular cause a loss in principal, including currency fluctuation, lower liquidity, different accounting methods and economic and political systems, and higher transaction costs. These risks typically are greater in emerging markets. Securities of small‐ and medium‐sized companies tend to have a shorter history of operations, be more volatile and less liquid. Value stocks can perform differently from the market as a whole and other types of stocks.

The material is provided for informational and/or educational purposes only and is not intended to be and should not be construed as investment, legal or tax advice and/or a legal opinion. Investors should consult their financial and tax adviser before making investments. The opinions referenced are as of the date of publication, may be modified due to changes in the market or economic conditions, and may not necessarily come to pass. Information and data presented has been developed internally and/or obtained from sources believed to be reliable. Aristotle Atlantic does not guarantee the accuracy, adequacy or completeness of such information.

Aristotle Atlantic Partners, LLC is an independent registered investment adviser under the Advisers Act of 1940, as amended. Registration does not imply a certain level of skill or training. More information about Aristotle Atlantic, including our investment strategies, fees and objectives, can be found in our Form ADV Part 2, which is available upon request. AAP-2307-20

Performance Disclosures

Composite returns for all periods ended June 30, 2023 are preliminary pending final account reconciliation.

The Aristotle Core Equity Composite has an inception date of August 1, 2013 at a predecessor firm. During this time, Mr. Fitzpatrick had primary responsibility for managing the strategy. Performance starting November 1, 2016 was achieved at Aristotle Atlantic.

Past performance is not indicative of future results. Performance results for periods greater than one year have been annualized. Returns are presented gross and net of investment advisory fees and include the reinvestment of all income. Gross returns will be reduced by fees and other expenses that may be incurred in the management of the account. Net returns are presented net of actual investment advisory fees and after the deduction of all trading expenses.

Index Disclosures

The Russell 1000® Growth Index measures the performance of the large cap growth segment of the U.S. equity universe. It includes those Russell 1000 companies with higher price-to-book ratios and higher forecasted growth values. This index has been selected as the benchmark and is used for comparison purposes only. The Russell 1000® Value Index measures the performance of the large cap value segment of the U.S. equity universe. It includes those Russell 1000 companies with lower price-to-book ratios and lower expected growth values. The S&P 500® Index is the Standard & Poor’s Composite Index of 500 stocks and is a widely recognized, unmanaged index of common stock prices. The Russell 2000® Index measures the performance of the small cap segment of the U.S. equity universe. The Russell 2000 Index is a subset of the Russell 3000® Index representing approximately 10% of the total market capitalization of that index. It includes approximately 2,000 of the smallest securities based on a combination of their market cap and current index membership. The Dow Jones Industrial Average® is a price-weighted measure of 30 U.S. blue-chip companies. The Index covers all industries except transportation and utilities. The NASDAQ Composite Index measures all NASDAQ domestic and international based common type stocks listed on The NASDAQ Stock Market. The NASDAQ Composite includes over 3,000 companies, more than most other stock market indices. The Bloomberg U.S. Aggregate Bond Index is an unmanaged index of domestic investment grade bonds, including corporate, government and mortgage-backed securities. The WTI Crude Oil Index is a major trading classification of sweet light crude oil that serves as a major benchmark price for oil consumed in the United States. The 3-Month U.S. Treasury Bill is a short-term debt obligation backed by the U.S. Treasury Department with a maturity of three months.  The Consumer Price Index (CPI) is a measure of the average change over time in the prices paid by urban consumers for a market basket of consumer goods and services. While stock selection is not governed by quantitative rules, a stock typically is added only if the company has an excellent reputation, demonstrates sustained growth and is of interest to a large number of investors. The volatility (beta) of the Composite may be greater or less than its respective benchmarks. It is not possible to invest directly in these indices.

Markets Review

The U.S. equity market continued its rebound, as the S&P 500 Index rose 8.74% during the quarter. However, the market rally has been remarkably concentrated, with just 25% of stocks outperforming the S&P 500 in the first 6-months of 2023. This makes it the narrowest market breadth in history for the first half of a year.1 Concurrently, the Bloomberg U.S. Aggregate Bond Index slightly declined, returning -0.84% for the quarter. In terms of style, the Russell 1000 Growth Index outperformed its value counterpart by 8.74%.

Sources: SS&C Advent, Bloomberg
Past performance is not indicative of future results. Aristotle Atlantic Large Cap Growth Composite returns are presented gross and net of investment advisory fees and include the reinvestment of all income. Gross returns will be reduced by fees and other expenses that may be incurred in the management of the account. Net returns are presented net of actual investment advisory fees and after the deduction of all trading expenses. Aristotle Atlantic Composite returns are preliminary pending final account reconciliation. Please see important disclosures at the end of this document.

Nine out of the eleven sectors within the Russell 1000 Growth Index finished higher for the quarter, with Information Technology, Communication Services and Consumer Discretionary gaining the most. Meanwhile, Energy, Real Estate and Consumer Staples were the worst-performing sectors.

Despite the positive trajectory of the market, economic data points were mixed. After expanding by 2.6% year-over-year in the fourth quarter of last year, growth in the U.S. slowed in the first quarter to 2.0% as private inventory investment and residential fixed investment declined. Nevertheless, personal consumption expenditures remained strong, increasing by 4.2% from last year. Meanwhile, inflation remained above its historical average of 3.8%, but the CPI continued to decline, as the figure fell from 4.9% to 4.0% for the 12-month periods ending in April and May, respectively. The moderation in prices was driven by a decline in the major energy component indexes. Lastly, the labor market remained tight, with unemployment at 3.7% in May.

In addition to economic data, lingering stress at regional banks, as well as political risk, came into focus during the period. Although significant efforts were previously made to provide stability to the U.S. banking system, the collapse of First Republic Bank, the largest banking failure since 2008, reignited concerns. However, the government quickly seized the bank and sold it to JPMorgan Chase, reassuring depositors. The government’s action, combined with minimal increases in default rates, resilient asset performance and loan growth, and stable deposits at other regional banks, eased fears surrounding the industry. Subsequently, attention turned to the approaching deadline to raise the federal debt ceiling. Concerns of a potential U.S. default mounted as the political parties refused to budge on concessions for a deal. After weeks of negotiations, an agreement was eventually reached to suspend the federal debt ceiling for two years while limiting the growth of federal discretionary spending during that same time span.

With the volatile and uncertain macroeconomic backdrop and continued pattern of disinflation, the Federal Reserve (Fed) held rates steady in June, marking the first pause after a ten-meeting hiking campaign that brought the benchmark rate to a range of 5.00% to 5.25%. The Federal Reserve Open Market Committee emphasized the need to account for the cumulative tightening of monetary policy and the lagging effects of monetary policy decisions, as well as other economic and financial developments, in order to determine whether additional policy firming would be needed to achieve the 2% goal for inflation.

On the corporate earnings front, S&P 500 companies reported a decline in earnings of 2.2%, the second straight quarter of a year-over-year decrease. However, results were better than initial expectations of a 6.7%2 decline, as companies referenced successful cost cutting, improved operational efficiency and waning inflationary pressures. Overall, 78% of S&P 500 companies exceeded EPS estimates (above the five-year average of 77%), and the number of companies mentioning inflation on earnings calls declined by over 12%.

Performance and Attribution Summary

For the second quarter of 2023, Aristotle Atlantic’s Large Cap Growth Composite posted a total return of 13.28% gross of fees (13.19% net of fees), outperforming the 12.81% return of the Russell 1000 Growth Index.

Performance (%) 2Q231 Year3 Years5 YearsSince Inception*
Large Cap Growth Composite (gross)13.2823.849.7713.8016.57
Large Cap Growth Composite (net)13.1923.409.3613.3516.12
Russell 1000 Growth Index12.8127.1113.7315.1317.46

*The Large Cap Growth Composite has an inception date of November 1, 2016. Past performance is not indicative of future results. Aristotle Atlantic Large Cap Growth Equity Composite returns are presented gross and net of investment advisory fees and include the reinvestment of all income. Gross returns will be reduced by fees and other expenses that may be incurred in the management of the account. Net returns are presented net of actual investment advisory fees and after the deduction of all trading expenses. Aristotle Atlantic Composite returns are preliminary pending final account reconciliation. Please see important disclosures at the end of this document.

Sources: FactSet
Past performance is not indicative of future results. Attribution results are based on sector returns which are gross of investment advisory fees. Attribution is based on performance that is gross of investment advisory fees and includes the reinvestment of income. Please see important disclosures at the end of this document.

During the second quarter, the portfolio’s outperformance relative to the Russell 1000 Growth Index was due to security selection, while allocation effects modestly detracted. Security selection in Industrials, Information technology and Consumer Discretionary contributed the most to relative performance. Conversely, security selection and an overweight in Health Care, as well as security selection in Consumer Staples, detracted from relative returns.

Contributors and Detractors for 2Q 2023

Relative ContributorsRelative Detractors
NvidiaAdaptive Biotechnologies
Guardant HealthDollar General
Take-Two Interactive SoftwareThermo Fisher Scientific
ServiceNowEstee Lauder
Chart IndustriesTenable Holdings

Contributors

Nvidia

Nvidia contributed to outperformance, as the company benefits from increased demand for its Graphic Processing Unit (GPU) semiconductor systems used in accelerated computing that is used to power Artificial Intelligence (AI) and Large Language Models (LLM). The company reported strong first quarter 2024 results and issued guidance for the second quarter and fiscal year 2024 that was ahead of consensus due to continuing strong demand trends for its data center GPU systems.

Guardant Health

Guardant shares ended the quarter strong, recovering to some extent from the previous weakness in the quarter, as the company reported accelerating clinical volume growth and raised earnings guidance. In addition, the company announced additional U.S. commercial insurance coverage for their Guardant 360 test in the U.S. and government reimbursement in Japan. Lasty, the company completed a successful secondary offering, raising approximately $250 million.

Detractors

Adaptive Biotechnologies

Adaptive Biotechnology shares ended the quarter lower despite the company reporting a small revenue beat and accelerating clinical volumes. Clinical volumes rose 54% year-over-year in the quarter and grew 15% sequentially. The company is well-funded, and momentum is building in their minimal residual testing business. Additionally, the company’s drug development partner, Genetech, reported Food and Drug Administration’s (FDA) acceptance of an investigational new drug application on the collaboration’s first T-cell receptor-based therapy. The weakness during the quarter was most likely attributable to increasing interest rates and the negative implication of higher rates for emerging growth companies.

Thermo Fisher

Shares of Thermo Fisher were weak during the second quarter, following an inline earnings report where the company maintained full-year guidance. There were some concerns after the CEO referred to the guidance as ”ambitious” on the earnings call and concerns grew as several bioprocessing suppliers warned of sluggish sales. The company is more diversified than its peers; however, the warnings affected the entire life science and tools sector. In addition, the company conveyed a moderately more cautious tone on the most recent earnings call, stating that the macroeconomic backdrop was beginning to cause customers to exercise more caution. We believe Thermo Fisher is well-positioned to continue to gain market share.

Recent Portfolio Activity

The table below shows all buys and sells completed during the quarter, followed by a brief rationale.

BuysSells
NetflixDollar General
S&P GlobalMSCI

Buys

Netflix

Netflix is one of the leaders in streaming entertainment services that offers a broad selection of movies, TV series, documentaries and original content across numerous genres to its 223 million paid subscribers in over 190 countries. The company was initially founded as a DVD-by-mail service but has evolved into the world’s largest streaming-only platform and became one of the largest producers of original video content globally. Netflix offers a variety of subscription-only and ad-supported memberships, and its focus on original content and investment in technology to improve the user experience have enabled it to maintain a significant competitive advantage over streaming peers.

We initiated a position in Netflix and see new initiatives and further international expansion which can reaccelerate subscriber additions. The company recently introduced an advertising-supported membership plan that should enable it to augment revenue growth by tapping into the growing market for digital advertising while not cannibalizing its existing subscription-only plans. In addition, the company has recently implemented password-sharing restrictions, suggesting that the conversion of former password sharers to paying subscribers is tracking much better than expected. Netflix has led the transition from traditional linear TV to streaming and remains the dominant platform globally.

S&P Global

S&P Global provides financial information and analytics, including credit ratings, financial market benchmarks and workflow solutions. Originally McGraw-Hill Financial, the company changed its name in 2016. The company’s operations consist of five segments: ratings, commodity insights, indices, market intelligence, and mobility.

We see S&P Global’s diversified business model as primarily subscription-based, which generates a sizeable recurring revenue stream, and helps it navigate various market or macroeconomic environments. The company has a significant competitive advantage that provides substantial barriers to entry and sustainable competitive supremacy. We believe that technology-focused strategic investments made over the past few years should help accelerate organic growth over the next few years as the company continuously seeks to improve its existing offerings while striving to meet ever-evolving client needs.

Sells

Dollar General

We sold our position in Dollar General, following a weaker-than-expected quarterly earnings report and a lowered earnings outlook. The company’s core consumer, while still employed, continues to be impacted by higher inflation. Additionally, we saw the negative impacts of lower-than-expected tax refunds and reductions in the Federal Supplemental Nutrition Assistance Program (SNAP). Dollar General remained committed to spending on customer experience and investing in price to help their customers through the tougher economic environment, as a result, reducing the earnings guidance by a greater amount than the sales reductions.

MSCI

We sold our position in MSCI, as its fast-growing ESG and Climate segment experienced a significant revenue growth deceleration in the most recently completed quarter, primarily driven by regulatory uncertainty in Europe and increasing anti-ESG sentiment in the U.S. However, the company remains well-positioned in the global ESG and Climate market long-term, but we feel S&P Global offers a more compelling opportunity currently.

Outlook

The equity markets in the second quarter were helped by a resilient economy that has been able to absorb an aggressive tightening cycle. There are segments of the economy, such as housing, that have bottomed out and started a recovery phase. This may complicate the Fed’s task of bringing down inflation and necessitate further rate hikes. One area that continues to garner attention is the commercial office real estate market. Cash flows on many commercial real estate properties will be challenged due to occupancy rates well below historical levels and the re-financing of debt at much higher levels. This may put a spotlight back on regional banks where many of these loans are held. On a positive note, AI has entered a new phase of significant investment. This has resulted in a build-up of computing power at many of the large technology companies. The result has been an equity market posting positive returns year-to-date but in a very narrow area of AI beneficiaries. A broadening out-of-equity market returns will depend on averting a recession. On the geopolitical front, the war in Ukraine has become more unstable with the recent turmoil within the Russian military. With many challenges to the economy, there are opportunities, as consumers have shifted to spending on services and the government enacted laws to get funding into areas, such as infrastructure, semiconductors and clean energy. Our focus remains at the company level, with an emphasis on seeking to invest in companies with secular tailwinds or strong product-driven cycles.

1 Source: Bank of America

2 Source: FactSet earnings insight

Disclosures

The opinions expressed herein are those of Aristotle Atlantic Partners, LLC (Aristotle Atlantic) and are subject to change without notice. Past performance is not a guarantee or indicator of future results. This material is not financial advice or an offer to purchase or sell any product. You should not assume that any of the securities transactions, sectors or holdings discussed in this report were or will be profitable, or that recommendations Aristotle Atlantic makes in the future will be profitable or equal the performance of the securities listed in this report. The portfolio characteristics shown relate to the Aristotle Atlantic Large Cap Growth strategy. Not every client’s account will have these characteristics. Aristotle Atlantic reserves the right to modify its current investment strategies and techniques based on changing market dynamics or client needs. There is no assurance that any securities discussed herein will remain in an account’s portfolio at the time you receive this report or that securities sold have not been repurchased. The securities discussed may not represent an account’s entire portfolio and, in the aggregate, may represent only a small percentage of an account’s portfolio holdings. The performance attribution presented is of a representative account from Aristotle Atlantic’s Large Cap Growth Composite. The representative account is a discretionary client account which was chosen to most closely reflect the investment style of the strategy. The criteria used for representative account selection is based on the account’s period of time under management and its similarity of holdings in relation to the strategy. Recommendations made in the last 12 months are available upon request. Returns are presented gross and net of investment advisory fees and include the reinvestment of all income. Gross returns will be reduced by fees and other expenses that may be incurred in the management of the account. Net returns are presented net of actual investment advisory fees and after the deduction of all trading expenses.

All investments carry a certain degree of risk, including the possible loss of principal. Investments are also subject to political, market, currency and regulatory risks or economic developments. International investments involve special risks that may in particular cause a loss in principal, including currency fluctuation, lower liquidity, different accounting methods and economic and political systems, and higher transaction costs. These risks typically are greater in emerging markets. Securities of small‐ and medium‐sized companies tend to have a shorter history of operations, be more volatile and less liquid. Value stocks can perform differently from the market as a whole and other types of stocks.

The material is provided for informational and/or educational purposes only and is not intended to be and should not be construed as investment, legal or tax advice and/or a legal opinion. Investors should consult their financial and tax adviser before making investments. The opinions referenced are as of the date of publication, may be modified due to changes in the market or economic conditions, and may not necessarily come to pass. Information and data presented has been developed internally and/or obtained from sources believed to be reliable. Aristotle Atlantic does not guarantee the accuracy, adequacy or completeness of such information.

Aristotle Atlantic Partners, LLC is an independent registered investment adviser under the Advisers Act of 1940, as amended. Registration does not imply a certain level of skill or training. More information about Aristotle Atlantic, including our investment strategies, fees and objectives, can be found in our Form ADV Part 2, which is available upon request. AAP-2307-21

Performance Disclosure

Composite returns for all periods ended June 30, 2023 are preliminary pending final account reconciliation.

Past performance is not indicative of future results. Performance results for periods greater than one year have been annualized. Returns are presented gross and net of investment advisory fees and include the reinvestment of all income. Gross returns will be reduced by fees and other expenses that may be incurred in the management of the account. Net returns are presented net of actual investment advisory fees and after the deduction of all trading expenses.

Index Disclosure

The Russell 1000® Growth Index measures the performance of the large cap growth segment of the U.S. equity universe. It includes those Russell 1000 companies with higher price-to-book ratios and higher forecasted growth values. This index has been selected as the benchmark and is used for comparison purposes only. The Russell 1000® Value Index measures the performance of the large cap value segment of the U.S. equity universe. It includes those Russell 1000 companies with lower price-to-book ratios and lower expected growth values. The S&P 500® Index is the Standard & Poor’s Composite Index of 500 stocks and is a widely recognized, unmanaged index of common stock prices. The Russell 2000® Index measures the performance of the small cap segment of the U.S. equity universe. The Russell 2000 Index is a subset of the Russell 3000® Index representing approximately 10% of the total market capitalization of that index. It includes approximately 2,000 of the smallest securities based on a combination of their market cap and current index membership. The Dow Jones Industrial Average® is a price-weighted measure of 30 U.S. blue-chip companies. The Index covers all industries except transportation and utilities. The NASDAQ Composite Index measures all NASDAQ domestic and international based common type stocks listed on The NASDAQ Stock Market. The NASDAQ Composite includes over 3,000 companies, more than most other stock market indices. The Bloomberg U.S. Aggregate Bond Index is an unmanaged index of domestic investment grade bonds, including corporate, government and mortgage-backed securities. The WTI Crude Oil Index is a major trading classification of sweet light crude oil that serves as a major benchmark price for oil consumed in the United States. The 3-Month U.S. Treasury Bill is a short-term debt obligation backed by the U.S. Treasury Department with a maturity of three months.  The Consumer Price Index (CPI) is a measure of the average change over time in the prices paid by urban consumers for a market basket of consumer goods and services. While stock selection is not governed by quantitative rules, a stock typically is added only if the company has an excellent reputation, demonstrates sustained growth and is of interest to a large number of investors. The volatility (beta) of the Composite may be greater or less than its respective benchmarks. It is not possible to invest directly in these indices.
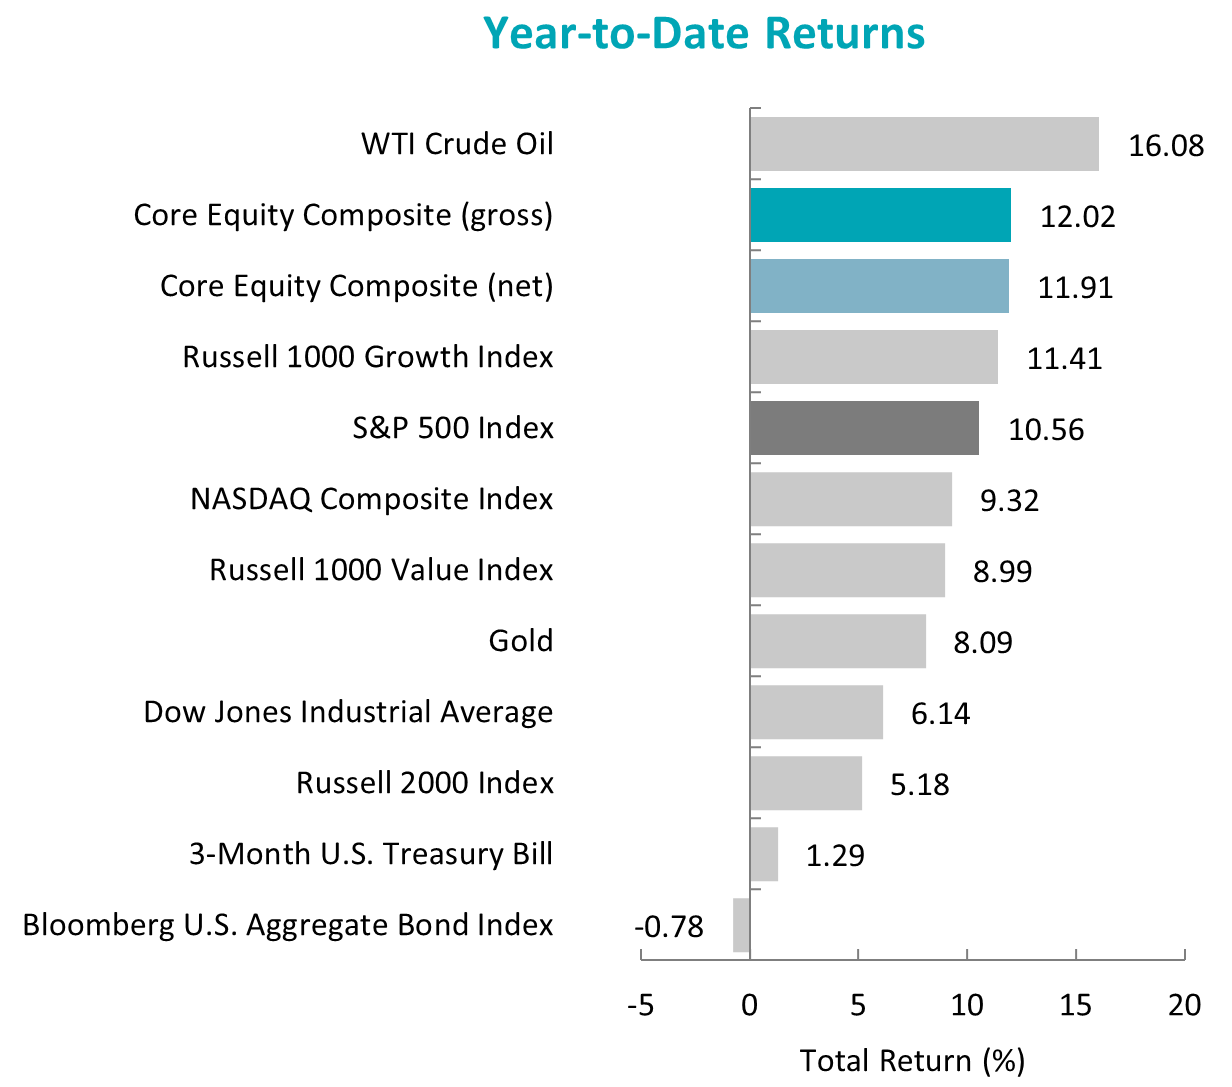
(All MSCI index returns are shown net and in U.S. dollars unless otherwise noted.)

Markets Review

Sources: SS&C Advent, Bloomberg
Past performance is not indicative of future results. Aristotle International Equity Composite returns are presented gross and net of investment advisory fees and include the reinvestment of all income. Gross returns will be reduced by fees and other expenses that may be incurred in the management of the account. Net returns are presented net of actual investment advisory fees and after the deduction of all trading expenses. Aristotle Capital Composite returns are preliminary pending final account reconciliation. Please see important disclosures at the end of this document.

Global equity markets continued to rally for the second quarter of the year, as the MSCI ACWI Index increased 6.18% during the period. Concurrently, the Bloomberg Global Aggregate Bond Index decreased 1.53%. In terms of style, growth stocks outperformed their value counterparts during the quarter, with the MSCI ACWI Growth Index beating the MSCI ACWI Value Index by 6.22%.

Regionally, North America and Japan were the strongest performers during the quarter. On the other hand, Latin America and Asia/Pacific ex-Japan were the weakest performers. On a sector basis, eight out of the eleven sectors within the MSCI ACWI Index posted gains, with Information Technology, Consumer Discretionary and Communication Services being the best performers. The worst performers were Materials, Utilities and Consumer Staples

Although the global economy continues to recover with improved supply-chain dynamics, lower food and energy costs, and resilient demand, the outlook remains uncertain as geopolitical tensions persist, China’s recovery underwhelms and global monetary policy decisions lead to unintended side effects. Correspondingly, the IMF slightly lowered its growth forecasts and now projects global growth to fall to 2.8% in 2023 from 3.4% in 2022, before settling at 3.0% in 2024.

In addition to the dampened outlook, elevated levels of inflation persisted, and progress toward disinflation was mixed on a regional basis. The U.S. and eurozone reported inflation of 4.0% and 6.1% in May, respectively, down from 4.9% and 7.0% in April. However, improvement in U.K. inflation stalled, and Japan’s index that excludes fuel rose 4.3 % in May from a year earlier, its highest mark in 42 years. Overall, the IMF increased its projection for global inflation to 7.0% from 6.6% for the year. Given the mixed inflation data, there was a wide range of central bank policy actions during the quarter. Central banks in some areas, including the eurozone and U.K., continued to increase rates to combat inflation. However, the U.S. Federal Reserve held rates steady in June after raising them in May, and the Bank of Japan maintained its highly accommodative stance.

Meanwhile, China cut the interest rate on its one-year medium-term lending facility as the country’s industrial output and retail sales growth missed forecasts. Despite the relaxation of the strict zero-COVID guidelines, sluggish demand, potential deflation and increased COVID cases have deterred a smooth recovery.

On the geopolitical front, tensions in Asia continued to build as the U.S. and Taiwan signed the U.S.-Taiwan Initiative on 21st Century Trade, which furthers trade interests between the two countries. However, the U.S. and China kept dialogue open, as U.S. Secretary of State Antony Blinken met with President Xi Jinping in Beijing. In Eastern Europe, Ukrainian troops initiated a counteroffensive intended to secure additional ground in eastern Ukraine. Western countries reaffirmed their support for Ukraine, as the U.S. committed an additional $1.3 billion of aid and the European Union offered €50 billion through 2027 to rebuild the nation.

Performance and Attribution Summary

For the second quarter of 2023, Aristotle Capital’s Global Equity Composite posted a total return of 5.40% gross of fees
(5.32% net of fees), underperforming the MSCI World Index, which returned 6.83%, and the MSCI ACWI Index, which returned 6.18%. Please refer to the table below for detailed performance.

Performance (%) 2Q23YTD1 Year3 Years5 Years10 Years Since Inception*
Global Equity Composite (gross)5.4011.8417.6112.249.1610.329.81
Global Equity Composite (net)5.3211.6717.2411.888.779.929.37
MSCI World Index (net)6.8315.0918.5112.189.079.509.31
MSCI ACWI Index (net)6.1813.9316.5310.998.108.758.38
*The inception date for the Global Equity Composite is November 1, 2010. Past performance is not indicative of future results. Aristotle Global Equity Composite returns are presented gross and net of investment advisory fees and include the reinvestment of all income. Gross returns will be reduced by fees and other expenses that may be incurred in the management of the account. Net returns are presented net of actual investment advisory fees and after the deduction of all trading expenses. Aristotle Capital Composite returns are preliminary pending final account reconciliation. Please see important disclosures at the end of this document.

Source: FactSet

Past performance is not indicative of future results. Attribution results are based on sector returns which are gross of investment advisory fees. Attribution is based on performance that is gross of investment advisory fees and includes the reinvestment of income.

From a sector perspective, the portfolio’s underperformance relative to the MSCI World Index can be primarily attributed to security selection, while allocation effects also had a slightly negative impact. Security selection in Information Technology and Industrials and an overweight in Materials detracted the most from the portfolio’s relative performance. Conversely, security selection in Energy, Materials and Health Care contributed to relative return.

Regionally, both allocation effects and security selection were responsible for the portfolio’s underperformance relative to the MSCI World Index. Security selection in Japan and North America detracted the most from relative performance, while security selection in Europe and our exposure in Emerging Markets contributed.

Contributors and Detractors for 2Q 2023

Relative ContributorsRelative Detractors
Martin Marietta MaterialsFMC
Norwegian Cruise Line HoldingsDSM-Firmenich
LennarAmgen
AdobeDanaher
CamecoQualcomm

DSM-Firmenich (DSM), previously known as Koninklijke DSM, a nutrition, health and ingredients company, was one of the largest detractors for the period. The company completed its merger with Firmenich International during the quarter. We expect that a successful integration of the two companies will further solidify DSM’s leading market position in health, nutrition, flavors and fragrances. DSM also completed the sale of its Engineering Materials business, culminating two decades of transitioning into a “pure-play” nutrition, health and ingredients company. Despite the milestone, the company continues to manage weak near-term market dynamics that have caused soft volumes across most of its segments, especially vitamins, and elevated levels of high-priced inventories. As is usually the case, we will be aware of such short-term headwinds but will focus our attention on ensuring fundamentals improve and catalysts realize over time.

Qualcomm, a leading wireless communications technology company, was one of the largest detractors for the period. Weaker demand for handsets, elevated channel inventory and an underwhelming Chinese economic recovery resulted in a more difficult-than-expected short-term outlook. Qualcomm executives are navigating the short-term challenges by actively managing operating expenses. In recent years, despite threats of large clients developing in-house chips (e.g., Apple and Samsung), Qualcomm has been able to retain its high market share forged by a history of high spending in R&D and what we consider to be technological superiority. Longer term, we believe Qualcomm will continue to benefit from 5G penetration, as well as from the execution of its diversification strategy, as Internet of Things and Automotive remain attractive end markets. As the world continues on the path toward a proliferation of connectivity between varying devices (e.g., smart phones, tablets, wearable technology, Wi-Fi access points, factory automation and infotainment systems in autos), we are convinced the company is in a strong position to continue to win market share in both existing and new end markets, and to continue to return FREE cash flow to shareholders.

Aggregates producer Martin Marietta Materials was the top contributor for the period. In 2022 the company’s share price declined as the sharp rise in energy costs resulted in lower profit margins. Despite cost pressures and a stock price decline, in our view, fundamentals remained intact. We outlined in a previous commentary our confidence in management’s ability to navigate short-term setbacks given the company’s leading market position, geographically advantaged asset base and pricing power. Since then, management’s “value-over-volume” commercial strategy, the institution of multiple price increases and an improved cost structure have led to robust margin expansion and record first quarter results. We remain optimistic about the firm’s strategic plan, which emphasizes responsible growth through acquisitions, reinvestment in existing operations and the consistent return of capital to shareholders.

Cameco, the world’s largest publicly traded uranium producer, was one of the top contributors during the period. Over the past year, there has been a rise in support from governments and policymakers for nuclear energy as countries realize it can play a crucial role in lowering dependence on fossil fuels to meet environmental pledges and goals. In addition, Russia’s war in Ukraine had led to an increase in the price of competing carbon fuels and heightened attention on energy security. Although such global market dynamics have likely favored Cameco in the short term, we believe the company will benefit long term from its financial discipline and advantaged assets. (Its Canadian mines—Cigar Lake and McArthur River/Key Lake—produce some of the world’s highest-grade uranium.) Cameco has also slowly ramped up production while obtaining long‐term contracts. As such, in 2022, Cameco signed a record number of long-term supply contracts and conversion services (where yellow cake is processed and readied for enrichment operations). This success has continued into 2023, with Cameco having recently secured an additional 12-year contract with Energoatom, Ukraine’s state-owned nuclear energy company, as well as a 10-year agreement with Bulgaria. Central and Eastern Europe are new markets for Cameco, and this supports our belief that the company is well-positioned to win new business in the regions that were historically dominated by Russia. Moreover, we look forward to Cameco’s planned acquisition of Westinghouse Electric Company (expected to close during the second half of 2023), as we believe Westinghouse’s market-leading downstream capabilities will align well with Cameco’s production and fuel services to offer a highly competitive nuclear fuel solution.

Recent Portfolio Activity

BuysSells
NoneNone

Consistent with our long-term horizon and low turnover, there were no new purchases or sales completed during the quarter.

Conclusion

At Aristotle Capital, we take a bottom-up approach to studying businesses. While macroeconomic factors such as inflation, monetary policy decisions and geopolitical conflicts may continue to dominate the current news cycle, we take a long-term perspective, attempting to identify, what we believe to be, high-quality companies that can successfully navigate periods of boom and bust.  We spend very little time attempting to predict the outcome of macro or geopolitical events but rather spend considerable time attempting to identify businesses that are resilient. In our view, the fundamentals of a business are the most important determinants of its long-term stock price performance. Consequently, we believe the best way to consistently add value for our clients is to maintain a long-term view and focus on deeply understanding individual companies’ key attributes, value drivers and progress toward improvement.

Disclosures

The opinions expressed herein are those of Aristotle Capital Management, LLC (Aristotle Capital) and are subject to change without notice. Past performance is not a guarantee or indicator of future results. This material is not financial advice or an offer to buy or sell any product. You should not assume that any of the securities transactions, sectors or holdings discussed in this report were or will be profitable, or that recommendations Aristotle Capital makes in the future will be profitable or equal the performance of the securities listed in this report. The portfolio characteristics shown relate to the Aristotle Global Equity strategy. Not every client’s account will have these characteristics. Aristotle Capital reserves the right to modify its current investment strategies and techniques based on changing market dynamics or client needs. There is no assurance that any securities discussed herein will remain in an account’s portfolio at the time you receive this report or that securities sold have not been repurchased. The securities discussed may not represent an account’s entire portfolio and, in the aggregate, may represent only a small percentage of an account’s portfolio holdings. The performance attribution presented is of a representative account from Aristotle Capital’s Global Equity Composite. The representative account is a discretionary client account which was chosen to most closely reflect the investment style of the strategy. The criteria used for representative account selection is based on the account’s period of time under management and its similarity of holdings in relation to the strategy. Recommendations made in the last 12 months are available upon request.

Returns are presented gross and net of investment advisory fees and include the reinvestment of all income. Gross returns will be reduced by fees and other expenses that may be incurred in the management of the account. Net returns are presented net of actual investment advisory fees and after the deduction of all trading expenses.

All investments carry a certain degree of risk, including the possible loss of principal. Investments are also subject to political, market, currency and regulatory risks or economic developments. International investments involve special risks that may in particular cause a loss in principal, including currency fluctuation, lower liquidity, different accounting methods and economic and political systems, and higher transaction costs. These risks typically are greater in emerging markets. Securities of small‐ and medium‐sized companies tend to have a shorter history of operations, be more volatile and less liquid. Value stocks can perform differently from the market as a whole and other types of stocks.

The material is provided for informational and/or educational purposes only and is not intended to be and should not be construed as investment, legal or tax advice and/or a legal opinion. Investors should consult their financial and tax adviser before making investments. The opinions referenced are as of the date of publication, may be modified due to changes in the market or economic conditions, and may not necessarily come to pass. Information and data presented has been developed internally and/orobtained from sources believed to be reliable. Aristotle Capital does not guarantee the accuracy, adequacy or completeness of such information.

Aristotle Capital Management, LLC is an independent investment adviser registered under the Investment Advisers Act of 1940, as amended. Registration does not imply a certain level of skill or training. More information about Aristotle Capital, including our investment strategies, fees and objectives, can be found in our Form ADV Part 2, which is available upon request. ACM-2307-73

Performance Disclosures

Composite returns for all periods ended June 30, 2023 are preliminary pending final account reconciliation.

The Aristotle Global Equity Composite has an inception date of November 1, 2010; however, the strategy initially began at Howard Gleicher’s predecessor firm in July 2007. A supplemental performance track record from January 1, 2008 through October 31, 2010 is provided on this page and complements the Global Equity Composite presentation that is located at the end of this presentation. The performance results were achieved while Mr. Gleicher managed the strategy at a prior firm. The returns are those of a publicly available mutual fund from the fund’s inception through Mr. Gleicher’s departure from the firm. During that time, Mr. Gleicher had primary responsibility for managing the fund.

Past performance is not indicative of future results. The information provided should not be considered financial advice or a recommendation to purchase or sell any particular security or product. Performance results for periods greater than one year have been annualized.

Returns are presented gross and net of investment advisory fees and include the reinvestment of all income. Gross returns will be reduced by fees and other expenses that may be incurred in the management of the account. Net returns are presented net of actual investment advisory fees and after the deduction of all trading expenses.

Index Disclosures

The MSCI World Index is a free float-adjusted market capitalization weighted index that is designed to measure the equity market performance of developed markets. The MSCI World Index consists of the following 23 developed market country indexes: Australia, Austria, Belgium, Canada, Denmark, Finland, France, Germany, Hong Kong, Ireland, Israel, Italy, Japan, Netherlands, New Zealand, Norway, Portugal, Singapore, Spain, Sweden, Switzerland, the United Kingdom and the United States. The MSCI Emerging Markets Index is a free float-adjusted market capitalization-weighted index that is designed to measure equity market performance of emerging markets. The MSCI Emerging Markets Index consists of the following 24 emerging market country indexes: Brazil, Chile, China, Colombia, Czech Republic, Egypt, Greece, Hungary, India, Indonesia, Korea, Kuwait, Malaysia, Mexico, Peru, Philippines, Poland, Qatar, Saudi Arabia, South Africa, Taiwan, Thailand, Turkey and United Arab Emirates. The MSCI ACWI captures large and mid-cap representation across 23 developed markets and 24 emerging markets countries. With approximately 3,000 constituents, the Index covers approximately 85% of the global investable equity opportunity set. The MSCI ACWI Growth Index captures large and mid-cap securities exhibiting overall growth style characteristics across 23 developed markets countries and 24 emerging markets countries. The MSCI ACWI Value Index captures large and mid-cap securities exhibiting overall value style characteristics across 23 developed markets countries and 24 emerging markets countries. The MSCI Europe Index captures large and mid-cap representation across 15 developed markets countries in Europe. With more than 400 constituents, the Index covers approximately 85% of the free float-adjusted market capitalization across the European developed markets equity universe. The MSCI Japan Index is designed to measure the performance of the large and mid-cap segments of the Japanese market. With approximately 250 constituents, the Index covers approximately 85% of the free float-adjusted market capitalization in Japan. The S&P 500® Index is the Standard & Poor’s Composite Index of 500 stocks and is a widely recognized, unmanaged index of common stock prices. The NYSE FAANG+ Index is an equal-dollar-weighted index designed to represent a segment of the Information Technology and Consumer Discretionary sectors consisting of highly traded growth stocks of technology and tech-enabled companies, such as Facebook, Apple, Amazon, Netflix and Alphabet’s Google. The Bloomberg Global Aggregate Bond Index is a flagship measure of global investment grade debt from 28 local currency markets. This multi-currency benchmark includes Treasury, government-related, corporate and securitized fixed rate bonds from both developed and emerging markets issuers. The Brent Crude Oil Index is a major trading classification of sweet light crude oil that serves as a major benchmark price for purchases of oil worldwide. The volatility (beta) of the Composite may be greater or less than the benchmarks. It is not possible to invest directly in these indexes.