Alex Warren: The term Aristotle is used to represent a family of affiliates, which is comprised of Aristotle Capital Management, Aristotle Capital Boston, Aristotle Credit Partners, and Aristotle Atlantic Partners, which collectively operate under a unified platform known as Aristotle. Each firm is an independent investment advisor registered under the Investment Advisors Act of 1940, as amended.
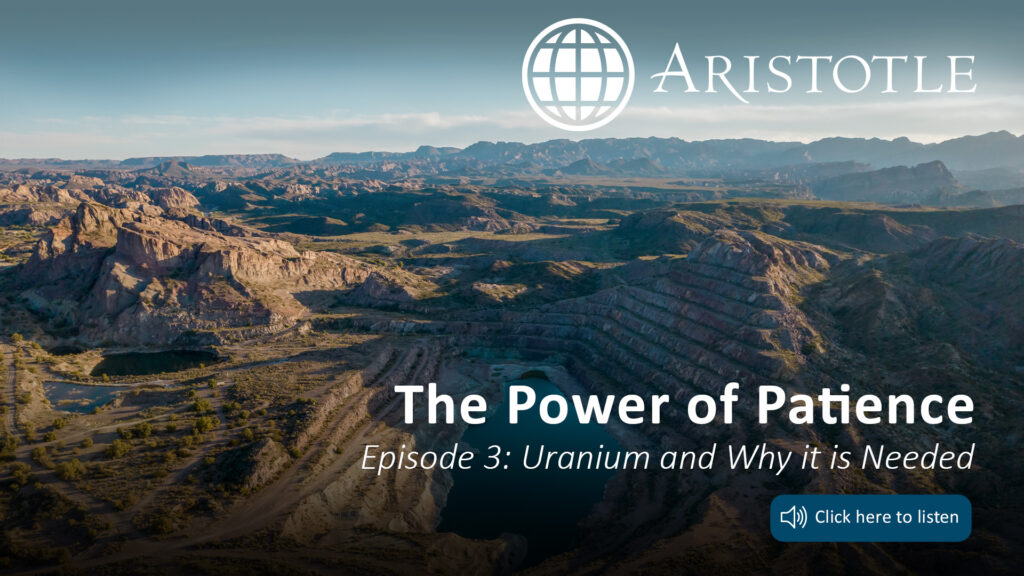
Catalina Llinás: Welcome to the Power of Patience, Aristotle’s podcast, where we cover different topics of interest. I’m Catalina Llinás, Co-Chief Investment Officer of Aristotle Capital, and I will be your host today. In today’s episode, we’re going to be learning about uranium. What is it used for? Why is it important for nuclear energy? We’re also going to talk about fear surrounding nuclear energy, and why we think this is an important source of clean energy for the world. So for this, I will be speaking with Alberto Jimenez Crespo. Alberto is a senior member of Aristotle Capital’s investment team. His experience includes being a portfolio manager, also a research analyst. Welcome to the episode. It’s great having you here, Alberto.
Alberto Jimenez Crespo: Thank you for having me, Catalina. It’s great to be here.
Catalina Llinás: Why don’t you tell us a little bit about yourself?
Alberto Jimenez Crespo: Well first, I’m from Spain, that’s where I grew up. My technical background relevant to what I think we’re going to talk about today is that I am a mining engineer, and I have a Master’s in Colorado School of Mines as well. For those of you who might not be familiar with natural resources, think of Colorado School of Mines as the Harvard of rocks.
Catalina Llinás: Oh, Harvard of rocks.
Alberto Jimenez Crespo: So, I’m very happy that you chose this topic, because uranium is actually a very different commodity. It’s a very differentiated industry.
Catalina Llinás: Well, great. So why don’t we start with that? What is uranium?
Alberto Jimenez Crespo: So, uranium is a … Think of a silvery white metal. If you imagine an element that is very dense, think of lead. I think we are all familiar with lead. Well, uranium would be 70% denser than that. So, the feature that is also very unique is that it is the only naturally occurring fissile element on Earth. So, what does that mean? It means that it’s a material capable of sustaining a chain reaction of nuclear fission. That is very important to what we’re going to talk about today. Even though it’s pretty much everywhere, think of that in your soil and water and your house and everywhere, typically it occurs in higher concentrations in the mineral, it’s called uraninite, and so the majority of the isotopes of uranium, what we call U-238, call it 99.3% of the world uranium, occurs in this isotope.
Catalina Llinás: So, there’s uranium everywhere, but the one we’re going to talk about is, what, 0.7% of that uranium is the one that is relevant for our discussion today?
Alberto Jimenez Crespo: Yeah, yeah. Good point. So much for rounding. If it wasn’t for that 0.7%, that is really what we called U-235, we wouldn’t be talking today. The life as we know it, it would just not exist. It would not be possible. So that is really the importance of that huge minority of the 0.7%.
Catalina Llinás: So, what is this U-235, we’re just going to call uranium, what is it used for?
Alberto Jimenez Crespo: The only significant commercial use of uranium is really to power nuclear plants, so the generation of electricity. There’re about 427 reactors globally today, and 56 or so are under construction. If you drive throughout California, you wouldn’t think that this is such a growing industry because you will not see any. In fact, in the U.S. we’ve been shutting down some of our reactors. But if you travel throughout Asia, the Middle East and some other parts of the world, you will see that there is a recognition which is growing, that nuclear role is really a must when it comes to providing safe, affordable, carbon-free, base load, reliable electricity. And that is a key word, reliable. So, despite all these massive investments that we’ve seen, including in the U.S., in clean energies renewables, in the last, call it 15 years, the reality is that about 85% of global electricity grid is run by carbon emitting sources of thermal power. We have a huge work to do in order to diversify away from that.
Catalina Llinás: So before we get too much into the discussion of nuclear, which we will, why don’t you tell us a little bit about where is this uranium found? Where can we find some of that uranium?
Alberto Jimenez Crespo: Yeah. For the purpose of commercial use, that’s what they call a mining ore grade uranium, there are only three countries that you can go to. That is Australia, Kazakhstan and Canada. If you think of high grade deposits, those will be deposits that will provide uranium with a very low cost. There’s only one country, which is Canada. If you’re looking for high-grade deposits, that’s where you have to go. Then the interesting thing about this industry is that it’s highly consolidated. There’re only eight companies that provide, call it 83% of the global supply. So, everybody’s familiar with, or many people are familiar with the OPEC in oil and gas. So, this is significantly more consolidated than that.
Catalina Llinás: So those operators will have mines that… The same operator may have mines in Kazakhstan, Australian and Canada, right? They diversify that way I guess, geographically?
Alberto Jimenez Crespo: Yeah. Yeah.
Catalina Llinás: Have you been to a uranium mine?
Alberto Jimenez Crespo: Yeah, I’ve been actually in the three countries. In Kazakhstan, I was being chased by a sandstorm, so as we landed in Almaty and we had to go to visit the engineers in the uranium field, that’s the first time I’ve been chased by a sandstorm. It was not fun, but it was exciting.
Catalina Llinás: Something to be able to tell a story about. Going back to the topic, I do remember in some of our investment meetings, you were once talking about that there was a mismatch between where the uranium that is produced and where the uranium is going to be consumed. Why don’t you tell us a little bit about that?
Alberto Jimenez Crespo: Yeah, that’s a good point because this is a very strategic commodity as you can imagine. You cannot just buy this in the futures market just like you would trade orange juice or copper or any other commodity. Yeah, believe me, there will not be delivery. So don’t go to Amazon and try to order uranium. It will not come. That I guarantee.
Catalina Llinás: No, hopefully not.
Alberto Jimenez Crespo: So, 80% or so of the production, it’s in the hands of state-owned enterprises. This is very strategic. You’re right, the mismatch in the planet is very significant in that 70% or so comes from countries that have very little consumption because they have no nuclear plants, while 90% of the consumption comes from countries with very little production, including the United States.
Catalina Llinás: Interesting. So how is uranium mined?
Alberto Jimenez Crespo: Yeah, so there are mainly three ways. Now, once the orebody is discovered by and defined by exploration, which takes a while, up until the ’80s, the 1980s, the main way was what we call open-pit mining, which is a hole in the ground. As geological properties change, underground mining is being used when the ore is too deep, so it doesn’t make sense economically to open-pit. But most recently, in the last two decades, the majority of the uranium more so is coming from what’s called in-situ recovery. What that is, is that you have a hole that is drilled into the ore, and then a solution is used to dissolve that uranium, then you pump it up to the surface. Think of this as a commodity that has to be processed. You cannot just bring it up to the surface and then ship it to the nuclear reactor. You have to go through three main processes. The first one would be, call it the mining, then you mill it. You crush it and you add some chemicals. That’s what you will probably hear in the movies when they talk about yellowcake, or in the media. It is really not scary, and it is not something that is dangerous. It’s just a yellow-colored powder, and there’s not much you can do with it. It sounds pretty scary when you think of, oh, it has yellowcake, it’s not really a big deal. But then in order for you to be able to start thinking of utilizing this powder, you have to transform it into a gas, what’s called uranium hexafluoride, or UF6. That will be brought to the enrichment facilities. This is a very key part of the value chain. It’s probably the highest buyers of entry business in the world. This is very secretive. You cannot just copy the blueprints or you go to YouTube. You know how everybody now goes to YouTube to get things done and say, “How do I build an enrichment machine?” No, you cannot do that. It’s very secretive. It is very strategic, and there are very few facilities around the world. So, if you really have an enrichment plant, it is a very hard business to replicate. Once you take it there, the reason why enrichment is needed is that the majority of the reactors around the world is what we call light-water reactors. Those are the majority that you’re going to see, certainly in the United States. They require, remember we talked about U-35 earlier, that 0.7%?
Catalina Llinás: Yep.
Alberto Jimenez Crespo: Okay, so you need about 3 to 5% concentration of U-235 in order to use that into a reactor. But then by nature, you only get 0.7% concentration. So, you have to spin it into these machines to bring up the concentration. That’s what enrichment is. Finally, the last part of the process is, you form these pellets of uranium that have massive energy density, put them in a tube made of zirconium, create like a tower, and that’s what you ship to the nuclear reactor. You probably fuel the reactor twice a year. So, this is a very efficient way of generating energy.
Catalina Llinás: When you were talking about the yellowcake, that didn’t sound so scary, but as you kept talking more and more about this enrichment, I do have to say that sounds a little bit scary. So maybe that’s a good segue. People have strong opinions about nuclear energy, nuclear plants. It sounds scary. People don’t want to have it next to their homes. Also, people have flashbacks of more recent images like what happened in Fukushima, but also back in the day with the Chernobyl nuclear disaster and accident. So, tell us what you think about that and whether those concerns, are those real concerns, should they be?
Alberto Jimenez Crespo: Yeah, you’re right. Nuclear radiation freaks people out. It’s just something you can’t see. We’ve been shaped, our opinions, into having a lot of fear about this. Yeah, if you talk to environmental groups and people that are drafting energy policy, you’ll see that they feed into people’s emotions. What that has created, in our opinion, is that there’s a big gap between perception and reality. We find that there’s a significant, embedded biases in the thinking of people, particularly when these debates occur in public about what you just mentioned, about the issue of radioactivity and whether nuclear energy is safe or not. So, we at Aristotle like to do our own research, our own independent analysis, and we try to stay away from psychological biases that might create what we call blind spots, and that can impair your judgment. So, that’s what we’ve done in this case as well. What we found is that the reality is that natural substances contain some form of radioactive material, whether you like it or not. Soil, rocks, rivers and oceans. Since we are in LA, think about Catalina, think about your backyard. Every time you’re going to go and do a barbecue or whatever, you can tell your friends there, next time try this, that they’re going to be on top of few hundred grams of uranium. So, you could think of your backyard being slightly radioactive, but that shouldn’t scare you because, call it 80% or so of all the ionizing radiation that people are exposed to, you and I, everybody are exposed to, occurs naturally.
Catalina Llinás: Really? No, no me lo puedo crear, radiación en el jardin [Translation: I can’t believe it, radiation in the garden]. We have radiation in the backyard? I’m not scared about that radiation. I’m scared about then the other 20%.
Alberto Jimenez Crespo: Yes, there’s this whole notion about artificial radiation, as you know, and that is radiation that we have created. But there’s huge benefits to humanity that we have to think about. How so? Well in medicine, if you think about diagnostics, treatment and research, agriculture, food preservation, manufacturing engines, think about radioactive tracers also help analyze pollutants. If you talk to archeologists, paleontologists, people running a museum, consumer products, for example, in smoke detectors, I’m sure you have smoke detection in your house, right? They will not insure your house if you don’t. So, you cannot exclude that from the system. You cannot have the lives that we have today and function without these forms of artificial radiation.
Catalina Llinás: I’m going to keep pushing back a little bit because I get that, and also if I have to get an x-ray, fine, I’ll get some radiation. But that’s different from radiation of a nuclear plant. I would guess that if I had a nuclear plant two miles from my house, I would probably be concerned about that radiation on my family and not so much about the x-ray or when I have to go to the dentist and get an x-ray.
Alberto Jimenez Crespo: Good point. Let’s say you include all the military testing and all the accidents that we have in the nuclear industry, it accounts for 1% of all the radiation people are routinely exposed to. In fact, if you were to think about the nuclear fuel cycle, which is what we’re talking about here, it only accounts for 0.01% of the total radiation. So, the main issue that every policymaker should be thinking as in a society, is that whether we like it or not today, call it 37%, almost 40% of the global electricity that we’re consuming is coming from coal. A lot of my friends think, oh, well, isn’t that coal something from the Middle Ages and something from the past, while there’s so much coal that we are consuming in today’s world. So why is that an issue? Well, first because it kills a lot of people. If we think about the WHO as a source, World Health Organization, they claim that pollution related sicknesses kill over 7 million people a year. Think about it. In the life of a nuclear reactor, call it a few decades, you’re just killing a whole country, a big country. It’s just huge. We cannot operate like that, killing so many people.
Catalina Llinás: A nuclear accident is very, very rare, is what you’re saying?
Alberto Jimenez Crespo: Very rare.
Catalina Llinás: Of course, we don’t want to diminish what those cause, but it’s extremely rare. The pollution generated by coal, it’s much more deadly. I guess that gets us to the climate change. When we talk about nuclear as being part of the solution, it has to be part of the solution in order to help with climate change.
Alberto Jimenez Crespo: Yes, you’re right. We don’t want to downplay any loss of life. What we want to do is we want to prevent massive losses of life with the technology that we do have today. So according to the IEA, the International Energy Agency, they know this. They’re projecting that we will need to double the world’s nuclear output by 2050 to reach the net zero energy targets that every government now is talking about. As much as we have invested massively into renewables, particularly in the last 15 years, it’s been very significant, and that’s all good, but that cannot be the only solution. The resources that are needed, the land, the unreliability, the investments in grid that we need to support that. Any way you analyze this issue, you’re going to come out with the conclusion that nuclear is a must. We have to have that into the power mix. One statistic that I think is interesting is that since I was born in the 1970s, is that if we were to replace all the coal fire plants, dirty plants we were talking about earlier, with nuclear, we will reduce the CO2 emissions back to the level when I was born. So that’s like going back to the world when I was a baby. I think that’s just wonderful. So, we should be embracing anything that has to do with lowering the carbon footprint in their climate.
Catalina Llinás: It’s interesting that you were saying, yes, a lot of countries have come out with their plans for net zero. So, you would think then that, and there is currently under construction, there are nuclear plants around the world that are being constructed. Why has the price of uranium then been so low for so long? For a while it was very low.
Alberto Jimenez Crespo: That is a good point. You would think that with all the stuff that we’ve talked about today, all the attributes and all the benefits and all these things, that in the last 14 years though it seems we’ve seen a massive amount of liquidity pumped into the financial markets. We would’ve seen massive investments into making sure that we have enough investment in the supply chain in nuclear. The opposite has been the case, unfortunately. If I gave you an energy option, think about, let’s just visualize this for a second, for the energy density of what we’re talking about here. Think about 0.24 ounces of pellet. Many people say, “What does that mean, 0.24 ounces?” So, think about the tip of your nail and the energy provided by that pellet from uranium will be equivalent to 2000 pounds of coal. So, with that sort of magic and energy transformation, you will think that we would’ve been all very excited, and to your point, uranium price would’ve gone to the moon and we would be talking about a booming industry in terms of investments. Let me give you this, a statistic that will convince you that the opposite has occurred. Over the last five years, the nuclear reactors around the world, they have consumed 800 million pounds. We know that because if you own a nuclear reactor, you’re a utility company, you don’t purchase this on a spot market. This is a very sensitive thing for your chain. You have to contract this from the miners. So, the book of business is transparent, and you can see the material. We know that. So, they have consumed 800 million pounds, and guess what? They only contracted 400. So going forward, there’s a gap between what they need, because you don’t shut down a nuclear plant, this is based on 24 hours, between what they need and what they have in their books. If you go to 2035, it’s 1.4 billion pounds of unsecure material that they need. Think of an industry of 160 million pounds. That’s what 800 divided by five is, 160 million pounds consumption per year. With a gap of 1.4 billion pounds, it’s huge. So why is this an issue? Because it cannot be solved short term. Normally if you talk to mining engineers, you’re going to see that the average life of a mine is about 16 years from discovery to production. For uranium, as you could imagine, being more difficult, more regulated, more strategic, it’s at least two decades. So, we should be investing, to your point, massively into this now, but we’re not. That, to me, is the big gap and the big opportunity.
Catalina Llinás: Alberto, I have one last question that would be. Does Aristotle invest in this industry that we’ve talked about today?
Alberto Jimenez Crespo: Yes, we do. In our portfolios, we have exposure to the uranium industry, and we specifically invested in a company that have what we believe to be a sustainable, long-term competitive advantage.
Catalina Llinás: Thank you, Alberto. This was very interesting. I think this concludes our episode for today. I’m sure we will have some follow-up questions as there’s so much to learn about the world of uranium, the world of nuclear, and at Aristotle, we’ll continue to understand these industries and all other sources of clean energy. We’ll do that with a long-term perspective as we always do. Thank you, Alberto. This has been very interesting. We appreciate you joining.
Alberto Jimenez Crespo: Thank you for having me.
Catalina Llinás: We appreciate your time. Thank you.
Alex Warren: We hope you’ve enjoyed this episode and learned more about Aristotle. Thank you for listening to the Power of Patience. To learn more about Aristotle, please visit www.aristotlecap.com or follow the link in the show notes. If you enjoyed this episode, please rate and review us on Spotify and Apple Podcast. Come back next time for discussion on cybersecurity with Nick Daft, Director and Senior Research Analyst at Aristotle Atlantic Partners. Until then, on behalf of Aristotle, thank you for listening.