Markets Review
Sources: CAPS CompositeHubTM, Bloomberg
Past performance is not indicative of future results. Aristotle Value Equity Composite returns are presented gross and net of investment advisory fees and include the reinvestment of all income. Gross returns will be reduced by fees and other expenses that may be incurred in the management of the account. Net returns are presented net of actual investment advisory fees and after the deduction of all trading expenses. Aristotle Capital Composite returns are preliminary pending final account reconciliation. Please see important disclosures at the end of this document.
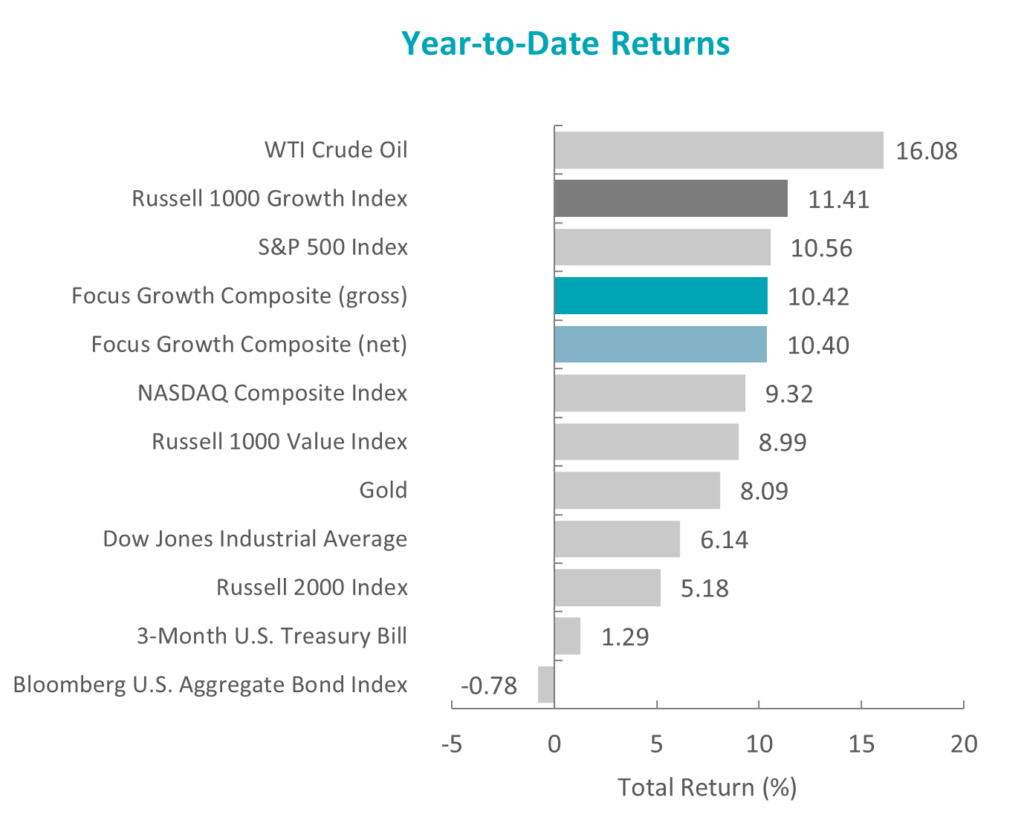
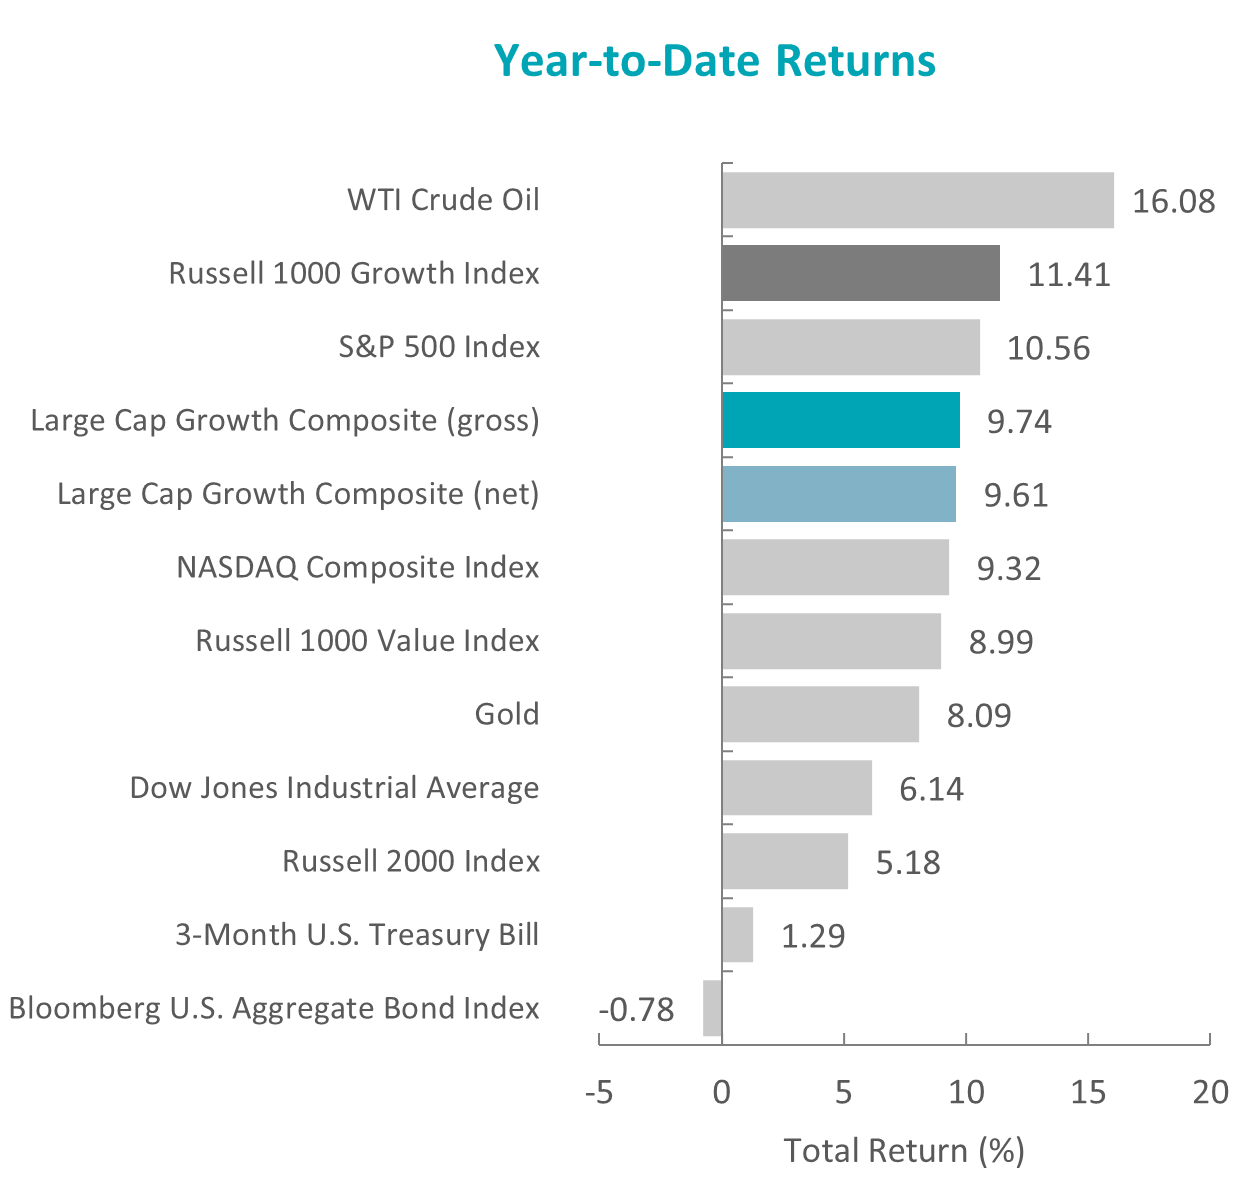
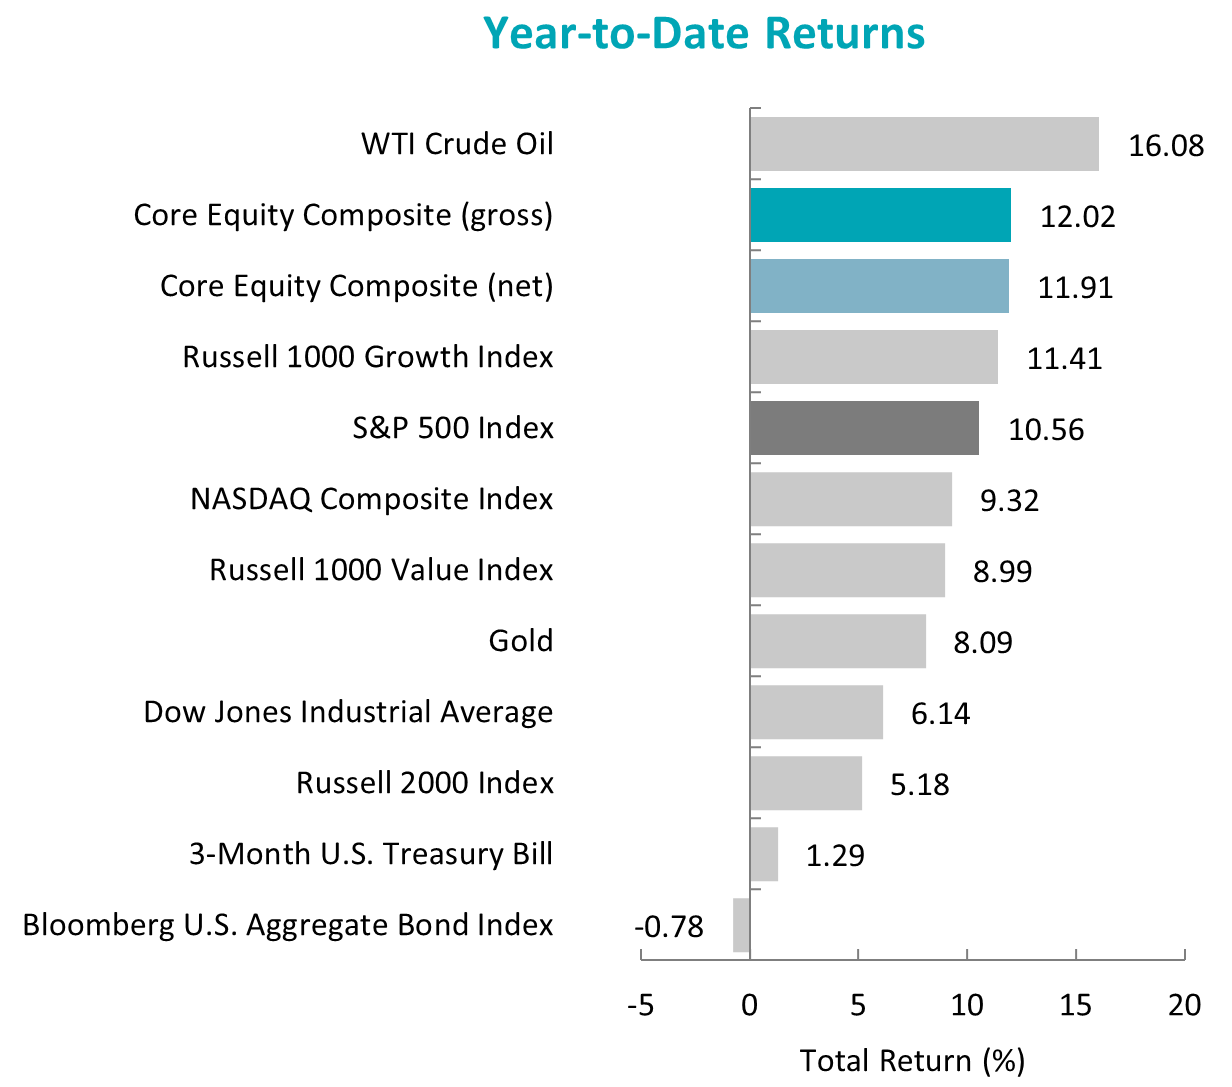
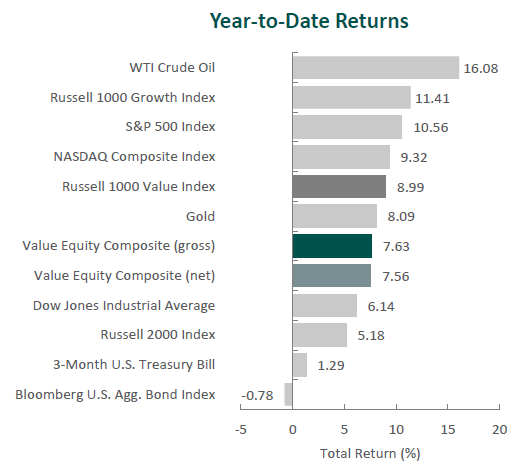
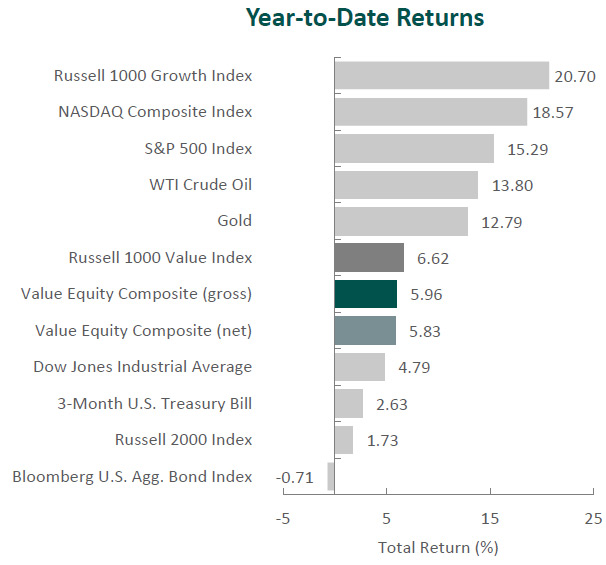
The U.S. equity market achieved record highs, as the S&P 500 Index rose 4.28% during the period. Gains were once again driven by the “Magnificent 7.” This narrow group of stocks was responsible for all of the S&P 500’s return during the quarter. Concurrently, the Bloomberg U.S. Aggregate Bond Index returned 0.07% for the quarter. In terms of style, the Russell 1000 Value Index underperformed its growth counterpart by 10.50%.
The performance of the Russell 1000 Value Index was also weak in absolute terms, with nine out of the eleven sectors recording losses. Consumer Discretionary, Health Care and Materials were the worst-performing sectors. Meanwhile, Utilities, Consumer Staples and Information Technology were the best.
Data released during the period showed that U.S. economic growth slowed to an annual rate of 1.4% in the first quarter from 3.4% in the last quarter of 2023, as consumer spending, exports and government spending decelerated. Meanwhile, CPI inflation rose at an annual rate of 3.4% in April and 3.3% in May. This combination of sluggish economic growth and persistent inflation raised concerns about potential stagflation. However, the U.S. labor market remained strong, with unemployment at 4.0%, and consumer spending continued to grow.
Due to the unchanged macroeconomic landscape, with elevated inflation and a healthy labor market, the Federal Reserve (Fed) maintained the benchmark federal funds rate’s targeted range of 5.25% to 5.50% and continued reducing its holdings of Treasury securities. Fed Chair Powell emphasized patience in monetary policy changes and indicated it may take longer than expected to lower rates, as the committee is seeking greater confidence that inflation is sustainably moving toward its 2% target.
Corporate earnings were strong, with S&P 500 companies reporting earnings growth of 6.0% and more companies exceeding EPS estimates compared to the previous quarter. Despite slowing economic growth, fewer companies discussed the potential for a recession on earnings calls, and fewer companies mentioned inflation.
In geopolitics, tensions remained high as President Biden hiked tariffs on $18 billion of imports from China in a bid to protect U.S. workers and businesses. In the Middle East, the U.S. continued efforts to stabilize maritime traffic in the Red Sea while also facing criticism from Israeli Prime Minister Netanyahu, who claimed the U.S. was withholding weapons from Israel. The U.S. presidential campaign season also began in earnest, with the first debate between incumbent Joe Biden and Republican rival Donald Trump taking place in June.
Performance and Attribution Summary
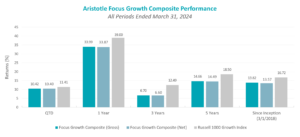
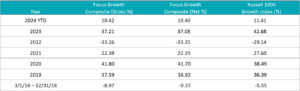
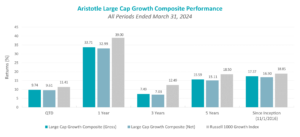
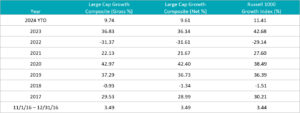
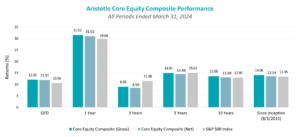
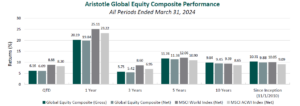
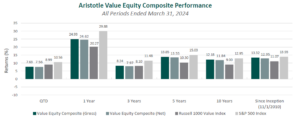
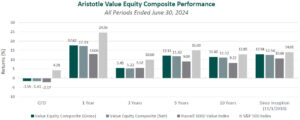
For the second quarter of 2024, Aristotle Capital’s Value Equity Composite posted a total return of -1.55% gross of fees (-1.61% net of fees), outperforming the -2.17% return of the Russell 1000 Value Index and underperforming the 4.28% return of the S&P 500 Index. Please refer to the table for detailed performance.
| Performance (%) | 2Q24 | YTD | 1 Year | 3 Years | 5 Years | 10 Years |
|---|---|---|---|---|---|---|
| Value Equity Composite (gross) | -1.55 | 5.96 | 17.62 | 5.49 | 12.11 | 11.46 |
| Value Equity Composite (net) | -1.61 | 5.83 | 17.33 | 5.22 | 11.82 | 11.12 |
| Russell 1000 Value Index | -2.17 | 6.62 | 13.06 | 5.52 | 9.00 | 8.22 |
| S&P 500 Index | 4.28 | 15.29 | 24.56 | 10.00 | 15.03 | 12.85 |

Source: FactSet
Past performance is not indicative of future results. Attribution results are based on sector returns which are gross of investment advisory fees. Attribution is based on performance that is gross of investment advisory fees and includes the reinvestment of income.
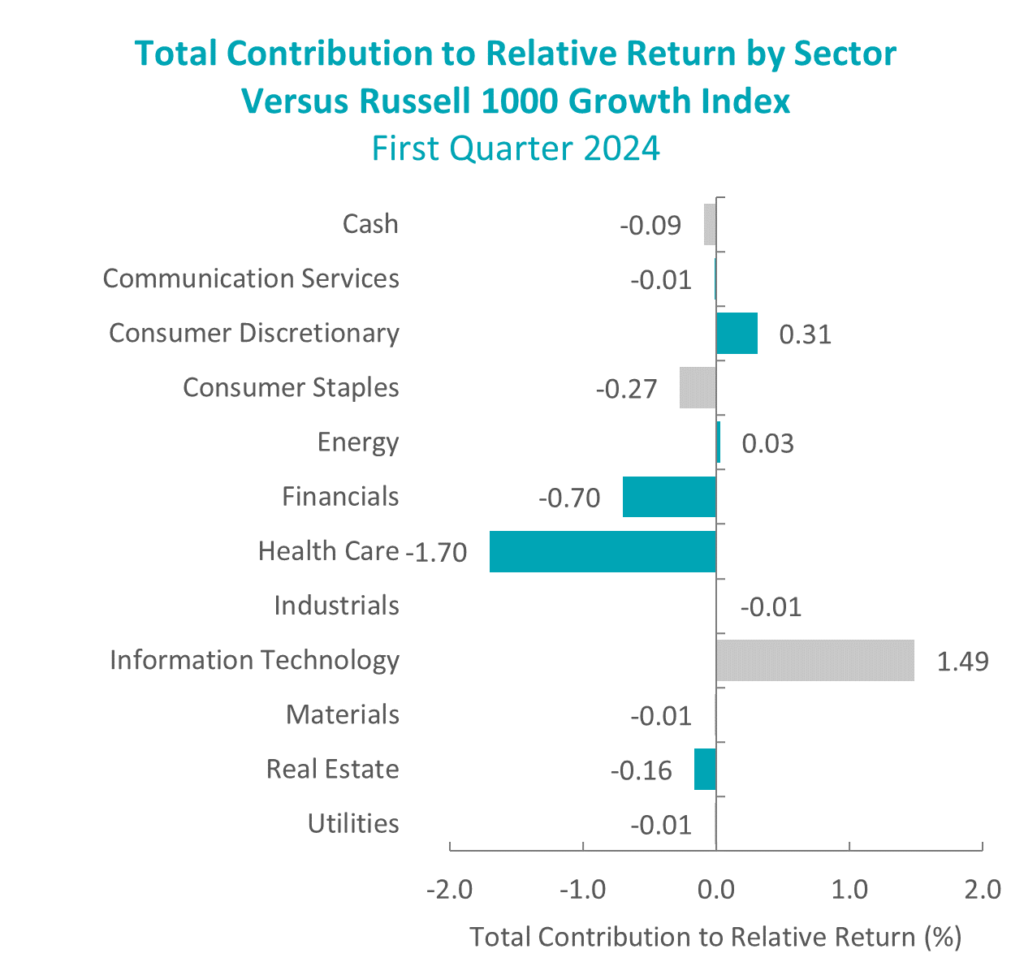
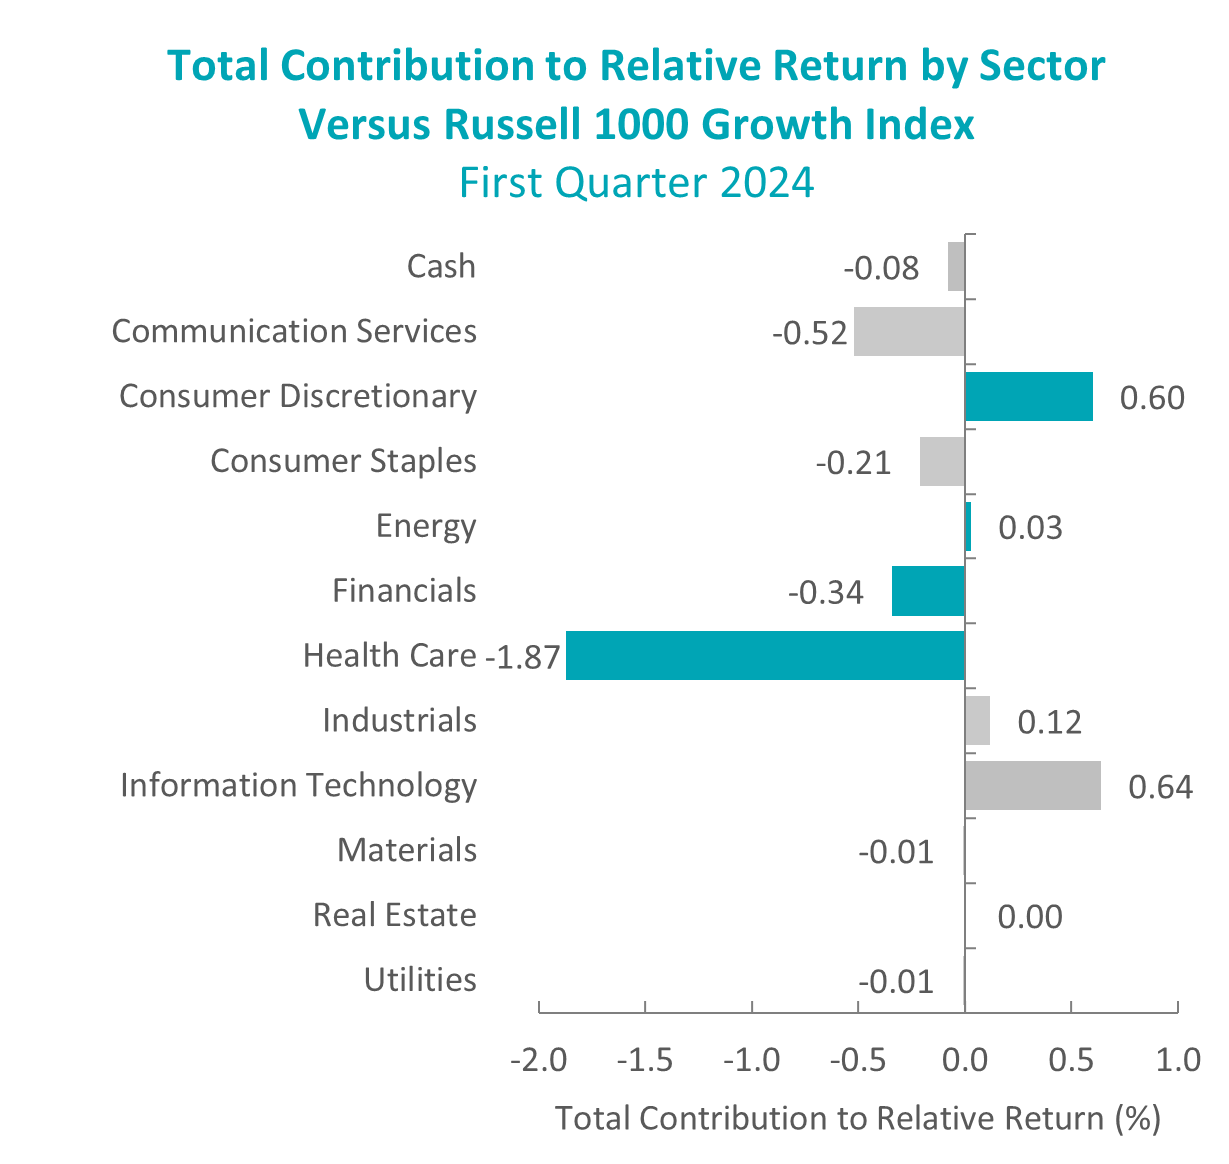
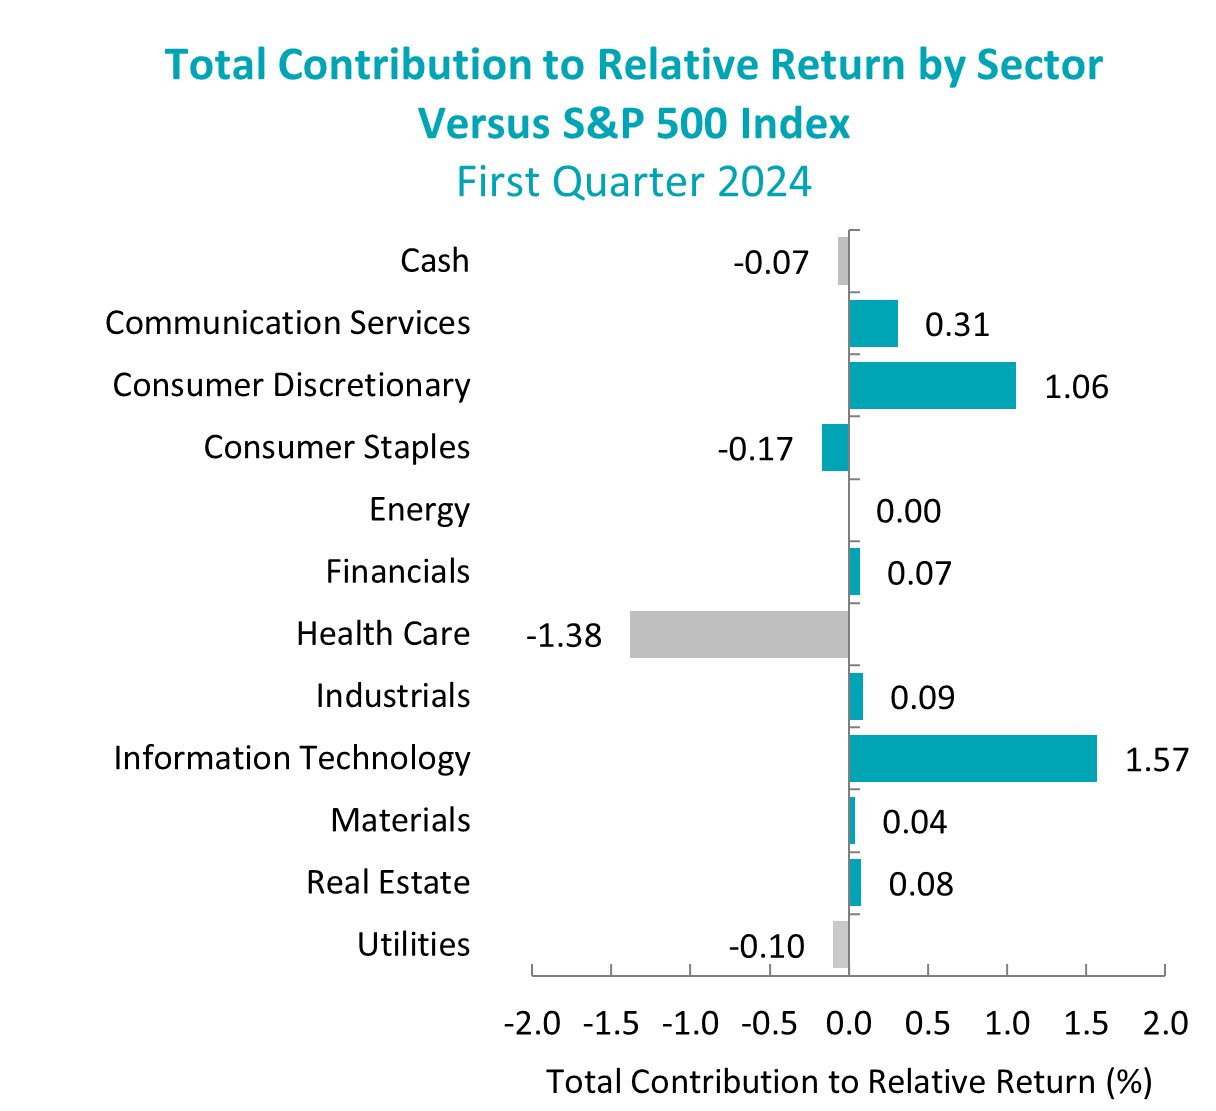
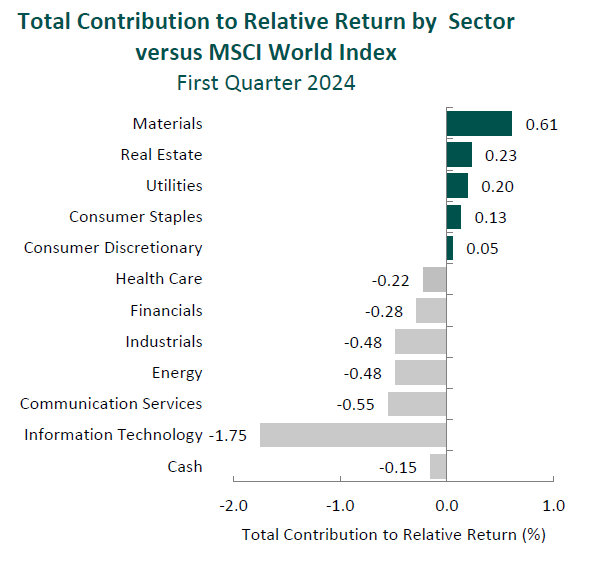
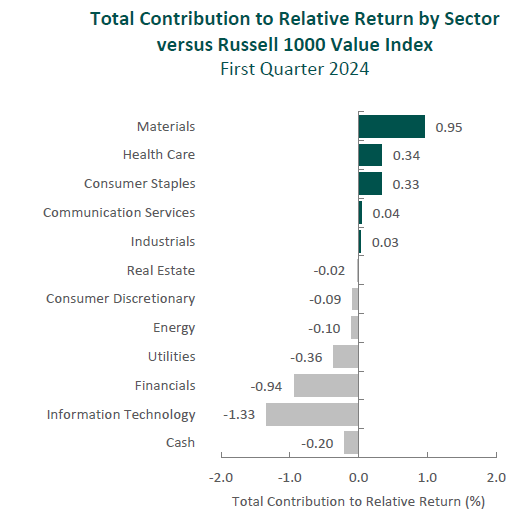
The portfolio’s outperformance relative to the Russell 1000 Value Index in the second quarter can be attributed to security selection, while allocation effects had a negative impact. Security selection in Information Technology and Health Care and an overweight in Information Technology contributed the most to relative performance. Conversely, security selection in Financials and Materials and an overweight in Consumer Discretionary detracted. (Relative weights are the result of bottom-up security selection.)
Contributors and Detractors for 2Q 2024
| Relative Contributors | Relative Detractors |
|---|---|
| Qualcomm | Lennar |
| Microsoft | Martin Marietta Materials |
| Adobe | Parker Hannifin |
| Amgen | Lowe’s |
| Alcon | Oshkosh |
Qualcomm, a leading wireless communications technology company, was the largest contributor for the quarter.After a period of weaker global demand for smartphones (driven by a slowdown in China) and elevated channel inventory, demand from Chinese handset manufacturers accelerated 40% year-over-year. More importantly, in our opinion, Qualcomm continues to execute on a previously identified catalyst of shifting its business mix beyond smartphones. The company announced increased progress for its automotive and Internet of Things (IoT) solutions. Within auto, the increase in vehicle content has resulted in 35% year-over-year revenue growth, with a design win pipeline of ~$45 billion, keeping the company on track to achieving ~$4 billion in auto-related revenues by 2026. In recent years, despite persistent threats of insourcing from large clients (most notably Apple), Qualcomm has been able to retain its high market share in handsets while simultaneously expanding in non-smartphone devices. We believe this progress is a testament to Qualcomm’s history of high (and productive) R&D spending, resulting in technological superiority. We believe Qualcomm’s technologies will continue to benefit as the world stays on a path toward a proliferation of connectivity between varying devices and as AI applications extend from the cloud to on-device.
Microsoft, a leading technology company specializing in software, hardware, cloud services, AI and digital applications, was one of the largest contributors during the quarter. The company continues to execute on a myriad of catalysts across its businesses, particularly within cloud-based applications like Azure and platform-based services such as LinkedIn. For Azure, Microsoft detailed previously announced partnerships with NVIDIA and AMD to develop first-party silicon chips and custom-designed infrastructure innovations, including its AI accelerator (Azure Maia) and CPU (Azure Cobalt). These advancements are part of Microsoft’s strategy to enhance AI performance and efficiency within the Azure ecosystem. LinkedIn, which has more than doubled its membership to over one billion in the past four years, is expanding its revenue streams across subscriptions and advertising and increasingly disrupting traditional recruiting and training functions. LinkedIn recently passed $16 billion in run rate annual revenue, which is only ~7% of total Microsoft revenue, but if it were a standalone business, it would be in the top half of S&P 500 constituents! The Azure and LinkedIn examples are just two of many that illustrate Microsoft’s ongoing transformation from an operating system to a total technology solutions provider.
Lennar, one of the nation’s largest homebuilders, was the biggest detractor for the quarter. Despite executing on previously identified catalysts, including shifting toward a capital-light business model (i.e., 79% of land controlled via options versus 21% owned, an improvement from 70/30 just one year ago), formal plans for a spinoff of $6 billion to $8 billion of land assets, and monetizing non-core assets such as the recently announced sale of multifamily housing assets, Lennar’s share price declined during the quarter. Management has called out affordability pressures (e.g., higher prices and mortgage rates) as challenges that have pressured gross margins and may continue to do so. Lennar has navigated affordability issues through more efficient operations (i.e., leveraging scale, as well as accelerating and matching production and sales volumes to lower construction costs) and increased incentives, the latter of which we view as unsustainable. As always, we are closely monitoring these cyclical dynamics with an eye to what is truly “normal.” Moreover, we take (some) comfort in Lennar’s excess net cash position and its potential to redeploy capital in the business and/or return cash to shareholders. Lastly, we remain sanguine on the U.S housing market, as well as Lennar’s ability to manage through the inevitable housing cycles.
Oshkosh, a manufacturer of purpose-built vehicles worldwide, was a main detractor during the quarter. Despite a decline in share price, the company has seen fundamental improvements and strong demand for its vehicles, including an increasing backlog of orders for fire trucks. As such, revenue for Oshkosh’s Vocational segment was up over 35% year-over-year. We believe this segment should be able to expand its margins, particularly as the company was awarded a contract to produce the “Next Generation Delivery Vehicle” for the U.S. Postal Service, which should begin to ramp up at the beginning of next year. This contract could generate in excess of $6 billion in revenue for the company. Furthermore, we continue to believe that Oshkosh is a high-quality business that should be able to create innovative equipment and gain market share across segments. This includes its aerial work platforms as global safety standards increase around the world.
Recent Portfolio Activity
| Buys | Sells |
|---|---|
| American Water Works | Crown Castle |
| Veralto |
During the quarter, we sold our positions in Crown Castle and Veralto and invested in American Water Works.
We first invested in Crown Castle, a provider of telecommunications infrastructure (including towers, fiber and small cells), in 2021. During our holding period, tenancy ratios for the company’s tower business increased. However, the company’s fiber and small cell business segments have yet to deliver the expected benefits from the 5G network transition. Additionally, the CEO of Crown Castle stepped down at the end of 2023, influenced by Elliott Investment Management, an activist investor. Concurrently, the company has initiated a strategic and operational review of its fiber segment to determine whether to pursue a turnaround or a complete/partial sale. Given the uncertainty surrounding the company’s business strategy and new management team, we decided to exit the investment. We will continue to monitor the company from the sidelines.
In the fourth quarter of 2023, we received shares of the water and product quality company Veralto when Danaher, a current Value Equity holding, spun off the business. After further assessing the now independently operated Veralto, we decided to exit our position. We believe our other holdings within the water value chain[1], including Xylem, American Water Works (our most recent purchase) and to some extent Ecolab, are more optimal investments.
American Water Works Company, Inc.
Founded in 1886 and headquartered in New Jersey, American Water Works is the largest and most geographically diverse water (~92% of regulated sales) and wastewater (~8%) utility in the United States. The company serves a population of approximately 14 million people across 14 states, with operations that span 53,700 miles of pipe, 540 water treatment plants, 1,200 groundwater wells, 1,700 pumping stations and 74 dams. The company expects to invest between $16 billion and $17 billion from 2024-2028 as it replaces and upgrades infrastructure (often decades old) to improve the efficiency and sustainability of its operations.
High-Quality Business
Some of the quality characteristics we have identified for American Water Works include:
- Stable and predictable revenues due to the essential need for water and its structure as a regulated monopoly with long-term service contracts;
- A history of growing cash returns to shareholders (~8.0% annualized dividend increases over the past five years);
- Economies of scale that provide advantages in pursuing new customers via acquisitions; and
- Constructive relationships with regulators that support timely cost recovery and the ability to gain approval for continued investments.
Attractive Valutaion
Based on our estimates of normalized earnings and the company’s targeted 55%-60% dividend payout ratio, we view shares as attractively valued. We believe opportunities for American Water Works to further enhance its revenues and profitability through infrastructure improvements and acquisitions are not fully appreciated by the market.
Compelling Catalysts
Catalysts we have identified for American Water Works, which we believe will cause its stock price to appreciate over our three- to five-year investment horizon, include:
- Completion of infrastructure upgrades, including the planned replacement of nearly 2,100 miles of mains and collection pipes between 2024-28, should increase reliability, as well as the value of American Water’s assets, enhancing profit levels permitted by regulators;
- Well positioned to further consolidate the highly fragmented water utility industry via acquisitions, as increasing regulation and fiscal challenges may drive more municipalities to sell their water assets; and
- Further penetration of wastewater services, which is a small but growing portion of American Water Works’ operations.
Conclusion
As economic data points fluctuate from quarter to quarter and the macroeconomic outlook remains uncertain, we focus on individual businesses. This quarter we highlighted some of the unique characteristics of American Water Works which, we believe, afford the company a competitive advantage relative to peers. Rather than attempt to predict Fed policy, GDP, or presidential elections, we will continue to identify and study what we deem to be high-quality companies. It is our core belief that the fundamentals of a business are the most important determinates of its long-term worth.
[1] The water value chain refers to companies that provide services related to the sourcing, treatment, distribution, usage, or disposal of water. The companies mentioned here are the only portfolio holdings within the S&P Global Water Index.
The opinions expressed herein are those of Aristotle Capital Management, LLC (Aristotle Capital) and are subject to change without notice. Past performance is not a guarantee or indicator of future results. This material is not financial advice or an offer to purchase or sell any product. You should not assume that any of the securities transactions, sectors or holdings discussed in this report were or will be profitable, or that recommendations Aristotle Capital makes in the future will be profitable or equal the performance of the securities listed in this report. The portfolio characteristics shown relate to the Aristotle Value Equity strategy. Not every client’s account will have these characteristics. Aristotle Capital reserves the right to modify its current investment strategies and techniques based on changing market dynamics or client needs. There is no assurance that any securities discussed herein will remain in an account’s portfolio at the time you receive this report or that securities sold have not been repurchased. The securities discussed may not represent an account’s entire portfolio and, in the aggregate, may represent only a small percentage of an account’s portfolio holdings. The performance attribution presented is of a representative account from Aristotle Capital’s Value Equity Composite. The representative account is a discretionary client account which was chosen to most closely reflect the investment style of the strategy. The criteria used for representative account selection is based on the account’s period of time under management and its similarity of holdings in relation to the strategy. Recommendations made in the last 12 months are available upon request.
Returns are presented gross and net of investment advisory fees and include the reinvestment of all income. Gross returns will be reduced by fees and other expenses that may be incurred in the management of the account. Net returns are presented net of actual investment advisory fees and after the deduction of all trading expenses.
All investments carry a certain degree of risk, including the possible loss of principal. Investments are also subject to political, market, currency and regulatory risks or economic developments. International investments involve special risks that may in particular cause a loss in principal, including currency fluctuation, lower liquidity, different accounting methods and economic and political systems, and higher transaction costs. These risks typically are greater in emerging markets. Securities of small‐ and medium‐sized companies tend to have a shorter history of operations, be more volatile and less liquid. Value stocks can perform differently from the market as a whole and other types of stocks.
The material is provided for informational and/or educational purposes only and is not intended to be and should not be construed as investment, legal or tax advice and/or a legal opinion. Investors should consult their financial and tax adviser before making investments. The opinions referenced are as of the date of publication, may be modified due to changes in the market or economic conditions, and may not necessarily come to pass. Information and data presented has been developed internally and/or obtained from sources believed to be reliable. Aristotle Capital does not guarantee the accuracy, adequacy or completeness of such information.
Aristotle Capital Management, LLC is an independent registered investment adviser under the Advisers Act of 1940, as amended. Registration does not imply a certain level of skill or training. More information about Aristotle Capital, including our investment strategies, fees and objectives, can be found in our ADV Part 2, which is available upon request. ACM-2407-11
Sources: CAPS CompositeHubTM, Russell Investments, Standard & Poor’s
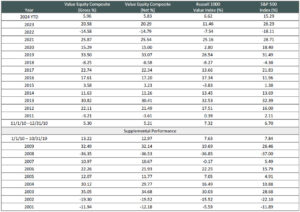
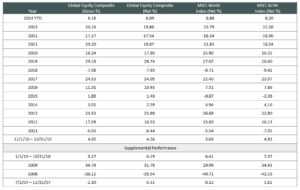
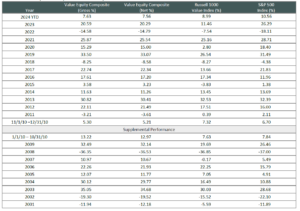
Composite returns for all periods ended June 30, 2024 are preliminary pending final account reconciliation.
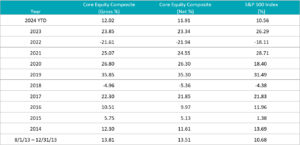
Past performance is not indicative of future results. The information provided should not be considered financial advice or a recommendation to purchase or sell any particular security or product. Performance results for periods greater than one year have been annualized. The Aristotle Value Equity strategy has an inception date of November 1, 2010; however, the strategy initially began at Mr. Gleicher’s predecessor firm in October 1997. A supplemental performance track record from January 1, 2001 through October 31, 2010 is provided above. The returns are based on two separate accounts and performance results are based on custodian data. During this time, Mr. Gleicher had primary responsibility for managing the two accounts, one account starting in November 2000 and the other December 2000.
Returns are presented gross and net of investment advisory fees and include the reinvestment of all income. Gross returns will be reduced by fees and other expenses that may be incurred in the management of the account. Net returns are presented net of actual investment advisory fees and after the deduction of all trading expenses.
The Russell 1000 Value® Index measures the performance of the large cap value segment of the U.S. equity universe. It includes those Russell 1000 Index companies with lower price-to-book ratios and lower expected growth values. The S&P 500® Index is the Standard & Poor’s Composite Index of 500 stocks and is a widely recognized, unmanaged index of common stock prices. The Russell 1000® Growth Index measures the performance of the large cap growth segment of the U.S. equity universe. It includes those Russell 1000 companies with higher price-to-book ratios and higher forecasted growth values. The Russell 2000® Index measures the performance of the small cap segment of the U.S. equity universe. The Russell 2000 Index is a subset of the Russell 3000® Index representing approximately 10% of the total market capitalization of that index. It includes approximately 2,000 of the smallest securities based on a combination of their market cap and current index membership. The Dow Jones Industrial Average® is a price-weighted measure of 30 U.S. blue-chip companies. The Index covers all industries except transportation and utilities. The NASDAQ Composite Index measures all NASDAQ domestic and international based common type stocks listed on The NASDAQ Stock Market. The NASDAQ Composite includes over 3,000 companies, more than most other stock market indexes. The Bloomberg U.S. Aggregate Bond Index is an unmanaged index of domestic investment grade bonds, including corporate, government and mortgage-backed securities. The WTI Crude Oil Index is a major trading classification of sweet light crude oil that serves as a major benchmark price for oil consumed in the United States. The 3-Month U.S. Treasury Bill is a short-term debt obligation backed by the U.S. Treasury Department with a maturity of three months. The Consumer Price Index is a measure of the average change over time in the prices paid by urban consumers for a market basket of consumer goods and services. The volatility (beta) of the Composite may be greater or less than its respective benchmarks. It is not possible to invest directly in these indexes.