This site has been created for institutional investors and RIAs. An institutional investor is an entity that invests capital on behalf of others such as pension funds, banks, insurance companies, mutual funds, foundations/endowments, trust companies or other large investors and their investment consultants. RIA is a registered investment advisor who is responsible for allocating their client funds. This site is not intended for individual investor access, as it does not consider individual risk tolerances or investment objectives of an individual investor. Click “Accept and Continue” to affirm you meet the description of an Institutional Investor.
This site has been designed for financial intermediaries such as financial advisors, wealth managers, broker/dealers and home office research teams. This site is not intended for individual investor access, as it does not consider individual risk tolerances or investment objectives of an individual investor. Click “Accept and Continue” to affirm you meet the description of a Financial Advisor.
This area of the website contains information that is general and/or educational in nature. Individual investors should consider their own investment objectives and risk tolerances or consult with a financial advisor before making any investment decision. Click “Accept and Continue” to continue.
After nearly 15 years of large cap dominance, investors are asking: what could drive the next market cycle?
Several potential catalysts are coming into focus:
Earnings troughing and reaccelerating
Slower growth rates by the “AI 5”
Rising M&A activity
Increased capex spending
These shifts suggest that small caps may be well-positioned to benefit from a broadening of market leadership, creating potential entry points for long-term investors.
Small Cap Earnings and Sales Growth Expectations
As of June 30, 2025
Source: Furey Research Partners; FactSet as of 6/30/2025.
Large-Cap Cycles Typically Peak at Market Tops Crowded with Mega Caps
As of June 30, 2025
Sources: eVestment; FactSet; Furey Research Partners. The 10-Year Rolling Excess Return represents the annualized return of the Russell 2000 Index over the trailing 10-year period minus the annualized return of the S&P 500 Index over the same period. Rolling periods are calculated monthly based on trailing 10-year return data for these indices from 1979 to June 2025. Historical returns prior to 1979 represent the Ibbotson SBBI US Small Cap Stocks and the Ibbotson SBBI US Large Cap Stocks indices.
Solid M&A Activity Down Cap Helps Small Cap’s Performance
As of June 30, 2025
Source: Jefferies; FTSE Russell; FactSet; Bloomberg as of 6/30/2025.
US Capex Growth is More Correlated with SC Sales Growth
Small cap stocks have a relatively higher historical correlation with capex than large cap stocks
Correlation of US capex growth with small cap (Russell 2000) and large cap (S&P 500) sales growth, 1985-3Q24.
Source: BofA US Equity & US Quant Strategy, FactSet, Haver Analytics, 9/30/2024.
The opinions expressed herein are those of Aristotle Capital Boston (Aristotle Boston) and are subject to change without notice. This material is not financial advice or an offer to purchase or sell any product. Aristotle Boston reserves the right to modify its current investment strategies and techniques based on changing market dynamics or client needs.
All investments carry a certain degree of risk, including the possible loss of principal. Investments are also subject to political, market, currency and regulatory risks or economic developments. International investments involve special risks that may in particular cause a loss in principal, including currency fluctuation, lower liquidity, different accounting methods and economic and political systems, and higher transaction costs. These risks typically are greater in emerging markets. Securities of small- and medium-sized companies tend to have a shorter history of operations, be more volatile and less liquid. Value stocks can perform differently from the market as a whole and other types of stocks. The material is provided for informational and/or educational purposes only and is not intended to be and should not be construed as investment, legal or tax advice and/or a legal opinion. Investors should consult their financial and tax adviser before making investments. The opinions referenced are as of the date of publication, may be modified due to changes in the market or economic conditions, and may not necessarily come to pass. Information and data presented has been developed internally and/or obtained from sources believed to be reliable. Aristotle Boston does not guarantee the accuracy, adequacy or completeness of such information.
Past performance is not indicative of future results. The information provided in this report should not be considered financial advice or a recommendation to purchase or sell any particular security.
Differing historical time periods are selected throughout the presentation as we believe specific periods provide the most informative historical analog for the concepts presented.
The Russell 2000® Index measures the performance of the small cap segment of the U.S. equity universe. The Russell 2000 Index is a subset of the Russell 3000® Index representing approximately 10% of the total market capitalization of that index. It includes approximately 2000 of the smallest securities based on a combination of their market cap and current index membership. The S&P 500 Index is the Standard & Poor’s Composite Index and is a widely recognized, unmanaged index of common stock prices. It is market cap weighted and includes 500 leading companies, capturing approximately 80% coverage of available market capitalization. The volatility (beta) of the portfolios may be greater or less than the benchmarks. It is not possible to invest directly in these indices.
Aristotle Capital Boston, LLC is an independent investment adviser registered under the Investment Advisers Act of 1940, as amended. Registration does not imply a certain level of skill or training. More information about Aristotle Boston, including our investment strategies, fees and objectives, can be found in Form ADV Part 2, which is available upon request. ACB-2509-5
Over the past six months, equity markets have experienced a broad rally. As Q3 comes to a close, we believe it is critical to reassess the valuation landscape.
Despite their recent outperformance since Liberation Day, small cap equities continue to trade at attractive relative valuations versus large caps. Within the segment, we believe small value remains particularly compelling, with discounts widening further compared to small growth. Over the long term, valuation remains one of the main determinants of alpha generation.
Small-Cap Value and Mid-Cap Value Remain Cheap Relative to History and Style Peers
As of June 30, 2025
Small vs. large: cheap vs. history across metrics
Russell 2000 vs. Russell 1000 relative valuation vs. historical avg. (January 31, 1985 – June 30, 2025)
Source: BofA US Small/Mid-Cap Valuations; FactSet. P/E (price-to-earnings) measures exclude negative earnings. Forward P/E is based on consensus next 12 month forecast earnings. EV/FCF excludes negative FCF.
Small Caps and Value are Historically Cheap Relative to Large Caps and Growth
As of June 30, 2025
Small cap Growth is historically expensive vs. Value on five out of six metrics
Relative premium to the historical average multiple for Russell 2000 Growth vs. Russell 2000 Value
Source: BofA Global Research; FactSet. Based on historical multiples, 1985-6/30/2025.
Valuation Impact over Short and Long Time Periods
As of May 31, 2025
Valuations have the highest explanatory power over long-term (ten-year) returns
R2 of relative forward P/E vs subsequent return spread over various time horizons (since 1985): Russell 2000 vs Russell 1000, as of 5/31/2025
Note: Represents the relationship between the relative forward PE for the Russell 2000 vs the Russell 1000 (since 1985) and subsequent rolling returns differential.
Source: BofA US Equity & Quant Strategy; FactSet as of 5/31/2025.
The opinions expressed herein are those of Aristotle Capital Boston (Aristotle Boston) and are subject to change without notice. This material is not financial advice or an offer to purchase or sell any product. Aristotle Boston reserves the right to modify its current investment strategies and techniques based on changing market dynamics or client needs.
All investments carry a certain degree of risk, including the possible loss of principal. Investments are also subject to political, market, currency and regulatory risks or economic developments. International investments involve special risks that may in particular cause a loss in principal, including currency fluctuation, lower liquidity, different accounting methods and economic and political systems, and higher transaction costs. These risks typically are greater in emerging markets. Securities of small- and medium-sized companies tend to have a shorter history of operations, be more volatile and less liquid. Value stocks can perform differently from the market as a whole and other types of stocks. The material is provided for informational and/or educational purposes only and is not intended to be and should not be construed as investment, legal or tax advice and/or a legal opinion. Investors should consult their financial and tax adviser before making investments. The opinions referenced are as of the date of publication, may be modified due to changes in the market or economic conditions, and may not necessarily come to pass. Information and data presented has been developed internally and/or obtained from sources believed to be reliable. Aristotle Boston does not guarantee the accuracy, adequacy or completeness of such information.
Past performance is not indicative of future results. The information provided in this report should not be considered financial advice or a recommendation to purchase or sell any particular security.
Differing historical time periods are selected throughout the presentation as we believe specific periods provide the most informative historical analog for the concepts presented.
The Russell 2000® Index measures the performance of the small cap segment of the U.S. equity universe. The Russell 2000 Index is a subset of the Russell 3000® Index representing approximately 10% of the total market capitalization of that index. It includes approximately 2000 of the smallest securities based on a combination of their market cap and current index membership. The Russell 1000® Index The Russell 1000® Index measures the performance of the large-cap segment of the US equity universe. It is a subset of the Russell 3000® Index and includes approximately 1,000 of the largest securities based on a combination of their market cap and current index membership. The Russell 1000 represents approximately 93% of the Russell 3000® Index, as of the most recent reconstitution. The Russell 2000 Growth® Index measures the performance of the small cap growth segment of the US equity universe. It includes those Russell 2000 companies with relatively higher price-to-book ratios, higher I/B/E/S forecast medium term (2 year) growth and higher sales per share historical growth (5 years). The Russell 2000 Value® Index measures the performance of the small cap value segment of the US equity universe. It includes those Russell 2000 companies with relatively lower price-to-book ratios, lower I/B/E/S forecast medium term (2 year) growth and lower sales per share historical growth (5 years). The volatility (beta) of the portfolios may be greater or less than the benchmark. It is not possible to invest directly in this index.
Aristotle Capital Boston, LLC is an independent investment adviser registered under the Investment Advisers Act of 1940, as amended. Registration does not imply a certain level of skill or training. More information about Aristotle Boston, including our investment strategies, fees and objectives, can be found in Form ADV Part 2, which is available upon request. ACB-2509-4
Small cap stocks perform well in a variety of inflationary regimes relative to large and mid-cap stocks including the current environment where inflation is below 3% and rising. Discover the historical performance of small-cap stocks in various inflationary environments.
View our full small caps observations for deeper insight.
Historical Analysis of Small Caps in Differing Inflationary Environments
High and falling inflation has historically been a sweet spot for small cap investors.
If inflation continues to drift below 3% in 2025, that should be good for small caps.
Sources: Center for Research in Security Prices (CRSP), The University of Chicago Booth School of Business, Jefferies. CRSP US Small Cap Index, CRSP US Mid Cap Index, CRSP US Large Cap Index. Past performance is not indicative of future results.
u003cpu003eThe opinions expressed herein are those of Aristotle Capital Boston (Aristotle Boston) and are subject to change without notice. This material is not financial advice or an offer to purchase or sell any product. Aristotle Boston reserves the right to modify its current investment strategies and techniques based on changing market dynamics or client needs.u003c/pu003enu003cpu003eAll investments carry a certain degree of risk, including the possible loss of principal. Investments are also subject to political, market, currency and regulatory risks or economic developments. International investments involve special risks that may in particular cause a loss in principal, including currency fluctuation, lower liquidity, different accounting methods and economic and political systems, and higher transaction costs. These risks typically are greater in emerging markets. Securities of small- and medium-sized companies tend to have a shorter history of operations, be more volatile and less liquid. Value stocks can perform differently from the market as a whole and other types of stocks. The material is provided for informational and/or educational purposes only and is not intended to be and should not be construed as investment, legal or tax advice and/or a legal opinion. Investors should consult their financial and tax adviser before making investments. The opinions referenced are as of the date of publication, may be modified due to changes in the market or economic conditions, and may not necessarily come to pass. Information and data presented has been developed internally and/or obtained from sources believed to be reliable. Aristotle Boston does not guarantee the accuracy, adequacy or completeness of such information.u003c/pu003enu003cpu003ePast performance is not indicative of future results. The information provided in this report should not be considered financial advice or a recommendation to purchase or sell any particular security.u003c/pu003enu003cpu003eThe CRSP U.S. Large Cap Index measures the performance of U.S. companies that comprise the top 85% of investable market capitalization and are traded on NYSE, NYSE Market, NASDAQ or ARCA. The CRSP U.S. Mid Cap Index measures the performance of U.S. companies that fall in the top 70-85% of investable market capitalization. It includes securities traded on NYSE, NYSE Market, NASDAQ, or ARCA. The CRSP U.S. Small Cap Index measures the performance of U.S. companies that fall in the bottom 2-15% of investable market capitalization. It includes securities traded on NYSE, NYSE Market, NASDAQ, or ARCA. The volatility (beta) of the portfolios may be greater or less than the benchmarks. It is not possible to invest directly in these indices.u003c/pu003enu003cpu003eAristotle Capital Boston, LLC is an independent investment adviser registered under the Investment Advisers Act of 1940, as amended. Registration does not imply a certain level of skill or training. More information about Aristotle Boston, including our investment strategies, fees and objectives, can be found in Form ADV Part 2, which is available upon request. ACB-2506-30u003c/pu003e
The quality of the Russell 2000 has meaningfully deteriorated with nearly 40% of the index constituents being non-earners and close to 25% are at risk of bankruptcy. With $65 billion in zero interest rate era debt maturing in the coming years, refinancing risk is elevated. History suggests investing in companies that generate positive net income not only supports long-term outperformance but may also help mitigate the refinancing risk embedded in the index.
View our full small caps observations for deeper insight.
Quality of the Index Has Eroded
As of March 31, 2025
Source: Aristotle Boston analysis with data from Bloomberg and Russell Investments. Data from 7/1994 to 3/2025. Annualized Excess Returns above are average annualized excess returns.
Quality of the Index Has Eroded
Small cap stocks have a relatively larger share of debt coming due in the next 5 years.
As interest rates have increased since much of this debt was issued, refinancing will be more expensive and difficult for non- or low-earning stocks.
For more information on the index and refinancing risk click here.
Disclosures
The opinions expressed herein are those of Aristotle Capital Boston (Aristotle Boston) and are subject to change without notice. This material is not financial advice or an offer to purchase or sell any product. Aristotle Boston reserves the right to modify its current investment strategies and techniques based on changing market dynamics or client needs.
All investments carry a certain degree of risk, including the possible loss of principal. Investments are also subject to political, market, currency and regulatory risks or economic developments. International investments involve special risks that may in particular cause a loss in principal, including currency fluctuation, lower liquidity, different accounting methods and economic and political systems, and higher transaction costs. These risks typically are greater in emerging markets. Securities of small- and medium-sized companies tend to have a shorter history of operations, be more volatile and less liquid. Value stocks can perform differently from the market as a whole and other types of stocks. The material is provided for informational and/or educational purposes only and is not intended to be and should not be construed as investment, legal or tax advice and/or a legal opinion. Investors should consult their financial and tax adviser before making investments. The opinions referenced are as of the date of publication, may be modified due to changes in the market or economic conditions, and may not necessarily come to pass. Information and data presented has been developed internally and/or obtained from sources believed to be reliable. Aristotle Boston does not guarantee the accuracy, adequacy or completeness of such information.
Past performance is not indicative of future results. The information provided in this report should not be considered financial advice or a recommendation to purchase or sell any particular security.
The Russell 2000® Index measures the performance of the small cap segment of the U.S. equity universe. The Russell 2000 Index is a subset of the Russell 3000® Index representing approximately 10% of the total market capitalization of that index. It includes approximately 2000 of the smallest securities based on a combination of their market cap and current index membership. The Russell 1000 Index is a subset of the Russell 3000® Index. It includes approximately 1000 of the largest securities based on a combination of their market cap and current index membership. The volatility (beta) of the portfolios may be greater or less than the benchmarks. It is not possible to invest directly in these indices.
The Altman Z-Score is a financial model that predicts the likelihood of a company going bankrupt within two years. It uses a combination of five key financial ratios to calculate a single score. The formula takes into account profitability, leverage, liquidity, solvency, and activity ratios. An Altman Z-score close to 0 suggests a company might be headed for bankruptcy, while a score closer to 3 suggests a company is in solid financial positioning.
Aristotle Capital Boston, LLC is an independent investment adviser registered under the Investment Advisers Act of 1940, as amended. Registration does not imply a certain level of skill or training. More information about Aristotle Boston, including our investment strategies, fees and objectives, can be found in Form ADV Part 2, which is available upon request. ACB-2506-29
Over the past 15 years we have observed a prolonged large cap cycle, resulting in small caps as a percentage of the Russell 3000 index hitting 20 year lows. The last time large caps outperformed small caps by this wide of a margin was during the dot-com bubble in 1999. If history is any indication and markets are mean reverting, forward returns for small caps should be strong as the asset classes normalize. Explore the potential reversion of small cap stocks to historical norms and the distinctive opportunities this presents.
Small vs. Large Potential Reversion to Historical Norms
As of March 31, 2025
We believe the latest large-cap cycle is growing old, as large caps have outperformed small caps for the better half of the last decade plus. A reversion to the mean positions small caps well relative to large caps moving forward.
Rolling 10-Year Excess Return U.S. Small Cap vs. U.S. Large Cap Stocks (1935 – 3/31/2025)
Source: eVestment. The 10-Year Rolling Excess Return represents the annualized return of the Russell 2000 Index over the trailing 10-year period minus the annualized return of the Russell 1000 Index over the same period. Rolling periods are calculated monthly based on trailing 10-year return data for these indices from 1979 to March 2025. Historical returns prior to 1979 represent the Ibbotson SBBI US Small Cap Stocks and the Ibbotson SBBI US Large Cap Stocks indices. Cycles are defined by peak to trough inflection points in 10-year rolling excess returns. Length in years are rounded to nearest whole number. Past performance is not indicative of future results..
Small Cap’s Total Market Cap as a Percentage of the Russell 3000 sits at a 20-Year Low
As of March 31, 2025
Russell 2000 Total Market Cap / Russell 3000 Total Market Cap (%)
9/30/2004 – 3/31/2025
Source: Bloomberg. The ratio represents the total market capitalization of the Russell 2000 Index as a percentage of the total market capitalization of the Russell 3000 Index.
Trailing Performance History Suggests We May Be at an Inflection Point
Source: [Left chart]: Furey Research Partners; FactSet. Based on the annualized returns of the Russell 2000 and S&P 500 indices from 1979 to December 2024. [Right chart]: Furey Research Partners; FactSet. Historical returns prior to 1979 represent the Ibbotson SBBI US Small Cap Stocks and the Ibbotson SBBI US Large Cap Stocks indices. Past performance is not indicative of future results..
The Last Time Large Caps Outperformed Small Caps by this Margin was in 1999
As of March 31, 2025
Source: eVestment. The 10-Year Rolling Excess Return represents the annualized return of the Russell 2000 Index over the trailing 10-year period minus the annualized return of the S&P 500 Index over the same period. Rolling periods are calculated monthly based on trailing 10-year return data for these indices from 1979 to March 2025. Past performance is not indicative of future results.
The opinions expressed herein are those of Aristotle Capital Boston (Aristotle Boston) and are subject to change without notice. This material is not financial advice or an offer to purchase or sell any product. Aristotle Boston reserves the right to modify its current investment strategies and techniques based on changing market dynamics or client needs.
All investments carry a certain degree of risk, including the possible loss of principal. Investments are also subject to political, market, currency and regulatory risks or economic developments. International investments involve special risks that may in particular cause a loss in principal, including currency fluctuation, lower liquidity, different accounting methods and economic and political systems, and higher transaction costs. These risks typically are greater in emerging markets. Securities of small- and medium-sized companies tend to have a shorter history of operations, be more volatile and less liquid. Value stocks can perform differently from the market as a whole and other types of stocks. The material is provided for informational and/or educational purposes only and is not intended to be and should not be construed as investment, legal or tax advice and/or a legal opinion. Investors should consult their financial and tax adviser before making investments. The opinions referenced are as of the date of publication, may be modified due to changes in the market or economic conditions, and may not necessarily come to pass. Information and data presented has been developed internally and/or obtained from sources believed to be reliable. Aristotle Boston does not guarantee the accuracy, adequacy or completeness of such information.
Past performance is not indicative of future results. The information provided in this report should not be considered financial advice or a recommendation to purchase or sell any particular security.
Differing historical time periods are selected throughout the presentation as we believe specific periods provide the most informative historical analog for the concepts presented.
The Russell 2000® Index measures the performance of the small cap segment of the U.S. equity universe. The Russell 2000 Index is a subset of the Russell 3000® Index representing approximately 10% of the total market capitalization of that index. It includes approximately 2000 of the smallest securities based on a combination of their market cap and current index membership. The Russell 1000® Index measures the performance of the large-cap segment of the US equity universe. It is a subset of the Russell 3000® Index and includes approximately 1,000 of the largest securities based on a combination of their market cap and current index membership. The Russell 1000 represents approximately 93% of the Russell 3000® Index, as of the most recent reconstitution. The Russell 3000® Index measures the performance of the largest 3,000 US companies representing approximately 96% of the investable US equity market, as of the most recent reconstitution. The Russell 3000 Index is constructed to provide a comprehensive, unbiased and stable barometer of the broad market and is completely reconstituted annually to ensure new and growing equities are included. The S&P 500® Index is the Standard & Poor’s Composite Index of 500 stocks and is a widely recognized, unmanaged index of common stock prices. The volatility (beta) of the portfolios may be greater or less than the benchmarks. It is not possible to invest directly in these indices.
Aristotle Capital Boston, LLC is an independent investment adviser registered under the Investment Advisers Act of 1940, as amended. Registration does not imply a certain level of skill or training. More information about Aristotle Boston, including our investment strategies, fees and objectives, can be found in Form ADV Part 2, which is available upon request. ACB-2506-26
The volatility observed throughout 2024, persisted into the first quarter of 2025. The Russell 2500 Index declined -7.50% during the quarter, following a strong 2024 with the index returning 11.99%. After a moderately positive start to the quarter, February and March were a more challenging market environment due to uncertainty surrounding the precise parameters and implementation of the new administration’s policies, geopolitical tensions and a higher for longer rate environment. Continued economic growth, a stable labor market and firmer inflation data kept the Federal Reserve (Fed) on the more hawkish course they took in December. Chairman Powell held rates steady at the March FOMC meeting and indicated the Fed will maintain a more measured approach going forward, updating their economic projections and forecasts to two rate cuts in 2025.
Stylistically, value stocks outperformed their growth counterparts during the quarter as the Russell 2500 Value Index returned -5.83% compared to the -10.80% return of the Russell 2500 Growth index. This is a reversal from last year where growth significantly outperformed value.
From a factor performance perspective, the quarter saw a change in market preference to higher-quality companies, favoring dividend-paying, defensive stocks. This change in sentiment was due in part to level interest rates, moderating US economic activity, and an increase in recession risk.
At the sector level, defensive sectors outperformed cyclical sectors, with Utilities (+8.37%), a sector often perceived as a bond proxy, being the only sector in the Russell 2500 Index to post a positive return during the quarter. The worst performing sectors were Information Technology (-16.57%), Consumer Discretionary (-11.77%), Industrials (-10.16%), and Health Care (-8.38%) while Utilities (+8.37%), Materials (-4.92%), Communications (-4.57%), Financials (-3.42%), Energy (-1.92%), Real Estate (-1.67%) and Consumer Staples (-1.02%) performed best.
Sources: CAPS Composite Hub, Russell Investments Past performance is not indicative of future results. Composite returns are presented pure gross and net of the maximum wrap fee and include the reinvestment of all income. Pure gross returns do not reflect the deduction of any trading costs or other fees and are supplemental to the net returns. Net returns are calculated by subtracting the highest applicable wrap/SMA fee, which includes trading costs and custodial fees, from the pure gross monthly composite return (2.00% on an annual basis, or 0.17% monthly). Aristotle Small/Mid Cap Equity Composite returns are preliminary pending final account reconciliation. Please see important disclosures at the end of this document.
Performance Review
For the first quarter, the Aristotle Small/Mid Cap Equity Composite generated a total return of -6.70% net of fees (-6.22% pure gross of fees), outperforming the -7.50% total return of the Russell 2500 Index. Outperformance was driven by security selection in the Health Care, Materials and Information Technology sectors coupled with an underweight allocation to Consumer Discretionary. An underweight to the Utilities sector, along with security selection in Consumer Staples, Consumer Discretionary and Energy detracted from performance.
Relative Contributors
Relative Detractors
Alamos Gold
MACOM Technology Solutions
Huron Consulting Group
Wolverine World Wide
Merit Medical Systems
Ciena Corporation
Chemed Corporation
Chart Industries
AerCap Holdings
ASGN Incorporated
CONTRIBUTORS
Alamos Gold (AGI-CA), engages in the exploration, development, mining and extraction of precious metals. We maintain our investment as we believe in the company’s lower geopolitical risk profile, solid production growth plan from 600k oz to 1M oz per year over the next five years, and strong operational track record.
Huron Consulting Group (HURN), a specialty consulting company that provides financial, operational, and digital consulting services to health care, education and commercial clients, appreciated after delivering strong results highlighted by continued momentum within the company’s health care and commercial segments, more than offsetting the education segment. We maintain our investment, as we believe the company remains well-positioned to capitalize on a demand backdrop aided by financial and operational pressures in its largest end-markets, along with secular tailwinds supporting digital transformation, analytics and cloud consulting.
DETRACTORS
MACOM Technology Solutions (MTSI), a designer and manufacturer of high-performance semiconductor products, declined along with the broader semiconductor industry during the quarter. We maintain our position, as we believe the company’s meaningful exposure to growing demand from Data Center and 5G end market applications along with the integration of recent acquisitions should drive additional shareholder value in periods to come.
Wolverine World Wide (WWW), engages in the design, manufacture, and sale of branded casual, active lifestyle, work, outdoor sport, athletic, uniform, footwear, and apparel. The company met expectations but guided lower for FY 2025, punishing the stock price. We maintain our position as we expect improved top-line growth and further net leverage reduction to support the Company’s long-term financial objectives leading to increased shareholder value.
Recent Portfolio Activity
Buys/Acquisitions
Sells/Liquidations
Agree Realty Corporation
Barnes Group
Old National Bancorp
Designer Brands
Valvoline
Nasdaq
Summit Materials
BUYS/ACQUISITIONS
Agree Realty Corporation (ADC), is a real estate investment trust that owns, manages and develops primarily neighborhood community shopping centers and single tenant properties leased to major retail tenants such as Sherwin-Williams, Wal-Mart and TJX Companies. We believe the company’s high-quality portfolio, recession resistant retail categories and strong balance sheet coupled with management’s proactive tenant management and acquisition pipeline will benefit the company on a go-forward basis.
Old National Bancorp (ONB), is a regional bank serving clients primarily in the Midwest and Southeastern U.S. We believe the company’s geographic location, strong balance sheet, increased loan growth and repricing of fixed-rate loans to higher rates will benefit NIMs on a go-forward basis.
Valvoline (VVV), is a pure-play auto quick lube and maintenance service provider with over 2,000 locations in the U.S. and Canada. The company provides quick and convenient stay-in-your-car automotive preventative maintenance through its full-service oil changes from skilled technicians in less than 15minutes. We believe the company will benefit from increased market share gains, driven by both corporate and franchise expansion, growing its scale, accelerating growth and increasing its moat.
SELLS/LIQUIDATIONS
Barnes Group (B), is a globally recognized industrial and aerospace manufacturer and service provider that stands out for its highly engineered products, differentiated industrial technologies, and innovative solutions. The company was acquired and taken private by Apollo Funds.
Designer Brands (DBI), is a North American company which engages in the design, production, and retail of footwear and accessory brands. We sold the position due to what we believed were deteriorating corporate fundamentals.
Nasdaq (NDAQ), is a holding company, which engages in trading, clearing, exchange technology, regulatory, securities listing, information, and public and private company services. We sold the position as the stock had reached our valuation target.
Summit Materials (SUM), is a North American supplier of aggregates, cement, and ready-mix concrete for the construction industry. The company was acquired by Quikrete Holdings, Inc.
Outlook
We remain optimistic about the long-term potential for the SMID-cap segment of the U.S. market. Valuations remain compelling relative to large caps, with the Russell 2500 Index trading near the lower end of its historical range. Potential tailwinds, including deregulation, lower corporate tax rates, increased M&A activity, continued reshoring of U.S. manufacturing, and infrastructure-related spending, could provide additional support for SMID-cap stocks. There may be some short-term volatility as the new administration’s policies are implemented and absorbed by markets. We also remain mindful of risks such as inflation reaccelerating, increased geopolitical tensions, and potential U.S. economic weakness.
Positioning
Our current positioning is a function of our bottom-up security selection process and our ability to identify what we view as attractive investment candidates, regardless of economic sector definitions. Overweights in Information Technology and Industrials are mostly a function of our underlying company specific views rather than any top-down predictions for each sector. Conversely, we continue to be underweight in Consumer Discretionary, as we have been unable to identify what we consider to be compelling long-term opportunities that fit our discipline given the rising risk profiles of many retail businesses and a potential deceleration in goods spending following a period of strength. We also underweight in Financials as those are the companies in that sector who meet our rigorous requirements on a fundamental basis. Given our focus on long-term business fundamentals, patient investment approach and low portfolio turnover, the strategy’s sector positioning generally does not change significantly from quarter to quarter. However, we may take advantage of periods of volatility by adding selectively to certain companies when appropriate.
Disclosures
The opinions expressed herein are those of Aristotle Capital Boston, LLC (Aristotle Boston) and are subject to change without notice.
Past performance is not indicative of future results. The information provided in this report should not be considered financial advice or a recommendation to purchase or sell any particular security. There is no assurance that any securities discussed herein will remain in an account’s portfolio at the time you receive this report or that securities sold have not been repurchased. The securities discussed may not represent an account’s entire portfolio and, in the aggregate, may represent only a small percentage of an account’s portfolio holdings. The performance attribution presented is of a representative account from Aristotle Boston’s Small/Mid Cap Equity Composite. The representative account is a discretionary client account which was chosen to most closely reflect the investment style of the strategy. The criteria used for representative account selection is based on the account’s period of time under management and its similarity of holdings in relation to the strategy. It should not be assumed that any of the securities transactions, holdings or sectors discussed were or will be profitable, or that the investment recommendations or decisions Aristotle Boston makes in the future will be profitable or equal the performance of the securities discussed herein. Aristotle Boston reserves the right to modify its current investment strategies and techniques based on changing market dynamics or client needs. Recommendations made in the last 12 months are available upon request.
Composite returns are presented pure gross and net of the maximum wrap fee and include the reinvestment of all income. Pure gross returns do not reflect the deduction of any trading costs or other fees and are supplemental to the net returns. Net returns are calculated by subtracting the highest applicable wrap/SMA fee, which includes trading costs and custodial fees, from the pure gross monthly composite return (2.00% on an annual basis, or 0.17% monthly).
All investments carry a certain degree of risk, including the possible loss of principal. Investments are also subject to political, market, currency and regulatory risks or economic developments. International investments involve special risks that may in particular cause a loss in principal, including currency fluctuation, lower liquidity, different accounting methods and economic and political systems, and higher transaction costs.
These risks typically are greater in emerging markets. Securities of small‐ and medium‐sized companies tend to have a shorter history of operations, be more volatile and less liquid. Value stocks can perform differently from the market as a whole and other types of stocks.
The material is provided for informational and/or educational purposes only and is not intended to be and should not be construed as investment, legal or tax advice and/or a legal opinion. Investors should consult their financial and tax adviser before making investments.
The opinions referenced are as of the date of publication, may be modified due to changes in the market or economic conditions, and may not necessarily come to pass.
Aristotle Capital Boston, LLC is an independent investment adviser registered under the Investment Advisers Act of 1940, as amended. Registration does not imply a certain level of skill or training. More information about Aristotle Boston, including our investment strategies, fees and objectives, can be found in our Form ADV Part 2, which is available upon request. ACB-2504-22
Performance Disclosures
Sources: CAPS Composite Hub, Russell Investments
Composite returns for periods ended March 31, 2025, are preliminary pending final account reconciliation.
*The Aristotle Small/Mid Cap Equity Composite has an inception date of January 1, 2008, at a predecessor firm. During this time, Jack McPherson and Dave Adams had primary responsibility for managing the strategy. Performance starting January 1, 2015, was achieved at Aristotle Boston.
Past performance is not indicative of future results. Performance results for periods greater than one year have been annualized. Composite returns are presented pure gross and net of the maximum wrap fee and include the reinvestment of all income. Pure gross returns do not reflect the deduction of any trading costs or other fees and are supplemental to the net returns. Net returns are calculated by subtracting the highest applicable wrap/SMA fee, which includes trading costs and custodial fees, from the pure gross monthly composite return (2.00% on an annual basis, or 0.17% monthly). Please see important disclosures enclosed within this document.
Index Disclosures
The Russell 2500 Index is a subset of the Russell 3000® Index representing approximately 10% of the total market capitalization of that index. It includes approximately 2000 of the smallest securities based on a combination of their market cap and current index membership. The Russell 2500 Growth® Index measures the performance of the small/mid cap companies located in the United States that also exhibit a growth probability. The Russell 2500 Value® Index measures the performance of the small/mid cap companies located in the United States that also exhibit a value probability. The volatility (beta) of the composite may be greater or less than the benchmarks. It is not possible to invest directly in these indices.
Related Resources
For more on Small Cap Equity, access the latest resources.
Small cap stocks are attractive relative to large cap stocks across most valuation metrics with value being more attractive than growth. A reacceleration of earnings and sales growth should trigger a new small cap cycle. See our full small cap observations for deeper insights.
Small Caps and Value are Historically Cheap Relative to Large Caps and Growth
As of March 31, 2025
Large caps trade at a premium to small caps not seen since 2001.
Relative P/E (LTM) Russell 1000 vs. Russell 2000
Source: FactSet. Based on trailing 12-month earnings. 9/30/1999 – 3/31/2025.
Small-Cap Value and Mid-Cap Value Remain Cheap Relative to History and Style Peers
As of March 31, 2025
Small vs large: cheap vs. history on most metrics
Sources: BofA U.S. Equity and Quant Strategy; FactSet. P/E (price-to-earnings) measures exclude negative earnings. Forward P/E is based on consensus next 12 month forecas
Small Caps and Value are Historically Cheap Relative to Large Caps and Growth
As of March 31, 2025
Small cap Growth is historically expensive vs. Value on four out of six metrics.
Relative premium to the historical average multiple for Russell 2000 Growth vs. Russell 2000 Value
Sources: BofA Global Research; FactSet. Based on historical multiples, 1985-3/31/2025.
Small Cap Earnings and Sales Projected to Strengthen in 2H25
As of March 31, 2025
Sources: Furey Research Partners; FactSet. Small Cap is represented by the Russell 2000 Index and Large Cap is represented by the S&P 500 Index.
The opinions expressed herein are those of Aristotle Capital Boston (Aristotle Boston) and are subject to change without notice. This material is not financial advice or an offer to purchase or sell any product. Aristotle Boston reserves the right to modify its current investment strategies and techniques based on changing market dynamics or client needs.
All investments carry a certain degree of risk, including the possible loss of principal. Investments are also subject to political, market, currency and regulatory risks or economic developments. International investments involve special risks that may in particular cause a loss in principal, including currency fluctuation, lower liquidity, different accounting methods and economic and political systems, and higher transaction costs. These risks typically are greater in emerging markets. Securities of small- and medium-sized companies tend to have a shorter history of operations, be more volatile and less liquid. Value stocks can perform differently from the market as a whole and other types of stocks. The material is provided for informational and/or educational purposes only and is not intended to be and should not be construed as investment, legal or tax advice and/or a legal opinion. Investors should consult their financial and tax adviser before making investments. The opinions referenced are as of the date of publication, may be modified due to changes in the market or economic conditions, and may not necessarily come to pass. Information and data presented has been developed internally and/or obtained from sources believed to be reliable. Aristotle Boston does not guarantee the accuracy, adequacy or completeness of such information.
Past performance is not indicative of future results. The information provided in this report should not be considered financial advice or a recommendation to purchase or sell any particular security.
Differing historical time periods are selected throughout the presentation as we believe specific periods provide the most informative historical analog for the concepts presented.
The Russell 2000® Index measures the performance of the small cap segment of the U.S. equity universe. The Russell 2000 Index is a subset of the Russell 3000® Index representing approximately 10% of the total market capitalization of that index. It includes approximately 2000 of the smallest securities based on a combination of their market cap and current index membership. The Russell 2000 Growth® Index measures the performance of the small cap companies located in the United States that also exhibit a growth probability. The Russell 2000 Value® Index measures the performance of the small cap companies located in the United States that also exhibit a value probability. The Russell 1000 Index is a subset of the Russell 3000® Index. It includes approximately 1000 of the largest securities based on a combination of their market cap and current index membership. The volatility (beta) of the portfolios may be greater or less than the benchmarks. It is not possible to invest directly in these indices.
Aristotle Capital Boston, LLC is an independent investment adviser registered under the Investment Advisers Act of 1940, as amended. Registration does not imply a certain level of skill or training. More information about Aristotle Boston, including our investment strategies, fees and objectives, can be found in Form ADV Part 2, which is available upon request. ACB-2506-25
Despite challenging market conditions, the Russell 2000 index shows remarkable resilience and potential. Explore our small caps observations to gain strategic insights.
Performance was Challenging during 1Q 2025
As of March 31, 2025
1Q25 was among the worst 10% of all Russell 2000 quarters going back to 1979.
Sources: Furey Research Partners; FactSet.
Historical Performance Following a Russell 2000 Quarterly Decline of More Than 9%
As of March 31, 2025
Sources: Furey Research Partners, FactSet. Based on returns for the Russell 2000 Index from March 1979 to March 2025. Past performance is not indicative of future results.
The Key Is to Stay Invested
As of March 31, 2025
Sources: Furey Research Partners. Rolling forward two-year returns calculated daily. Past performance is not indicative of future results.
The opinions expressed herein are those of Aristotle Capital Boston (Aristotle Boston) and are subject to change without notice. This material is not financial advice or an offer to purchase or sell any product. Aristotle Boston reserves the right to modify its current investment strategies and techniques based on changing market dynamics or client needs.
All investments carry a certain degree of risk, including the possible loss of principal. Investments are also subject to political, market, currency and regulatory risks or economic developments. International investments involve special risks that may in particular cause a loss in principal, including currency fluctuation, lower liquidity, different accounting methods and economic and political systems, and higher transaction costs. These risks typically are greater in emerging markets. Securities of small- and medium-sized companies tend to have a shorter history of operations, be more volatile and less liquid. Value stocks can perform differently from the market as a whole and other types of stocks. The material is provided for informational and/or educational purposes only and is not intended to be and should not be construed as investment, legal or tax advice and/or a legal opinion. Investors should consult their financial and tax adviser before making investments. The opinions referenced are as of the date of publication, may be modified due to changes in the market or economic conditions, and may not necessarily come to pass. Information and data presented has been developed internally and/or obtained from sources believed to be reliable. Aristotle Boston does not guarantee the accuracy, adequacy or completeness of such information.
Past performance is not indicative of future results. The information provided in this report should not be considered financial advice or a recommendation to purchase or sell any particular security.
Differing historical time periods are selected throughout the presentation as we believe specific periods provide the most informative historical analog for the concepts presented.
The Russell 2000® Index measures the performance of the small cap segment of the U.S. equity universe. The Russell 2000 Index is a subset of the Russell 3000® Index representing approximately 10% of the total market capitalization of that index. It includes approximately 2000 of the smallest securities based on a combination of their market cap and current index membership. The volatility (beta) of the portfolios may be greater or less than the benchmark. It is not possible to invest directly in this index.
Aristotle Capital Boston, LLC is an independent investment adviser registered under the Investment Advisers Act of 1940, as amended. Registration does not imply a certain level of skill or training. More information about Aristotle Boston, including our investment strategies, fees and objectives, can be found in Form ADV Part 2, which is available upon request. ACB-2506-15
The volatility observed throughout 2024, persisted into the first quarter of 2025. The Russell 2500 Index declined -7.50% during the quarter, following a strong 2024 with the index returning 11.99%. After a moderately positive start to the quarter, February and March were a more challenging market environment due to uncertainty surrounding the precise parameters and implementation of the new administration’s policies, geopolitical tensions and a higher for longer rate environment. Continued economic growth, a stable labor market and firmer inflation data kept the Federal Reserve (Fed) on the more hawkish course they took in December. Chairman Powell held rates steady at the March FOMC meeting and indicated the Fed will maintain a more measured approach going forward, updating their economic projections and forecasts to two rate cuts in 2025.
Stylistically, value stocks outperformed their growth counterparts during the quarter as the Russell 2500 Value Index returned -5.83% compared to the -10.80% return of the Russell 2500 Growth index. This is a reversal from last year where growth significantly outperformed value.
From a factor performance perspective, the quarter saw a change in market preference to higher-quality companies, favoring dividend-paying, defensive stocks. This change in sentiment was due in part to level interest rates, moderating US economic activity, and an increase in recession risk.
At the sector level, defensive sectors outperformed cyclical sectors, with Utilities (+8.37%), a sector often perceived as a bond proxy, being the only sector in the Russell 2500 Index to post a positive return during the quarter. The worst performing sectors were Information Technology (-16.57%), Consumer Discretionary (-11.77%), Industrials (-10.16%), and Health Care (-8.38%) while Utilities (+8.37%), Materials (-4.92%), Communications (-4.57%), Financials (-3.42%), Energy (-1.92%), Real Estate (-1.67%) and Consumer Staples (-1.02%) performed best.
Sources: CAPS Composite Hub, Russell Investments Past performance is not indicative of future results. Returns are presented gross and net of investment advisory fees and include the reinvestment of all income. Gross returns will be reduced by fees and other expenses that may be incurred in the management of the account. Net returns are presented net of actual investment advisory fees and after the deduction of all trading expenses. Aristotle Small/Mid Cap Equity Composite returns are preliminary pending final account reconciliation. Please see important disclosures at the end of this document.
Performance Review
For the first quarter, the Aristotle Small/Mid Cap Equity Composite generated a total return of -6.40% net of fees (-6.22% gross of fees), outperforming the -7.50% total return of the Russell 2500 Index. Outperformance was driven by security selection in the Health Care, Materials and Information Technology sectors coupled with an underweight allocation to Consumer Discretionary. An underweight to the Utilities sector, along with security selection in Consumer Staples, Consumer Discretionary and Energy detracted from performance.
Relative Contributors
Relative Detractors
Alamos Gold
MACOM Technology Solutions
Huron Consulting Group
Wolverine World Wide
Merit Medical Systems
Ciena Corporation
Chemed Corporation
Chart Industries
AerCap Holdings
ASGN Incorporated
CONTRIBUTORS
Alamos Gold (AGI-CA), engages in the exploration, development, mining and extraction of precious metals. We maintain our investment as we believe in the company’s lower geopolitical risk profile, solid production growth plan from 600k oz to 1M oz per year over the next five years, and strong operational track record.
Huron Consulting Group (HURN), a specialty consulting company that provides financial, operational, and digital consulting services to health care, education and commercial clients, appreciated after delivering strong results highlighted by continued momentum within the company’s health care and commercial segments, more than offsetting the education segment. We maintain our investment, as we believe the company remains well-positioned to capitalize on a demand backdrop aided by financial and operational pressures in its largest end-markets, along with secular tailwinds supporting digital transformation, analytics and cloud consulting.quarter of 2025.
DETRACTORS
MACOM Technology Solutions (MTSI), a designer and manufacturer of high-performance semiconductor products, declined along with the broader semiconductor industry during the quarter. We maintain our position, as we believe the company’s meaningful exposure to growing demand from Data Center and 5G end market applications along with the integration of recent acquisitions should drive additional shareholder value in periods to come.
Wolverine World Wide (WWW), engages in the design, manufacture, and sale of branded casual, active lifestyle, work, outdoor sport, athletic, uniform, footwear, and apparel. The company met expectations but guided lower for FY 2025, punishing the stock price. We maintain our position as we expect improved top-line growth and further net leverage reduction to support the Company’s long-term financial objectives leading to increased shareholder value.
Recent Portfolio Activity
Buys/Acquisitions
Sells/Liquidations
Agree Realty Corporation
Barnes Group
Old National Bancorp
Designer Brands
Valvoline
Nasdaq
Summit Materials
BUYS/ACQUISITIONS
Agree Realty Corporation (ADC), is a real estate investment trust that owns, manages and develops primarily neighborhood community shopping centers and single tenant properties leased to major retail tenants such as Sherwin-Williams, Wal-Mart and TJX Companies. We believe the company’s high-quality portfolio, recession resistant retail categories and strong balance sheet coupled with management’s proactive tenant management and acquisition pipeline will benefit the company on a go-forward basis.
Old National Bancorp (ONB), is a regional bank serving clients primarily in the Midwest and Southeastern U.S. We believe the company’s geographic location, strong balance sheet, increased loan growth and repricing of fixed-rate loans to higher rates will benefit NIMs on a go-forward basis.
Valvoline (VVV), is a pure-play auto quick lube and maintenance service provider with over 2,000 locations in the U.S. and Canada. The company provides quick and convenient stay-in-your-car automotive preventative maintenance through its full-service oil changes from skilled technicians in less than 15minutes. We believe the company will benefit from increased market share gains, driven by both corporate and franchise expansion, growing its scale, accelerating growth and increasing its moat.
SELLS/LIQUIDATIONS
Barnes Group (B), is a globally recognized industrial and aerospace manufacturer and service provider that stands out for its highly engineered products, differentiated industrial technologies, and innovative solutions. The company was acquired and taken private by Apollo Funds.
Designer Brands (DBI), is a North American company which engages in the design, production, and retail of footwear and accessory brands. We sold the position due to what we believed were deteriorating corporate fundamentals.
Nasdaq (NDAQ), is a holding company, which engages in trading, clearing, exchange technology, regulatory, securities listing, information, and public and private company services. We sold the position as the stock had reached our valuation target.
Summit Materials (SUM), is a North American supplier of aggregates, cement, and ready-mix concrete for the construction industry. The company was acquired by Quikrete Holdings, Inc.
Outlook
We remain optimistic about the long-term potential for the SMID-cap segment of the U.S. market. Valuations remain compelling relative to large caps, with the Russell 2500 Index trading near the lower end of its historical range. Potential tailwinds, including deregulation, lower corporate tax rates, increased M&A activity, continued reshoring of U.S. manufacturing, and infrastructure-related spending, could provide additional support for SMID-cap stocks. There may be some short-term volatility as the new administration’s policies are implemented and absorbed by markets. We also remain mindful of risks such as inflation reaccelerating, increased geopolitical tensions, and potential U.S. economic weakness.
Positioning
Our current positioning is a function of our bottom-up security selection process and our ability to identify what we view as attractive investment candidates, regardless of economic sector definitions. Overweights in Information Technology and Industrials are mostly a function of our underlying company specific views rather than any top-down predictions for each sector. Conversely, we continue to be underweight in Consumer Discretionary, as we have been unable to identify what we consider to be compelling long-term opportunities that fit our discipline given the rising risk profiles of many retail businesses and a potential deceleration in goods spending following a period of strength. We also underweight in Financials as those are the companies in that sector who meet our rigorous requirements on a fundamental basis. Given our focus on long-term business fundamentals, patient investment approach and low portfolio turnover, the strategy’s sector positioning generally does not change significantly from quarter to quarter. However, we may take advantage of periods of volatility by adding selectively to certain companies when appropriate.
Disclosures
The opinions expressed herein are those of Aristotle Capital Boston, LLC (Aristotle Boston) and are subject to change without notice.
Past performance is not indicative of future results. The information provided in this report should not be considered financial advice or a recommendation to purchase or sell any particular security. There is no assurance that any securities discussed herein will remain in an account’s portfolio at the time you receive this report or that securities sold have not been repurchased. The securities discussed may not represent an account’s entire portfolio and, in the aggregate, may represent only a small percentage of an account’s portfolio holdings. The performance attribution presented is of a representative account from Aristotle Boston’s Small/Mid Cap Equity Composite. The representative account is a discretionary client account which was chosen to most closely reflect the investment style of the strategy. The criteria used for representative account selection is based on the account’s period of time under management and its similarity of holdings in relation to the strategy. It should not be assumed that any of the securities transactions, holdings or sectors discussed were or will be profitable, or that the investment recommendations or decisions Aristotle Boston makes in the future will be profitable or equal the performance of the securities discussed herein. Aristotle Boston reserves the right to modify its current investment strategies and techniques based on changing market dynamics or client needs. Recommendations made in the last 12 months are available upon request.
Returns are presented gross and net of investment advisory fees and include the reinvestment of all income. Gross returns will be reduced by fees and other expenses that may be incurred in the management of the account. Net returns are presented net of actual investment advisory fees and after the deduction of all trading expenses.
As of December 31, 2014, there were no non-fee-paying accounts in the Composite.
All investments carry a certain degree of risk, including the possible loss of principal. Investments are also subject to political, market, currency and regulatory risks or economic developments. International investments involve special risks that may in particular cause a loss in principal, including currency fluctuation, lower liquidity, different accounting methods and economic and political systems, and higher transaction costs.
These risks typically are greater in emerging markets. Securities of small‐ and medium‐sized companies tend to have a shorter history of operations, be more volatile and less liquid. Value stocks can perform differently from the market as a whole and other types of stocks.
The material is provided for informational and/or educational purposes only and is not intended to be and should not be construed as investment, legal or tax advice and/or a legal opinion. Investors should consult their financial and tax adviser before making investments.
The opinions referenced are as of the date of publication, may be modified due to changes in the market or economic conditions, and may not necessarily come to pass.
Aristotle Capital Boston, LLC is an independent investment adviser registered under the Investment Advisers Act of 1940, as amended. Registration does not imply a certain level of skill or training. More information about Aristotle Boston, including our investment strategies, fees and objectives, can be found in our Form ADV Part 2, which is available upon request. ACB-2504-20
Performance Disclosures
Sources: CAPS Composite Hub, Russell Investments
Composite returns for periods ended March 31, 2025, are preliminary pending final account reconciliation.
*The Aristotle Small/Mid Cap Equity Composite has an inception date of January 1, 2008, at a predecessor firm. During this time, Jack McPherson and Dave Adams had primary responsibility for managing the strategy. Performance starting January 1, 2015, was achieved at Aristotle Boston.
As of December 31, 2014, there were no non-fee-paying accounts in the Composite. Past performance is not indicative of future results. Performance results for periods greater than one year have been annualized.
Returns are presented gross and net of investment advisory fees and include the reinvestment of all income. Gross returns will be reduced by fees and other expenses that may be incurred in the management of the account. Net returns are presented net of actual investment advisory fees and after the deduction of all trading expenses. Please see important disclosures enclosed within this document.
Index Disclosures
The Russell 2500 Index is a subset of the Russell 3000® Index representing approximately 10% of the total market capitalization of that index. It includes approximately 2000 of the smallest securities based on a combination of their market cap and current index membership. The Russell 2500 Growth® Index measures the performance of the small/mid cap companies located in the United States that also exhibit a growth probability. The Russell 2500 Value® Index measures the performance of the small/mid cap companies located in the United States that also exhibit a value probability. The volatility (beta) of the composite may be greater or less than the benchmarks. It is not possible to invest directly in these indices.
(All MSCI index returns are shown net and in U.S. dollars unless otherwise noted.)
Markets Review
Sources: CAPS CompositeHubTM, Bloomberg
Past performance is not indicative of future results. Aristotle International Equity Composite returns are presented gross and net of investment advisory fees and include the reinvestment of all income. Gross returns will be reduced by fees and other expenses that may be incurred in the management of the account. Net returns are presented net of actual investment advisory fees and after the deduction of all trading expenses. Aristotle Capital Composite returns are preliminary pending final account reconciliation. Please see important disclosures at the end of this document.
Global equity markets started the year on a modestly negative note, with the MSCI ACWI Index returning ‑1.32% for the first quarter. In contrast, global fixed income gained ground, as the Bloomberg Global Aggregate Bond Index rose 2.64%. Value stocks outpaced growth over the quarter, with the MSCI ACWI Value Index outperforming the MSCI ACWI Growth Index by 11.59%.
Outside the U.S., international equities made strong gains versus their American counterparts. The MSCI EAFE Index rose 6.86% during the first quarter, while the MSCI ACWI ex USA Index climbed 5.23%. Within the MSCI EAFE Index, Europe & Middle East and the U.K. were the strongest performers, while Asia increased the least. On a sector basis, nine out of the eleven sectors within the MSCI EAFE Index posted positive returns, with Energy, Financials and Utilities generating the largest gains. Conversely, Information Technology, Consumer Discretionary and Real Estate performed the worst.
Inflation trends remained broadly stable across developed markets. The U.S., U.K., and EU all reported annual inflation below 3%, giving central banks greater flexibility. The Federal Reserve held rates steady, while the European Central Bank and Bank of England continued to ease monetary policy in response to softer growth signals. In Asia, China’s economy recorded 5% GDP growth in 2024, showing tentative signs of recovery, while the Bank of Japan raised interest rates for the third time since ending its negative interest rate policy in March 2024 on expectations of sustained 2% inflation.
Trade policy re-emerged as a market concern during the quarter. In his first months back in office, President Trump announced a new wave of tariffs on imports from Canada, Mexico and China, with additional warnings directed at the EU and other trading partners over what were termed “imbalanced trade arrangements.” The targeted industries—autos, steel and aluminum—reflected a focus on reshoring and industrial policy. While the long-term impact is still unfolding, the renewed trade uncertainty prompted central banks to lower growth forecasts and adopt a more cautious tone on future rate moves.
In Europe, Germany’s economy remained under pressure after contracting for a second consecutive year in 2024—the first two-year contraction since 2003. In response, Chancellor-designate Friedrich Merz proposed sweeping fiscal reforms, including an overhaul of the constitutional debt brake, a €500 billion infrastructure fund and increased defense spending. While potentially supportive of medium-term growth, these initiatives have raised concerns around inflation and fiscal discipline, adding complexity to the European Central Bank’s policy path.
On the geopolitical front, a fragile ceasefire between Israel and Hamas in January unraveled by March amid disagreements over hostage releases. In Ukraine, a military stalemate in the east opened the door for ceasefire negotiations brokered by the U.S., with discussions reportedly tied to a potential minerals agreement to offset financial aid.
Finally, the artificial intelligence (AI) theme continued to influence market narratives. Chinese startup DeepSeek gained international attention after launching a low-cost rival to leading generative AI models from OpenAI, Anthropic and Google. The move not only intensified competition but raised new questions about the durability and configuration of global AI supply chains. Notably, DeepSeek’s approach—achieving comparable performance at a fraction of the cost—has challenged assumptions around the infrastructure demands of generative AI, potentially reducing the need for GPUs, energy-intensive data centers and the broader hardware stack the market had expected would underpin AI growth.
Performance and Attribution Summary
For the first quarter of 2025, Aristotle Capital’s International Equity Composite posted a total return of 3.62% gross of fees (3.50% net of fees), underperforming the MSCI EAFE Index, which returned 6.86%, and the MSCI ACWI ex USA Index, which returned 5.23%. Please refer to the table below for detailed performance.
Performance (%)
1Q25
1 Year
3 Years
5 Years
10 Years
Since Inception*
International Equity Composite (gross)
3.62
6.09
4.97
12.10
6.34
5.80
International Equity Composite (net)
3.50
5.60
4.49
11.57
5.84
5.30
MSCI EAFE Index (net)
6.86
4.88
6.05
11.77
5.40
3.18
MSCI ACWI ex USA Index (net)
5.23
6.09
4.48
10.92
4.98
2.80
*The inception date for the International Equity Composite is January 1, 2008. Past performance is not indicative of future results. Aristotle International Equity Composite returns are presented gross and net of investment advisory fees and include the reinvestment of all income. Gross returns will be reduced by fees and other expenses that may be incurred in the management of the account. Net returns are presented net of actual investment advisory fees and after the deduction of all trading expenses. Aristotle Capital Composite returns are preliminary pending final account reconciliation. Please see important disclosures at the end of this document.
Source: FactSet
Past performance is not indicative of future results. Sector attribution shows how much of a portfolio’s overall return is directly attributable to stock selection and asset allocation decisions within the portfolio, highlighting which sectors contributed or detracted to the total return. Attribution includes the reinvestment of income.
From a sector perspective, the portfolio’s underperformance relative to the MSCI EAFE Index can be attributed to both security selection and allocation effects. Security selection in Financials, Energy and Industrials detracted the most from the portfolio’s relative performance. Conversely, security selection in Health Care, Consumer Discretionary and Information Technology contributed to relative returns.
Regionally, both allocation effects and security selection were responsible for the portfolio’s underperformance. Exposure to Canada and security selection in the U.K. detracted the most from relative performance, while security selection and an underweight in Asia contributed.
Contributors and Detractors for 1Q 2025
Relative Contributors
Relative Detractors
Munich Reinsurance
Cameco
Nemetschek
Brookfield
Sony
Accenture
Safran
Ashtead Group
Roche
Diageo
Cameco, one of the world’s largest uranium producers, was a primary detractor during the quarter. Shares of the Canada-based company declined following President Trump’s 10% tariff on Canadian energy exports to the U.S., where Cameco is a major uranium supplier. However, we believe these tariff concerns are overstated given the inelastic nature of uranium demand and the lack of substitutes. Any incremental costs would be absorbed by utilities under existing contract structures. While the company’s stock price may have followed the decline in uranium spot prices during the period, Cameco’s business is largely insulated from short-term price swings due to its extensive use of long-term contracts rather than spot-market sales. Moreover, the company’s tier-one assets in politically stable jurisdictions, operational track record and ability to flex production—particularly at its MacArthur River and Key Lake mines—further strengthen its competitive advantage. We believe Cameco remains exceptionally well-positioned to benefit as governments around the world increasingly turn to nuclear power as a clean, secure and scalable source of energy.
Accenture, the global IT services and consulting firm, was one of the largest detractors during the period. The company reported revenue at the top end of its guided range, supported by solid booking, particularly in large-scale transformational projects from major corporate clients. Despite these results, shares declined as investor sentiment was impacted by continued client caution amid heightened global uncertainty, including concerns around tariffs and consumer sentiment, as well as the U.S. administration’s initiative to streamline federal operations, which could result in canceled or delayed government contracts. We believe Accenture is well-positioned to support the federal government’s efficiency goals through its expertise and proven track record in delivering innovative, cost-effective solutions. Accenture has also continued to see traction in emerging areas such as generative AI, securing $1.4 billion in new bookings and generating approximately $600 million in related revenue during the quarter. Short-term fluctuations in consulting demand are not unusual, and we remain confident that Accenture’s global scale and deep expertise make it well-positioned to continue to provide solutions and deepen its partnerships with many of the world’s largest companies as they continue to implement increasingly sophisticated technologies.
Munich Re, the world’s largest reinsurance company, was a leading contributor for the quarter. The company delivered strong results despite absorbing €1.2 billion in claims from January’s California wildfires, a testament to the reinsurer’s prudent risk management. Demonstrating confidence in its ongoing profitability and robust capital position, Munich Re also raised its dividend by more than 30% and announced an expanded €2 billion share buyback program. Favorable market pricing and disciplined underwriting have continued to support profitability, even amid elevated volatility in capital markets and global catastrophe losses. Additionally, Munich Re’s experienced leadership team has placed an unusual emphasis on innovation for a reinsurer of its size, investing meaningfully in R&D and technology. For example, the company has identified, launched or already implemented over 300 AI use cases that aim to increase efficiency and enhance its competitive edge. We expect these initiatives to further support Munich Re’s continued market share gains across specialty lines, including cybersecurity, and in rapidly growing Asian markets where insurance penetration remains relatively low.
Sony, the global leader in video games, image sensors, music and movies, was a top contributor for the period. The company delivered strong quarterly results, driven primarily by its gaming and music businesses, and announced a new executive leadership structure. In gaming, Sony reported a record-high 129 million monthly active users, a 20% year-over-year increase in PlayStation Plus revenue and an expanding user base, as 40% of new PS5 console buyers were new to the platform. The Music segment also continued to benefit from global streaming tailwinds, delivering double-digit profit growth. In a significant leadership transition, Sony announced that, effective April 1, 2025, Hiroki Totoki, currently COO and CFO, would succeed Kenichiro Yoshida as CEO. Our original investment in Sony was grounded in the strategic transformation led by Yoshida-san, where Totoki-san was an instrumental partner in driving Sony’s pivot away from commoditized businesses whilespearheading investments in content IP and semiconductors. Looking ahead, we continue to see opportunity for Sony to capitalize on its unique position as both a content creator and platform owner. The company’s ability to integrate gaming, music, anime and film and leverage IP across platforms (e.g., Crunchyroll and its recent partnership with Kadokawa) should position it well for long-term value creation.
Recent Portfolio Activity
Buys
Sells
Fast Retailing
Magna International
During the quarter, we sold our position in Magna International and invested in Fast Retailing.
We first invested in Magna International, a Canada-based global auto parts, systems and assembly company, in the fourth quarter of 2019. The company, in our opinion, has a unique capability of supplying parts for an increasingly electrified and autonomous fleet of vehicles. This includes Magna’s specialty in lightweighting vehicles—a necessity for heavy electric cars—as well as its years of investment in self-driving technologies. In addition, with leading market share positions in many of its core markets and products, we believe Magna remains well-positioned to benefit as content-per-vehicle increases and automotive parts and systems become more complex. Though the company continues to meet our Quality and Valuation criteria, we have diminished confidence in its Catalysts. As such, we exited our position in Magna to fund the purchase of Fast Retailing, which we view as a more optimal investment.
Fast Retailing Co., Ltd
Founded in 1984 and headquartered in Japan, Fast Retailing is one of the world’s largest apparel companies. Best known for its flagship brand UNIQLO, the company has over 3,500 stores worldwide, generating approximately 40% of sales in Japan, 20% in China and the remainder across the U.S., Europe and other Asian markets. UNIQLO (originally “Unique Clothing Warehouse”) accounts for roughly 85% of sales, with the remaining 15% coming from brands such as GU, Theory and others.
Fast Retailing is often grouped with “fast fashion” competitors such as Zara (owned by Inditex) and H&M. However, Fast Retailing’s strategy is fundamentally different. While fast fashion brands focus on rapidly turning over the latest trends—often at the expense of quality—Fast Retailing emphasizes timeless, high-quality apparel at accessible prices. Its LifeWear philosophy prioritizes functionality, comfort and durability, with innovations such as HeatTech for warmth and AIRism for breathability making its clothes essential wardrobe staples rather than disposable fashion. This focus on innovation, quality and affordability has helped Fast Retailing build a globally recognized brand with a history of profitable expansion in and outside Japan.
While this is our first time investing in Fast Retailing, we have followed the company for over a decade, having previously invested in Toray Industries, which produces many of the proprietary fabrics that underpin UNIQLO’s appeal. Given its long-term growth potential and operational strengths, we believe now is the right time to invest.
High-Quality Business
Some of the quality characteristics we have identified for Fast Retailing include:
Economies of scale achieved with a strategy that focuses on functionality, quality and value (rather than rapidly changing fashion trends) contribute to above peer profitability;
Globally recognized brand with a history of profitable expansion within Japan and internationally;
Technology-driven innovation in materials, inventory, logistics and supply chain management; and
Long-tenured management team with unusually high insider ownership.
Attractive Valuation
Based on our estimates, shares of the company are attractively valued. We believe continued overseas expansion, as well as other catalysts (see below), will likely lead to higher normalized margins and FREE cash flow than currently appreciated by the market.
Catalysts
Catalysts we have identified for Fast Retailing, which we believe will cause its stock price to appreciate over our three- to five-year investment horizon, include:
Continued overseas expansion should drive higher normalized revenue and profitability;
Operational improvements in China, including better inventory management and an optimized store footprint, are expected to enhance margins; and
Improved performance at GU brand in Asia, as well as expansion into the U.S.
Conclusion
As we progress through the early stages of 2025, the convergence of persistent macroeconomic forces with the renewed presence of trade conflicts has added to the uncertainty facing equity markets. While there certainly was no shortage of headlines during the quarter, we believe trying to time the market or to predict the impact of these developments is a futile task. Instead, our focus remains on evaluating whether these events are truly analyzable, materially differentiated and meaningful to long-term investors—or simply noise that fuels short-term speculation.
At Aristotle Capital, we do not aim to capture short-term gains by “trading” portfolios based on the news of the day. Rather, we remain committed to identifying companies we believe exhibit high-quality characteristics and the resilience to perform across full market cycles. In our experience, breaking news is often fleeting and not quite as impactful as many market participants believe it to be. On the contrary, during periods of economic uncertainty high-quality companies are oftentimes able to make decisions that result in market share gains, thus, potentially, increasing their longer-term intrinsic worth. As such, we will continue to study the microeconomic decisions of individual businesses rather than attempt to predict macroeconomic events or outcomes.
Disclosures
The opinions expressed herein are those of Aristotle Capital Management, LLC (Aristotle Capital) and are subject to change without notice. Past performance is not a guarantee or indicator of future results. This material is not financial advice or an offer to buy or sell any product. You should not assume that any of the securities transactions, sectors or holdings discussed in this report were or will be profitable, or that recommendations Aristotle Capital makes in the future will be profitable or equal the performance of the securities listed in this report. The portfolio characteristics shown relate to the Aristotle International Equity strategy. Not every client’s account will have these characteristics. Aristotle Capital reserves the right to modify its current investment strategies and techniques based on changing market dynamics or client needs. There is no assurance that any securities discussed herein will remain in an account’s portfolio at the time you receive this report or that securities sold have not been repurchased. The securities discussed may not represent an account’s entire portfolio and, in the aggregate, may represent only a small percentage of an account’s portfolio holdings. The performance attribution presented is of a representative account from Aristotle Capital’s International Equity Composite. The representative account is a discretionary client account which was chosen to most closely reflect the investment style of the strategy. The criteria used for representative account selection is based on the account’s period of time under management and its similarity of holdings in relation to the strategy. Recommendations made in the last 12 months are available upon request.
Returns are presented gross and net of investment advisory fees and include the reinvestment of all income. Gross returns will be reduced by fees and other expenses that may be incurred in the management of the account. Net returns are presented net of actual investment advisory fees and after the deduction of all trading expenses.
All investments carry a certain degree of risk, including the possible loss of principal. Investments are also subject to political, market, currency and regulatory risks or economic developments. International investments involve special risks that may in particular cause a loss in principal, including currency fluctuation, lower liquidity, different accounting methods and economic and political systems, and higher transaction costs. These risks typically are greater in emerging markets. Securities of small‐ and medium‐sized companies tend to have a shorter history of operations, be more volatile and less liquid. Value stocks can perform differently from the market as a whole and other types of stocks.
The material is provided for informational and/or educational purposes only and is not intended to be and should not be construed as investment, legal or tax advice and/or a legal opinion. Investors should consult their financial and tax adviser before making investments. The opinions referenced are as of the date of publication, may be modified due to changes in the market or economic conditions, and may not necessarily come to pass. Information and data presented has been developed internally and/or obtained from sources believed to be reliable. Aristotle Capital does not guarantee the accuracy, adequacy or completeness of such information.
Aristotle Capital Management, LLC is an independent registered investment adviser under the Advisers Act of 1940, as amended. Registration does not imply a certain level of skill or training. More information about Aristotle Capital, including our investment strategies, fees and objectives, can be found in our Form ADV Part 2, which is available upon request. ACM-2503-130
Performance Disclosures
Composite returns for all periods ended March 31, 2025 are preliminary pending final account reconciliation.
Past performance is not indicative of future results. The information provided should not be considered financial advice or a recommendation to purchase or sell any particular security or product. Performance results for periods greater than one year have been annualized.
Returns are presented gross and net of investment advisory fees and include the reinvestment of all income. Gross returns will be reduced by fees and other expenses that may be incurred in the management of the account. Net returns are presented net of actual investment advisory fees and after the deduction of all trading expenses.
Index Disclosures
The MSCI EAFE Index (Europe, Australasia, Far East) is a free float-adjusted market capitalization-weighted index that is designed to measure the equity market performance of developed markets, excluding the United States and Canada. The MSCI EAFE Index consists of the following 21 developed market country indexes: Australia, Austria, Belgium, Denmark, Finland, France, Germany, Hong Kong, Ireland, Israel, Italy, Japan, the Netherlands, New Zealand, Norway, Portugal, Singapore, Spain, Sweden, Switzerland and the United Kingdom. The MSCI ACWI captures large and mid-cap representation across 23 developed market countries and 24 emerging markets countries. With approximately 2,600 constituents, the Index covers approximately 85% of the global investable equity opportunity set. The MSCI ACWI Growth Index captures large and mid-cap securities exhibiting overall growth style characteristics across 23 developed markets countries and 24 emerging markets countries. The MSCI ACWI Value Index captures large and mid-cap securities exhibiting overall value style characteristics across 23 developed markets countries and 24 emerging markets countries. The MSCI ACWI ex USA Index captures large and mid-cap representation across 22 of 23 developed markets countries (excluding the United States) and 24 emerging markets countries. With approximately 2,000 constituents, the Index covers approximately 85% of the global equity opportunity set outside the United States. The MSCI Emerging Markets Index is a free float-adjusted market capitalization-weighted index that is designed to measure the equity market performance of emerging markets. The MSCI Emerging Markets Index consists of the following 24 emerging market country indexes: Brazil, Chile, China, Colombia, Czech Republic, Egypt, Greece, Hungary, India, Indonesia, Korea, Kuwait, Malaysia, Mexico, Peru, Philippines, Poland, Qatar, Saudi Arabia, South Africa, Taiwan, Thailand, Turkey and United Arab Emirates. The S&P 500® Index is the Standard & Poor’s Composite Index of 500 stocks and is a widely recognized, unmanaged index of common stock prices. The Brent Crude Oil Index is a major trading classification of sweet light crude oil that serves as a major benchmark price for purchases of oil worldwide. The MSCI Japan Index is designed to measure the performance of the large and mid-cap segments of the Japanese market. With approximately 200 constituents, the Index covers approximately 85% of the free float-adjusted market capitalization in Japan. The Bloomberg Global Aggregate Bond Index is a flagship measure of global investment grade debt from 27 local currency markets. This multi-currency benchmark includes treasury, government-related, corporate and securitized fixed-rate bonds from both developed and emerging markets issuers. The MSCI United Kingdom Index is designed to measure the performance of the large and mid-cap segments of the U.K. market. With nearly 100 constituents, the Index covers approximately 85% of the free float-adjusted market capitalization in the United Kingdom. The MSCI Europe Index captures large and mid-cap representation across 15 developed markets countries in Europe. With approximately 400 constituents, the Index covers approximately 85% of the free float-adjusted market capitalization across the European developed markets equity universe. These indexes have been selected as the benchmarks and are used for comparison purposes only. The volatility (beta) of the Composite may be greater or less than the respective benchmarks. It is not possible to invest directly in these indexes.

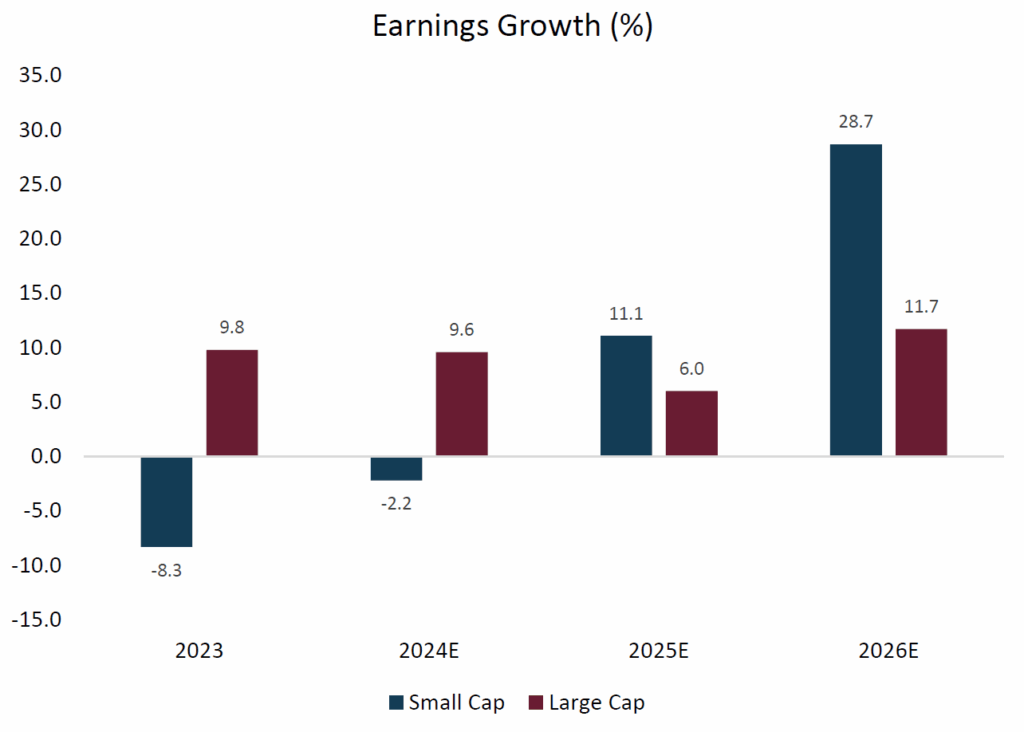
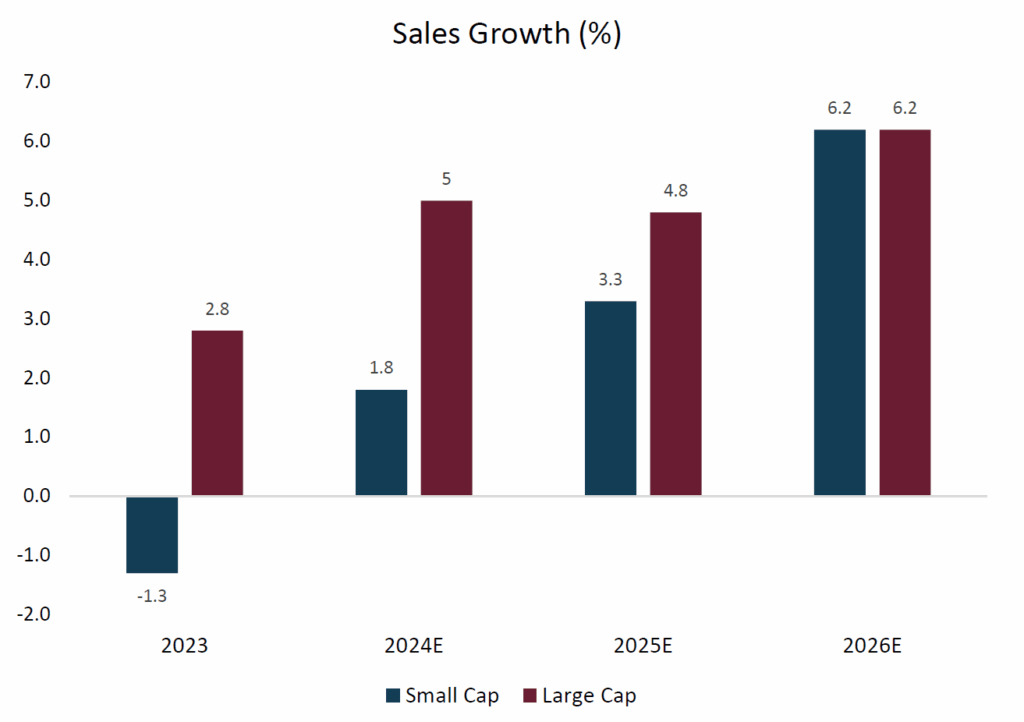
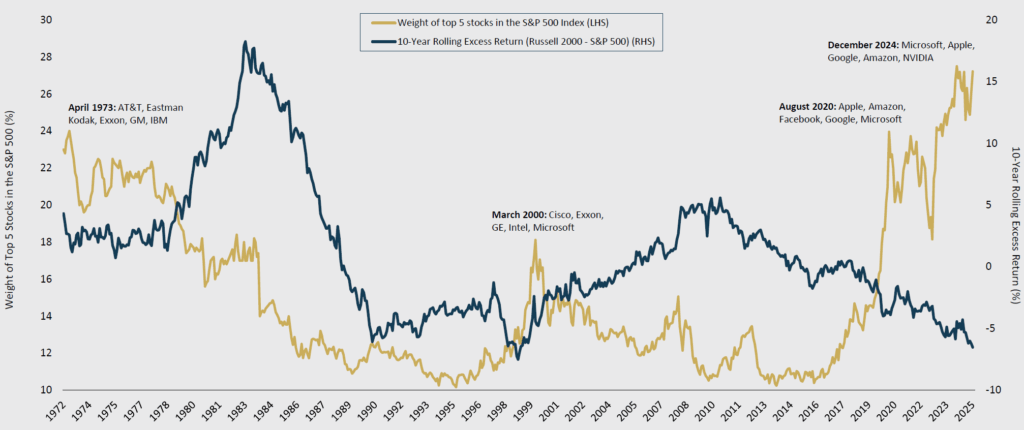
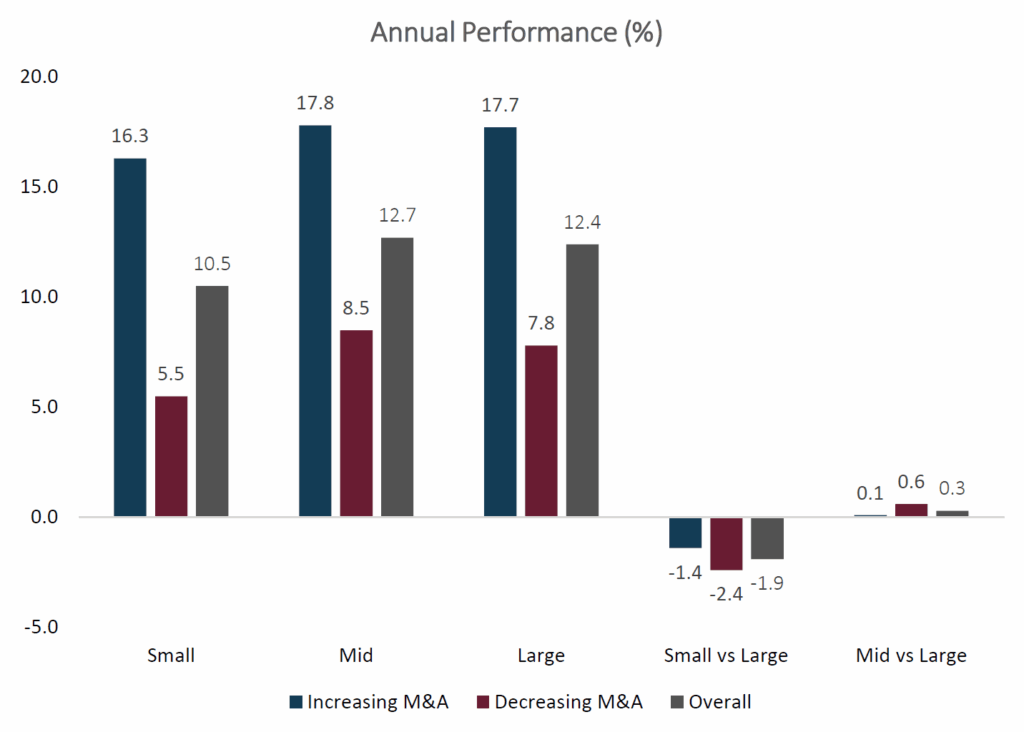
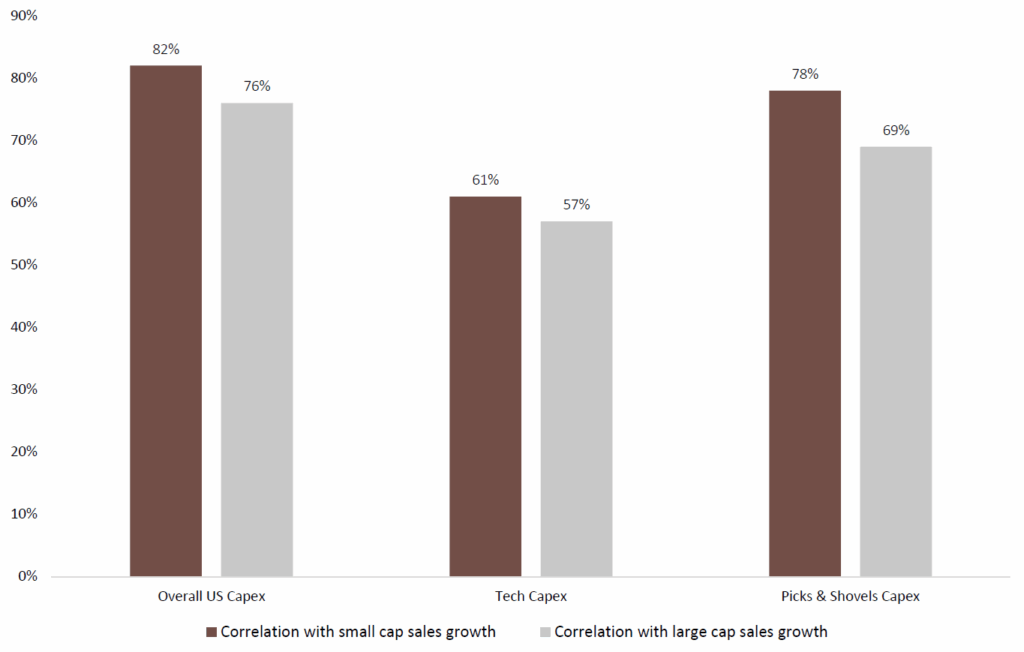


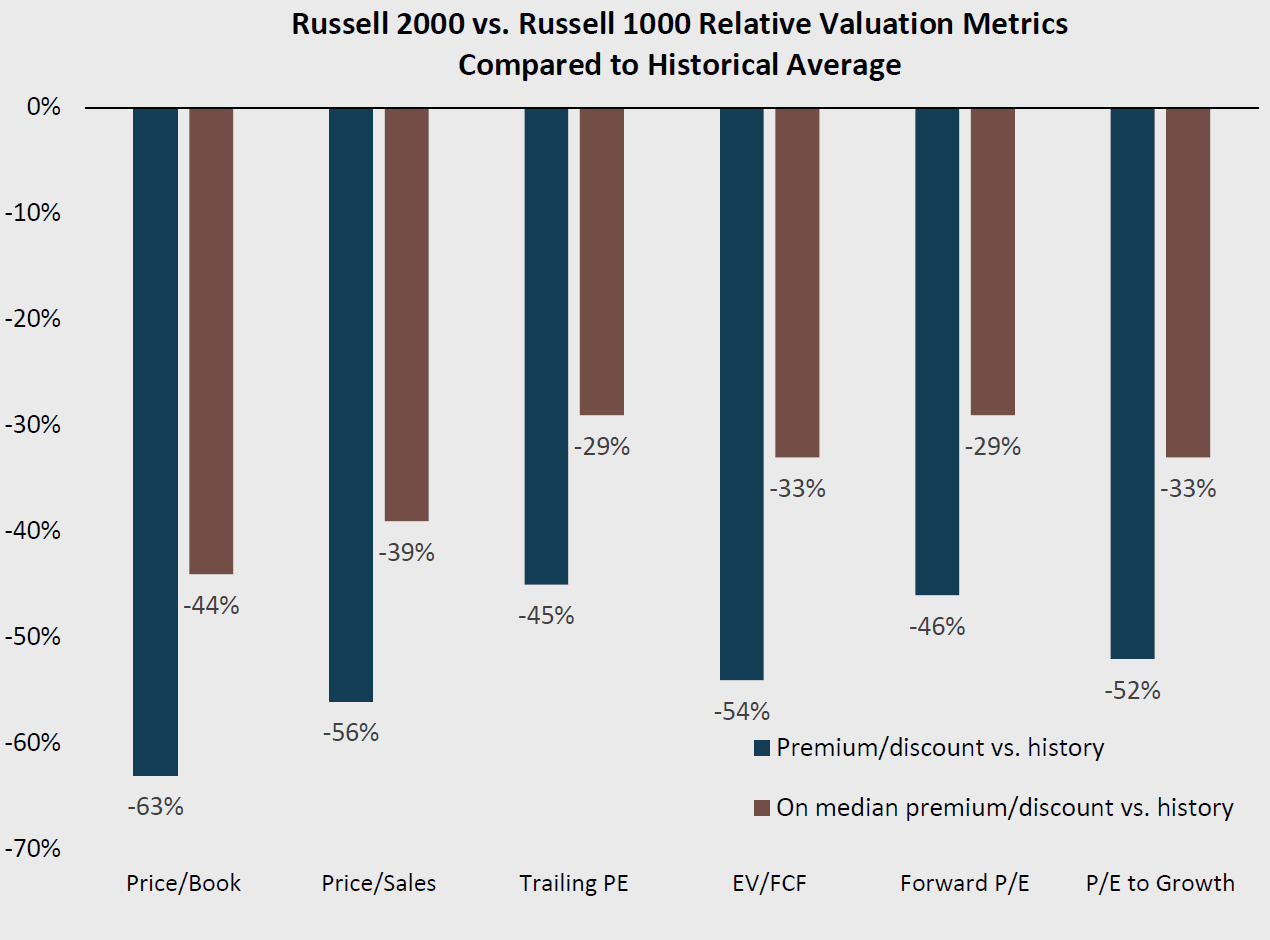

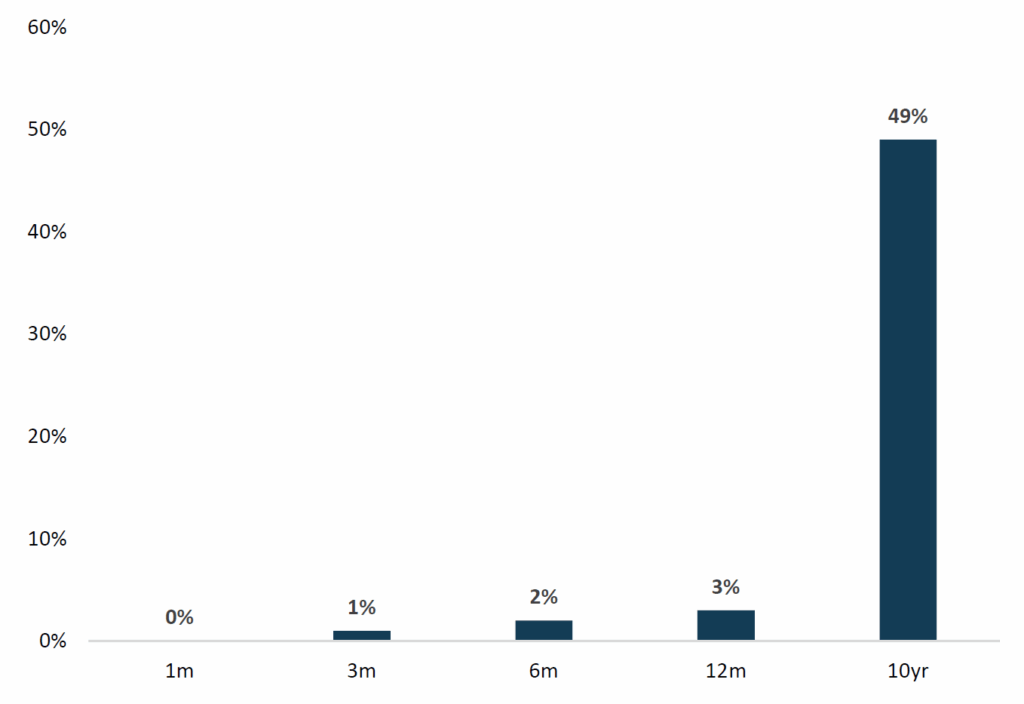
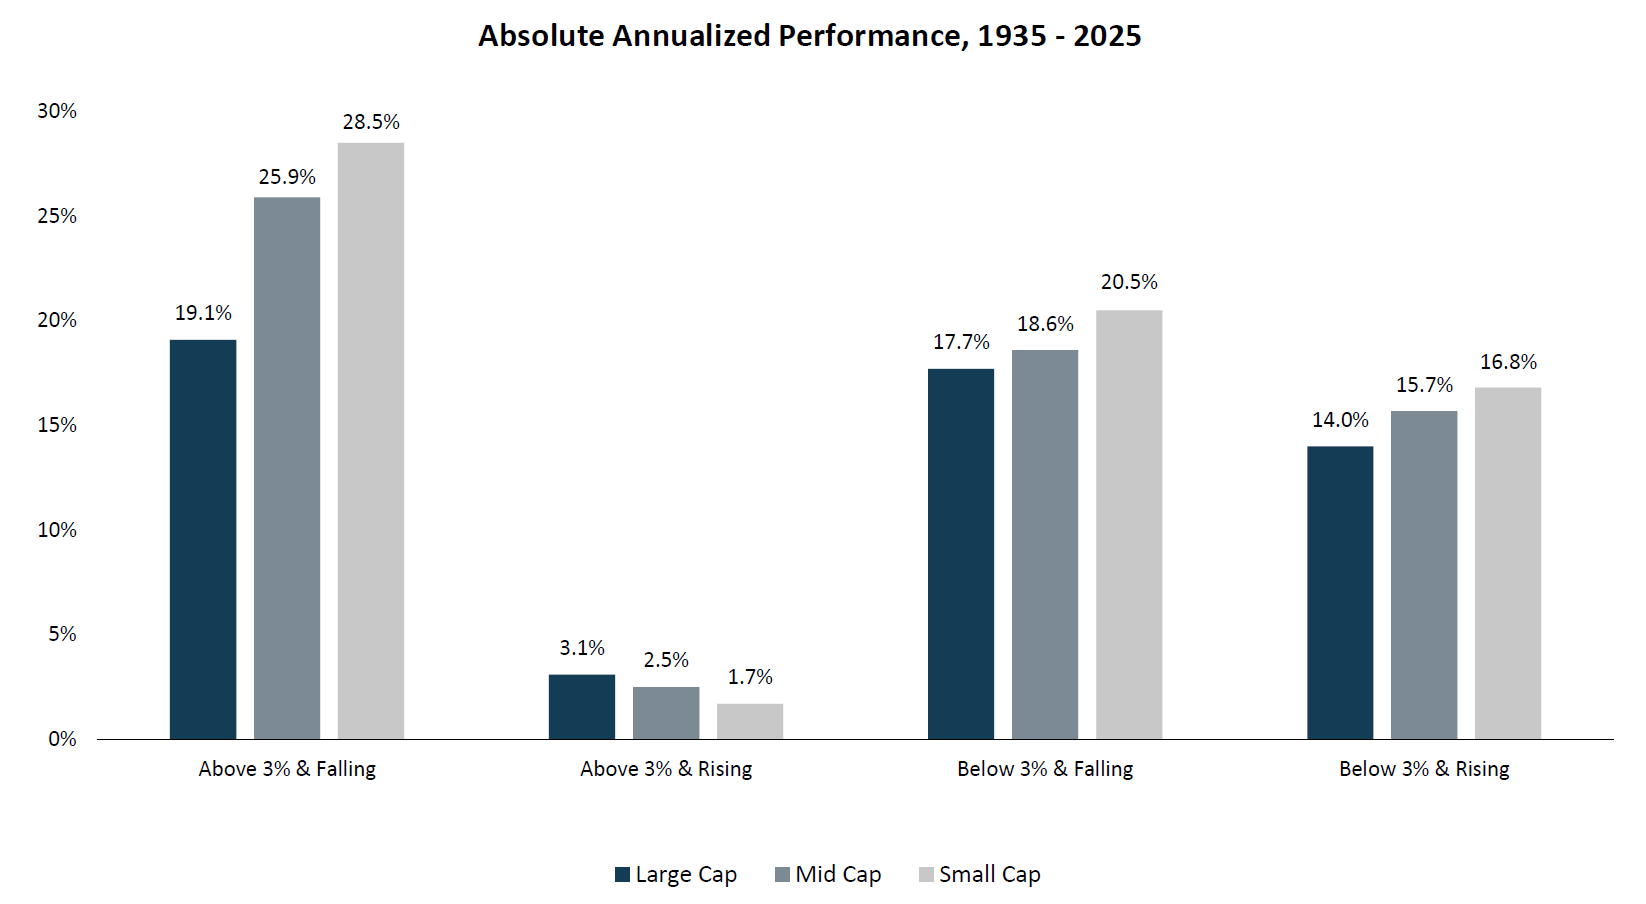

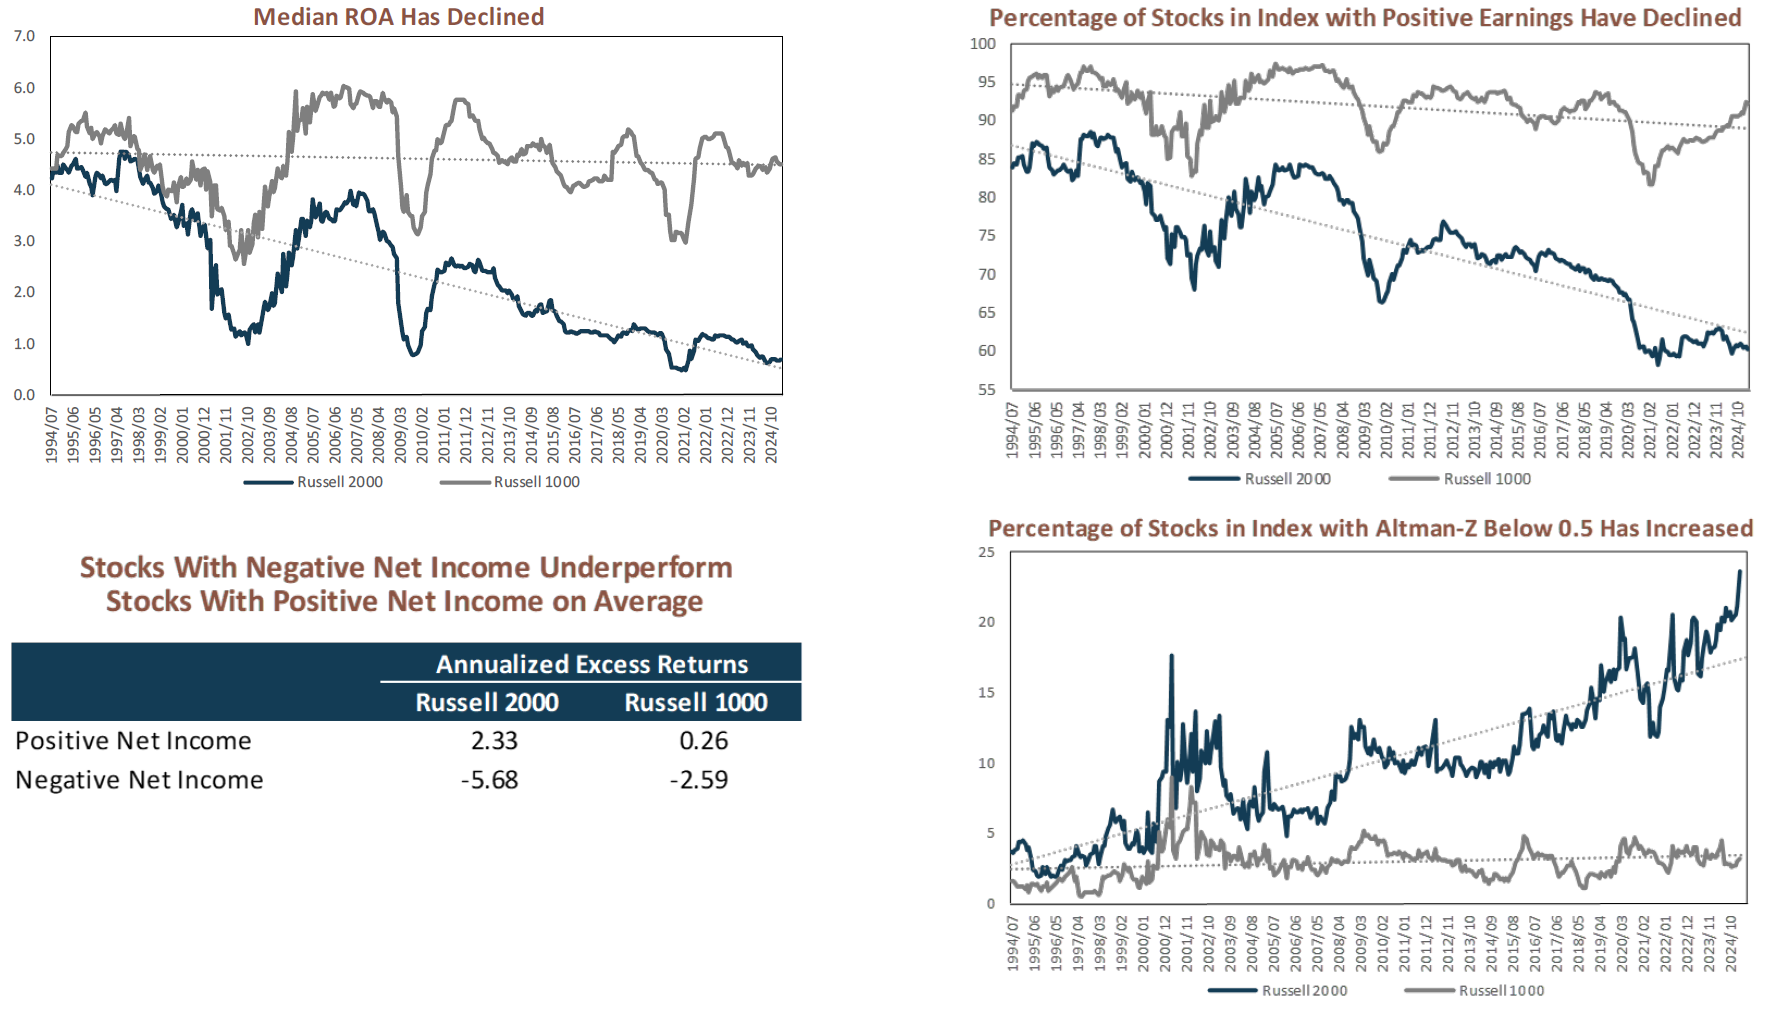
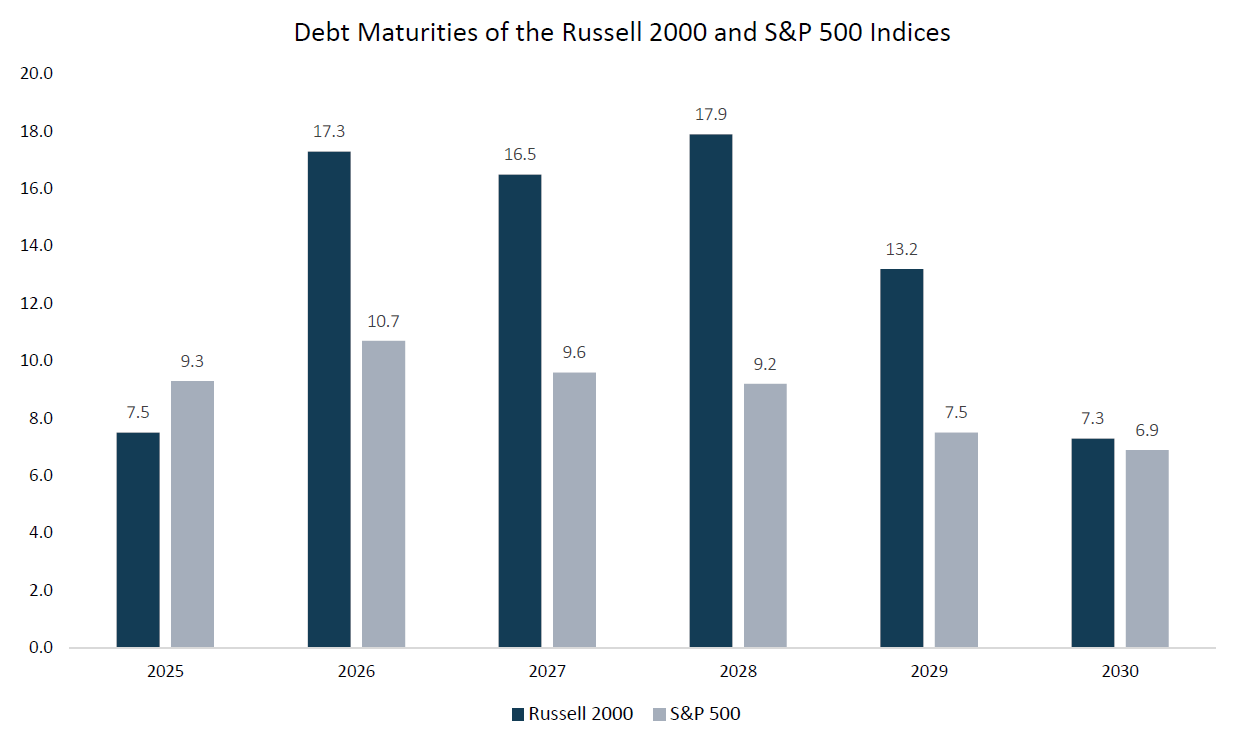
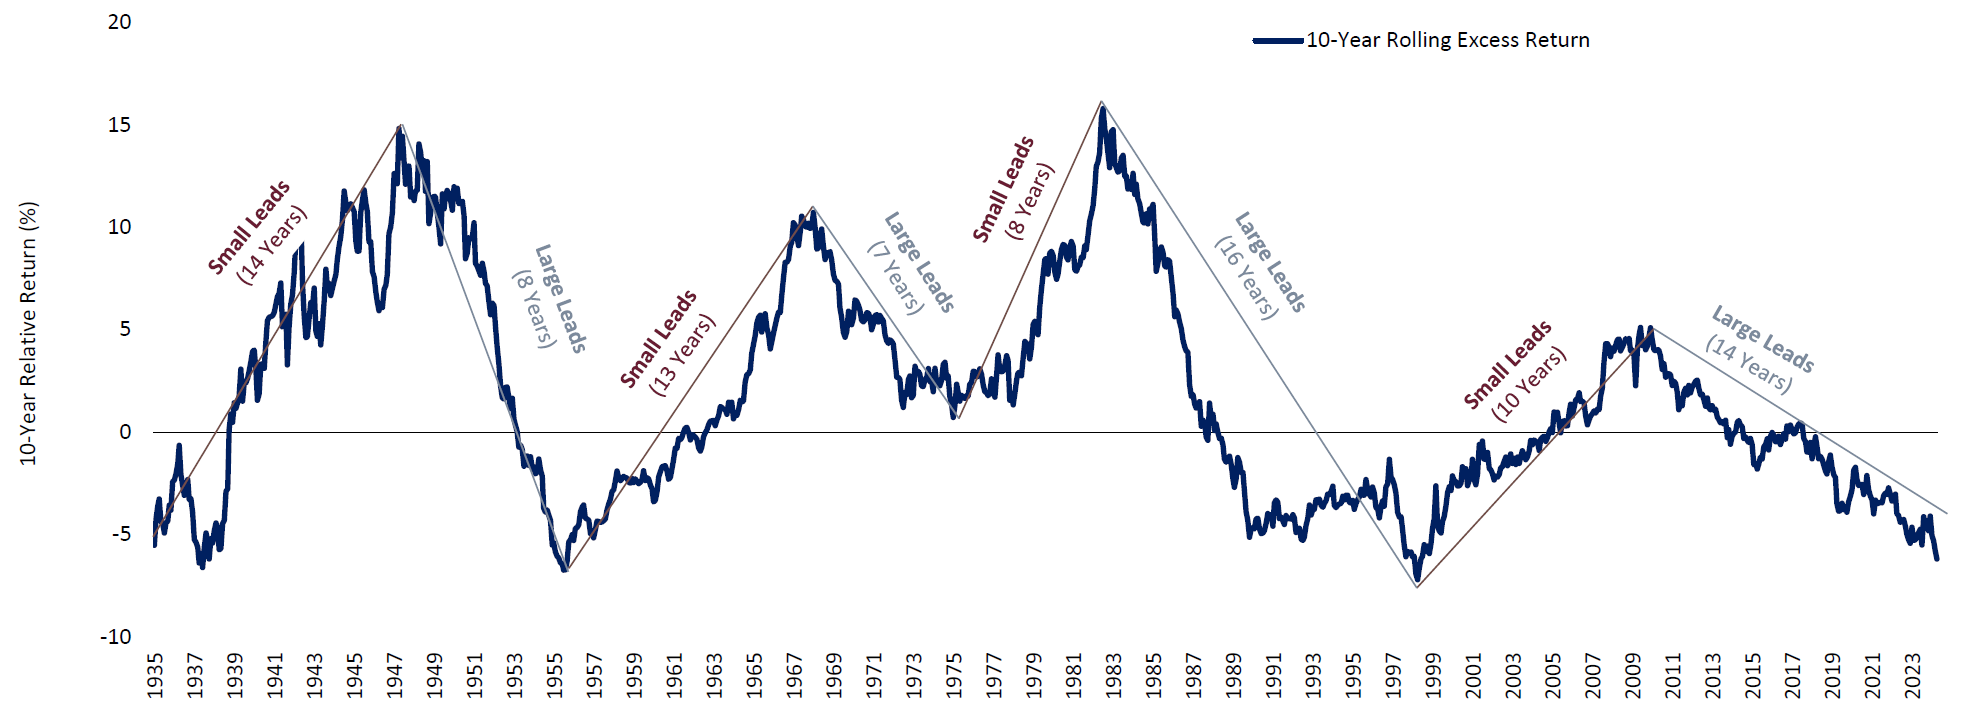
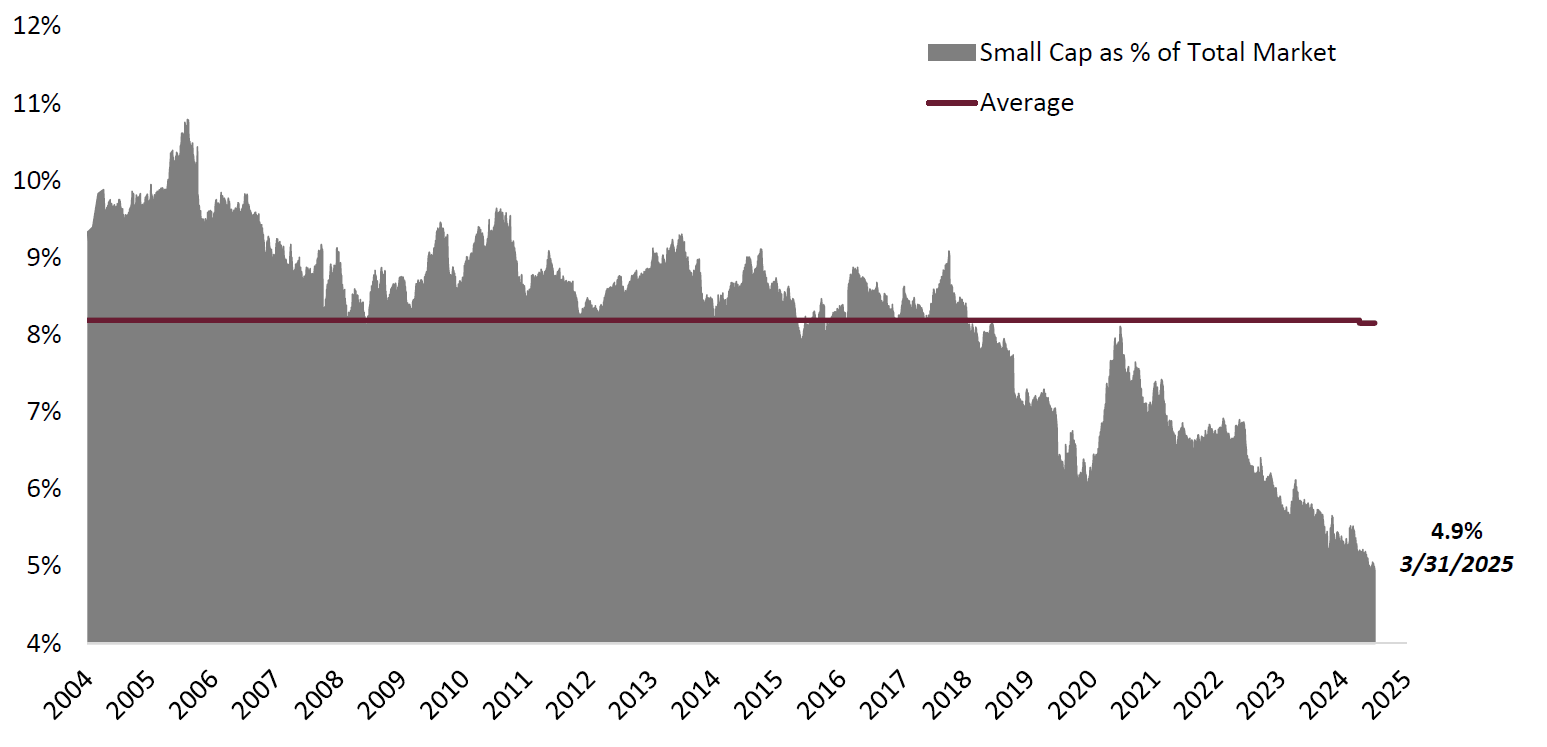
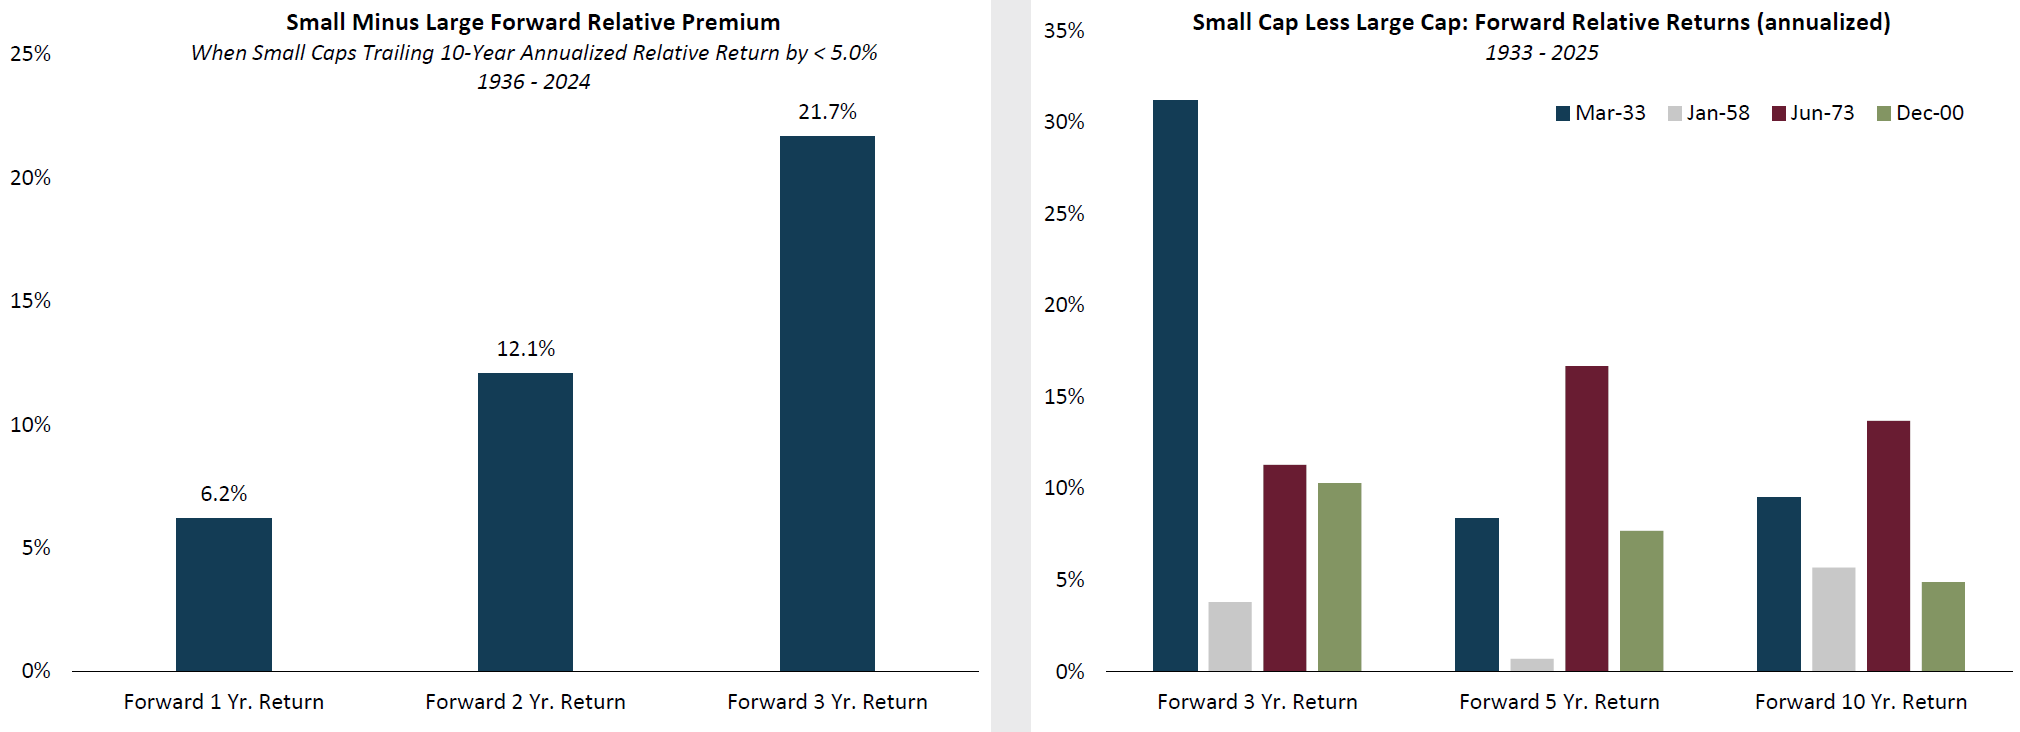
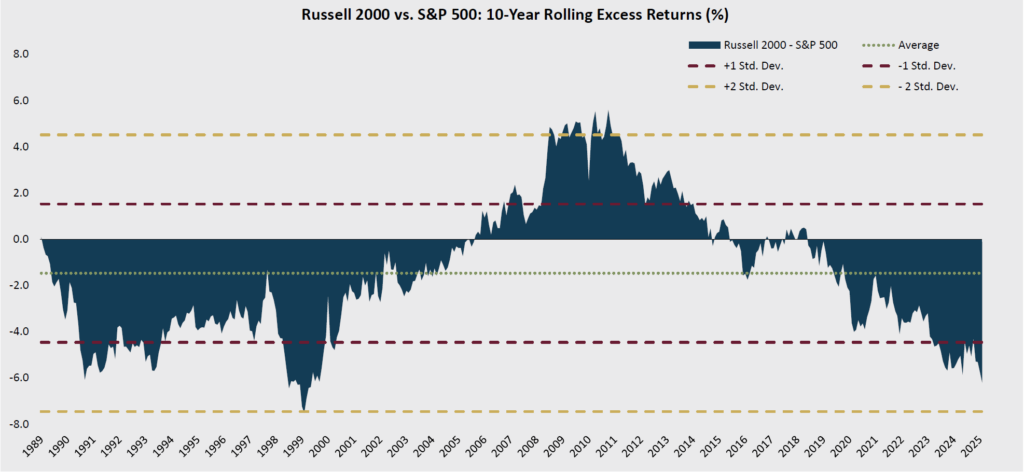
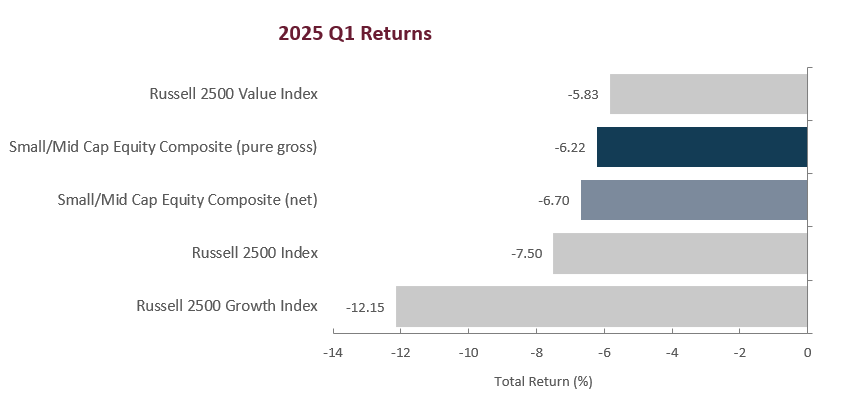
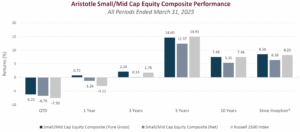
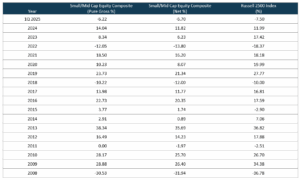
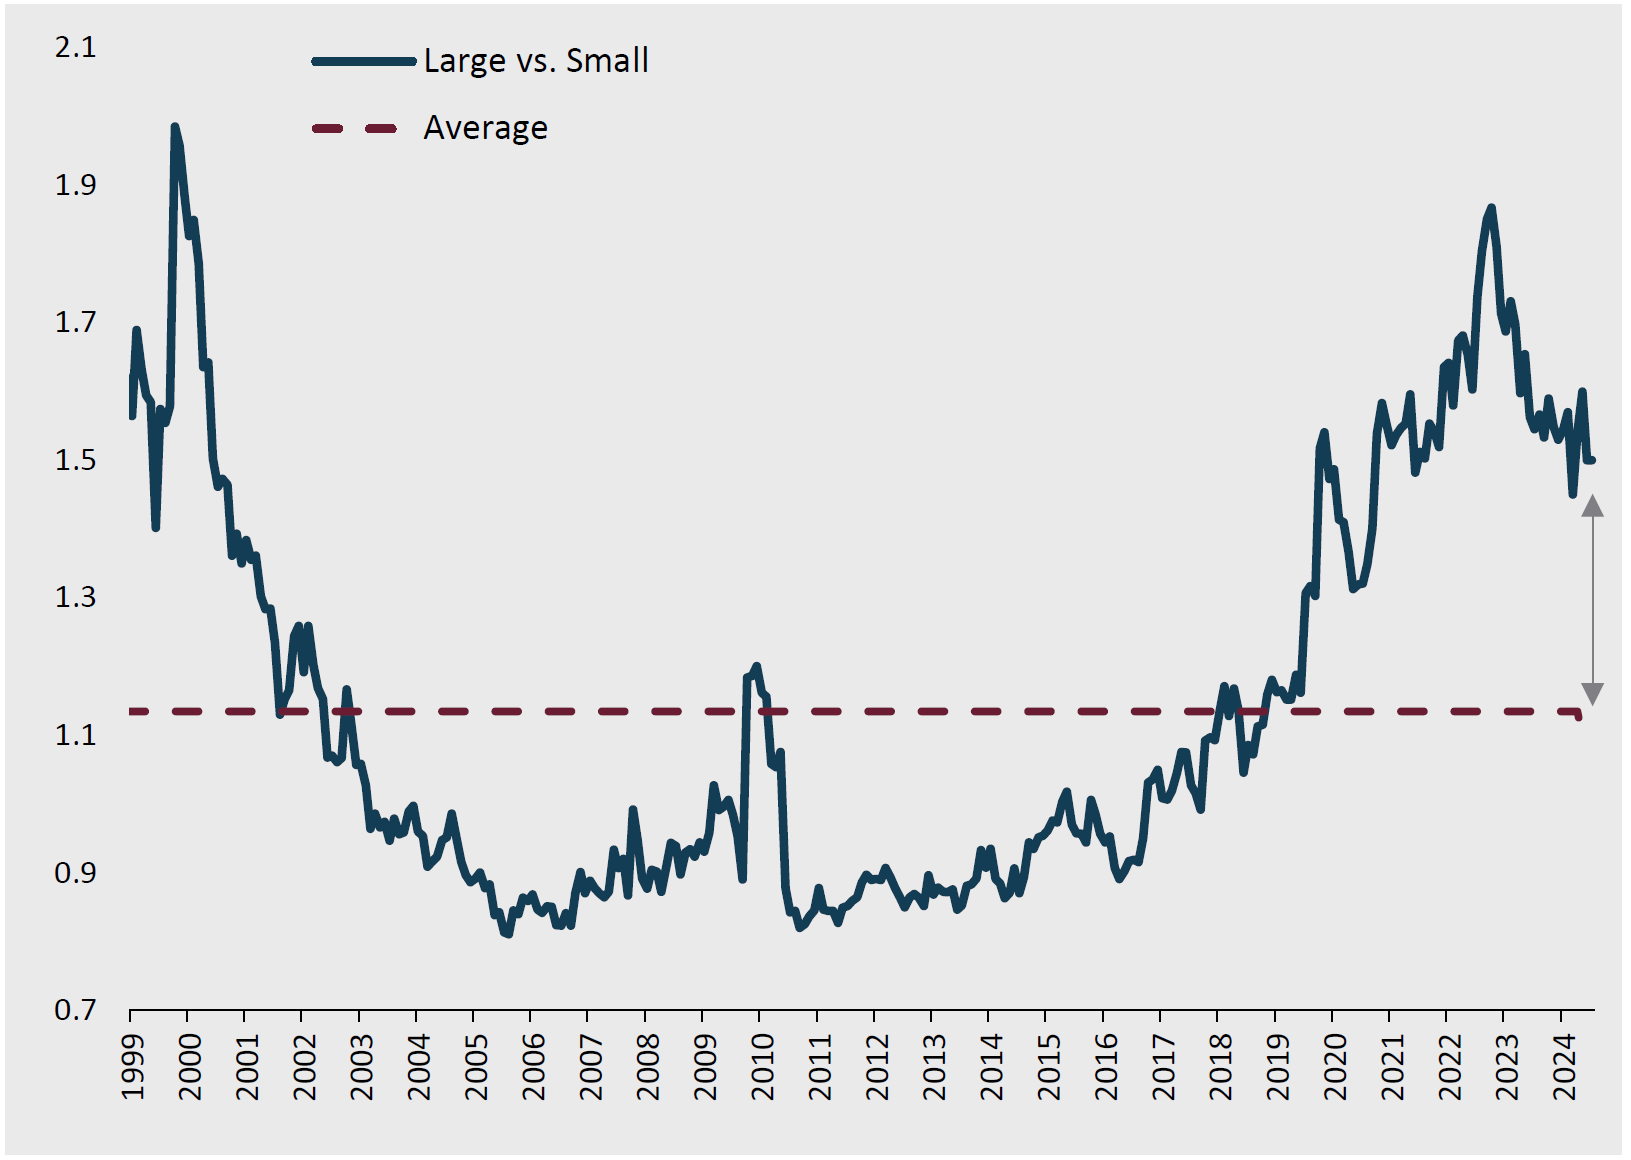
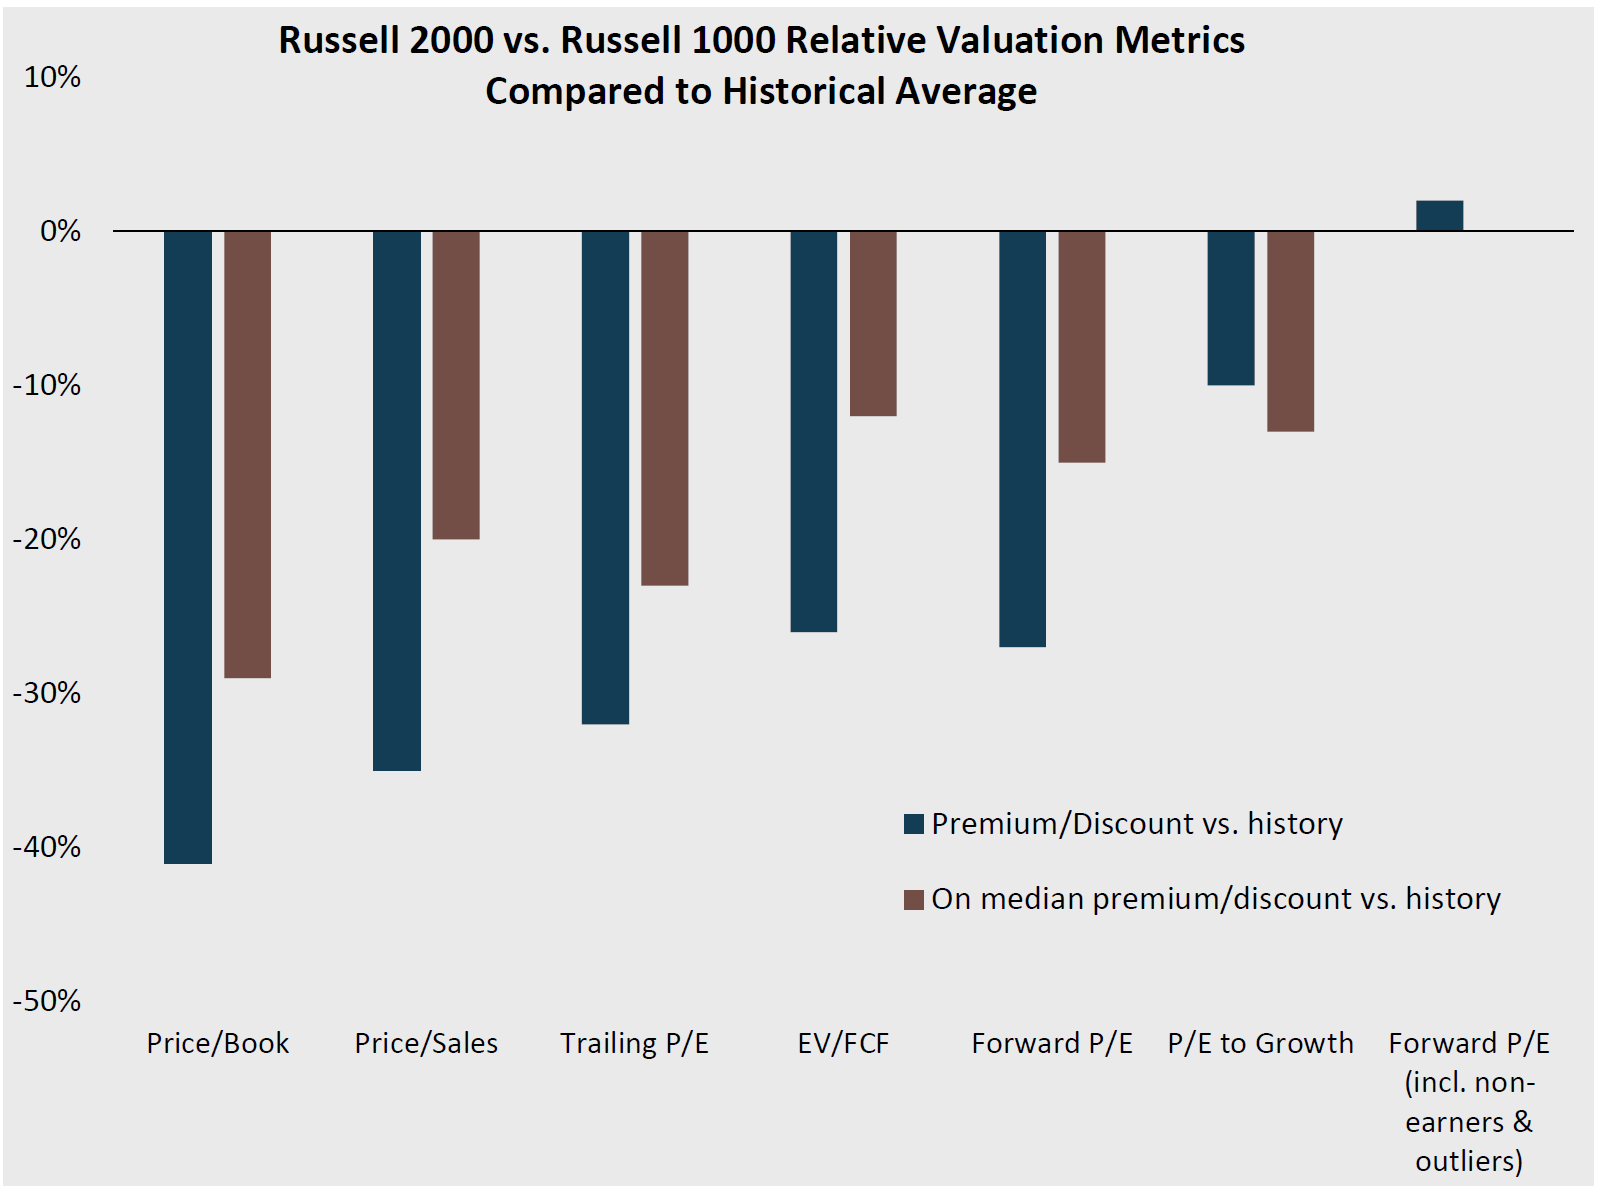

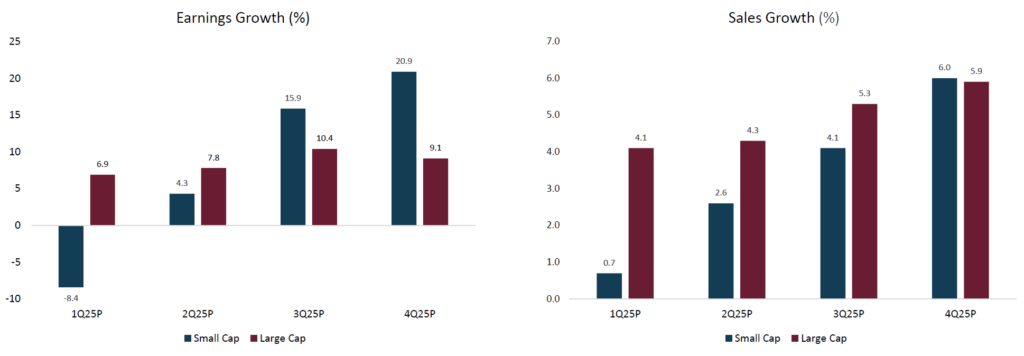
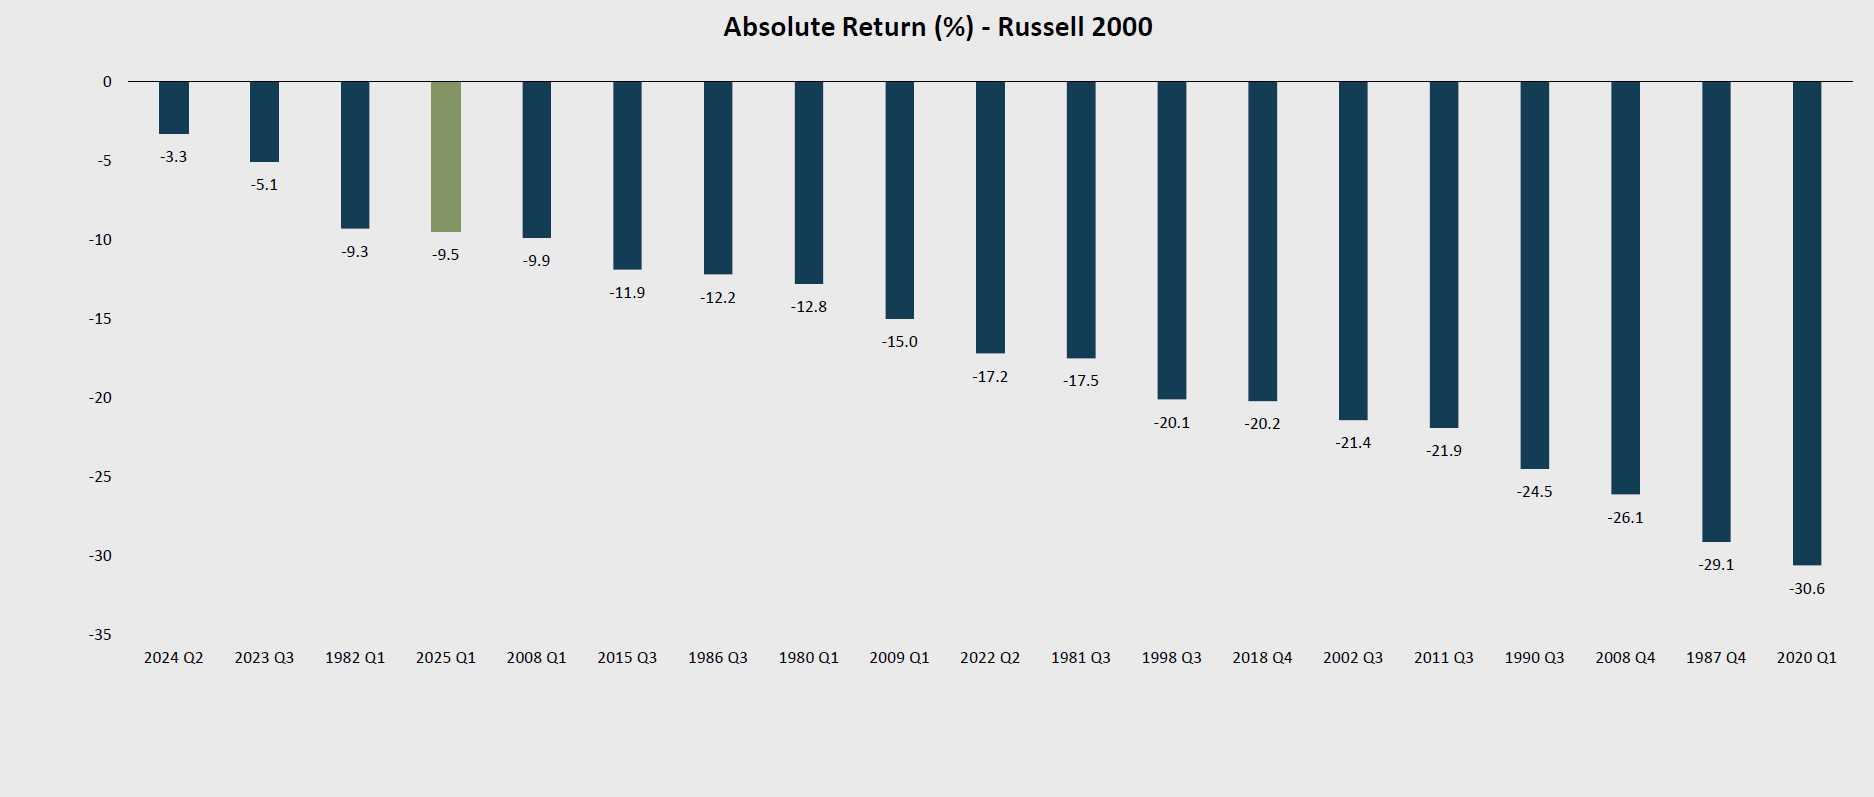
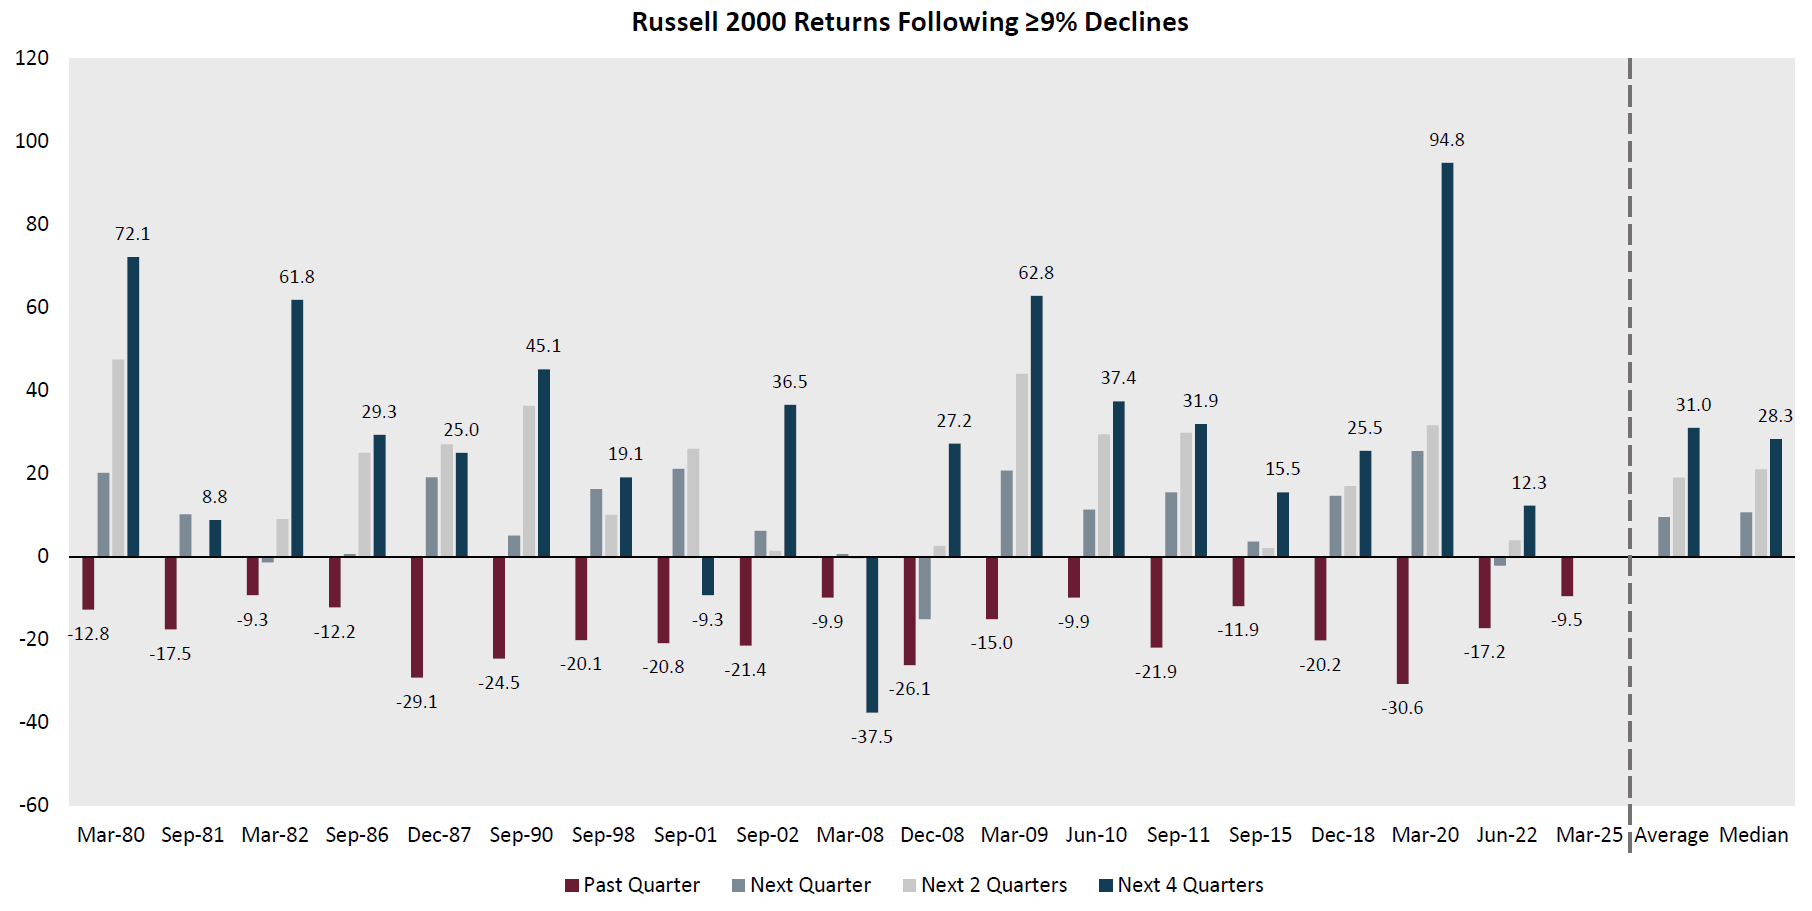
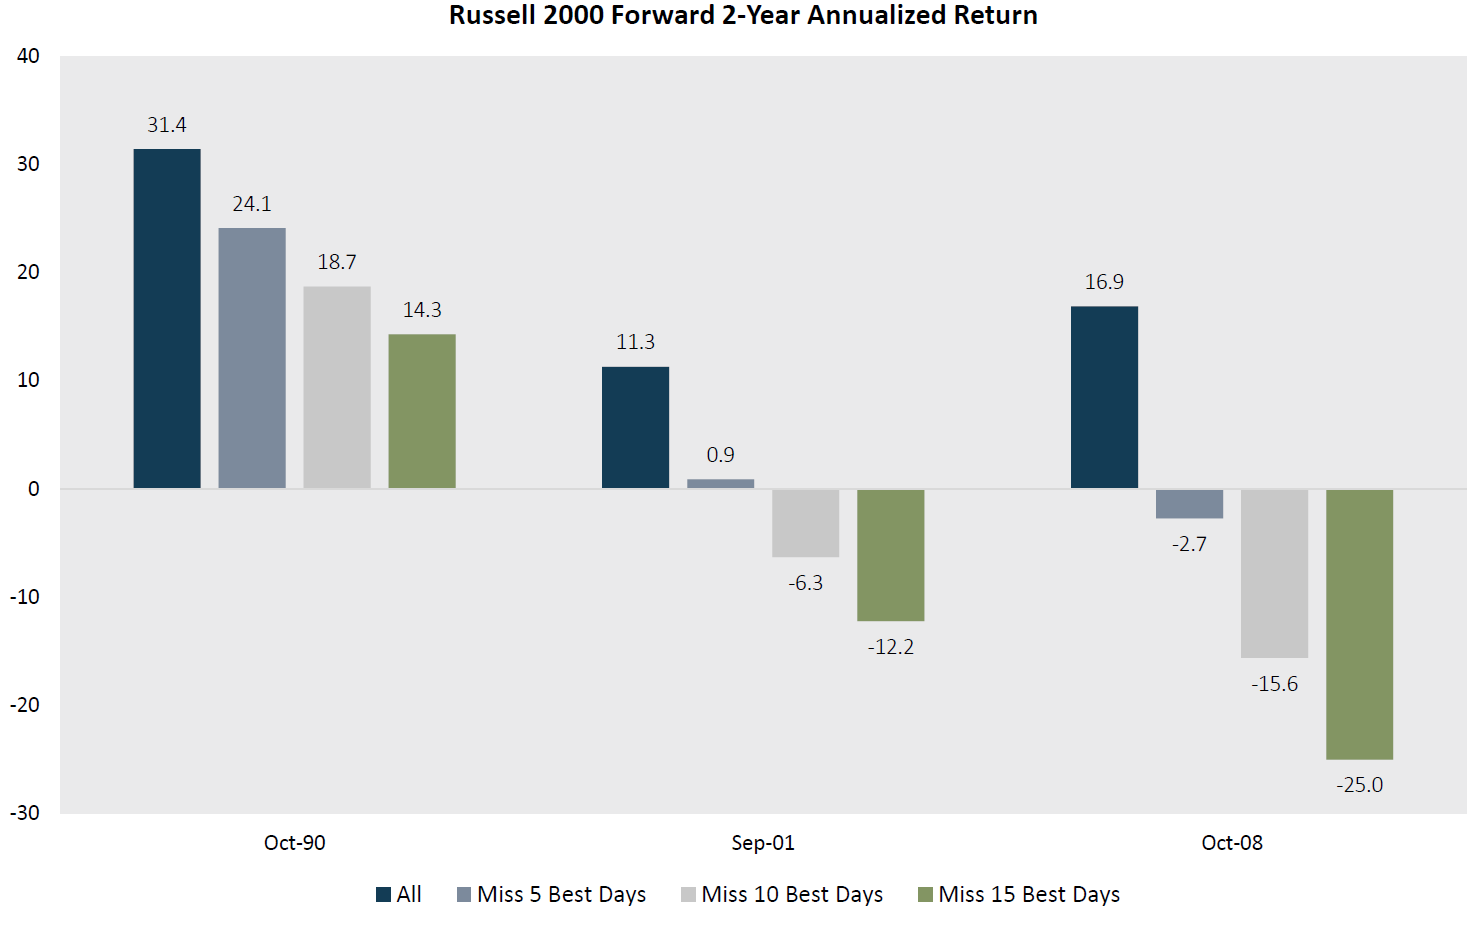
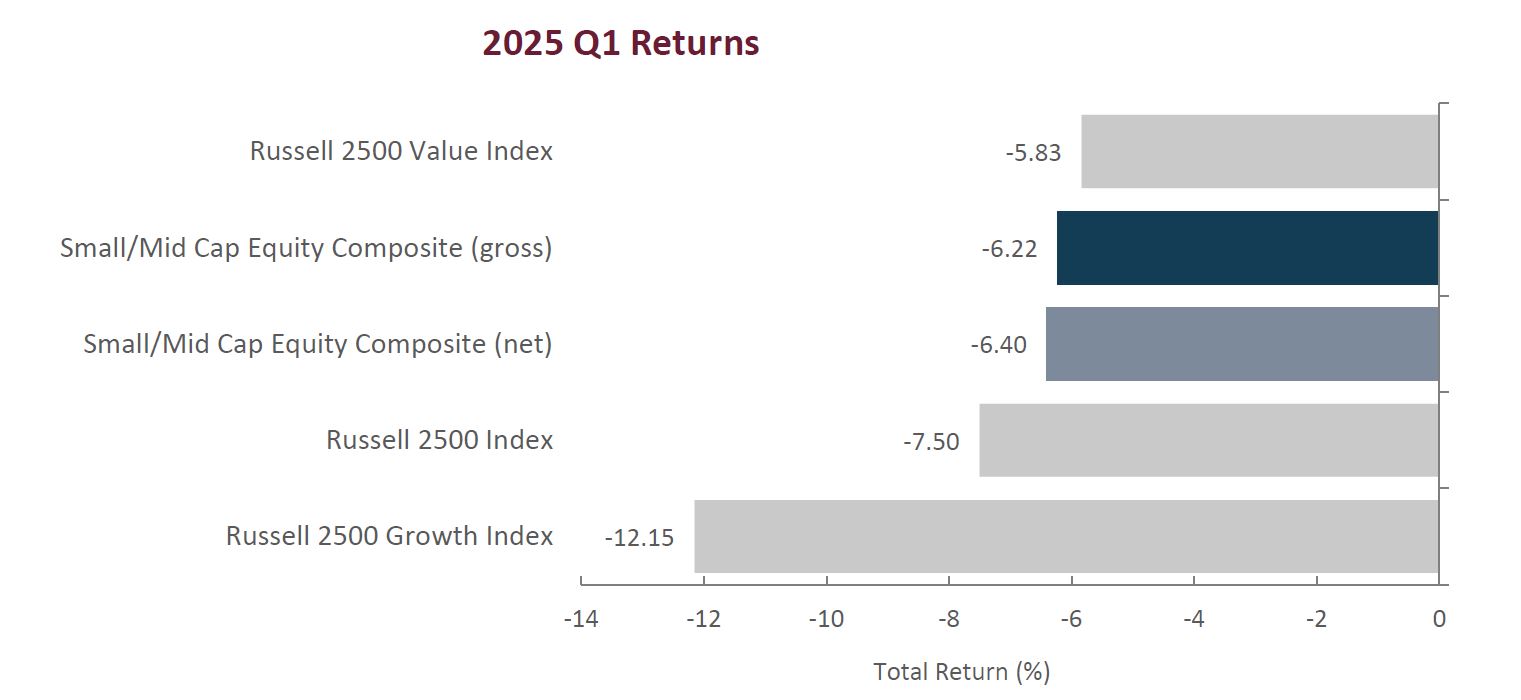

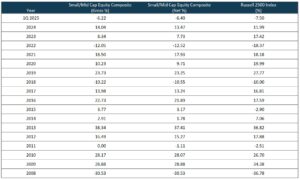 Sources: CAPS Composite Hub, Russell Investments


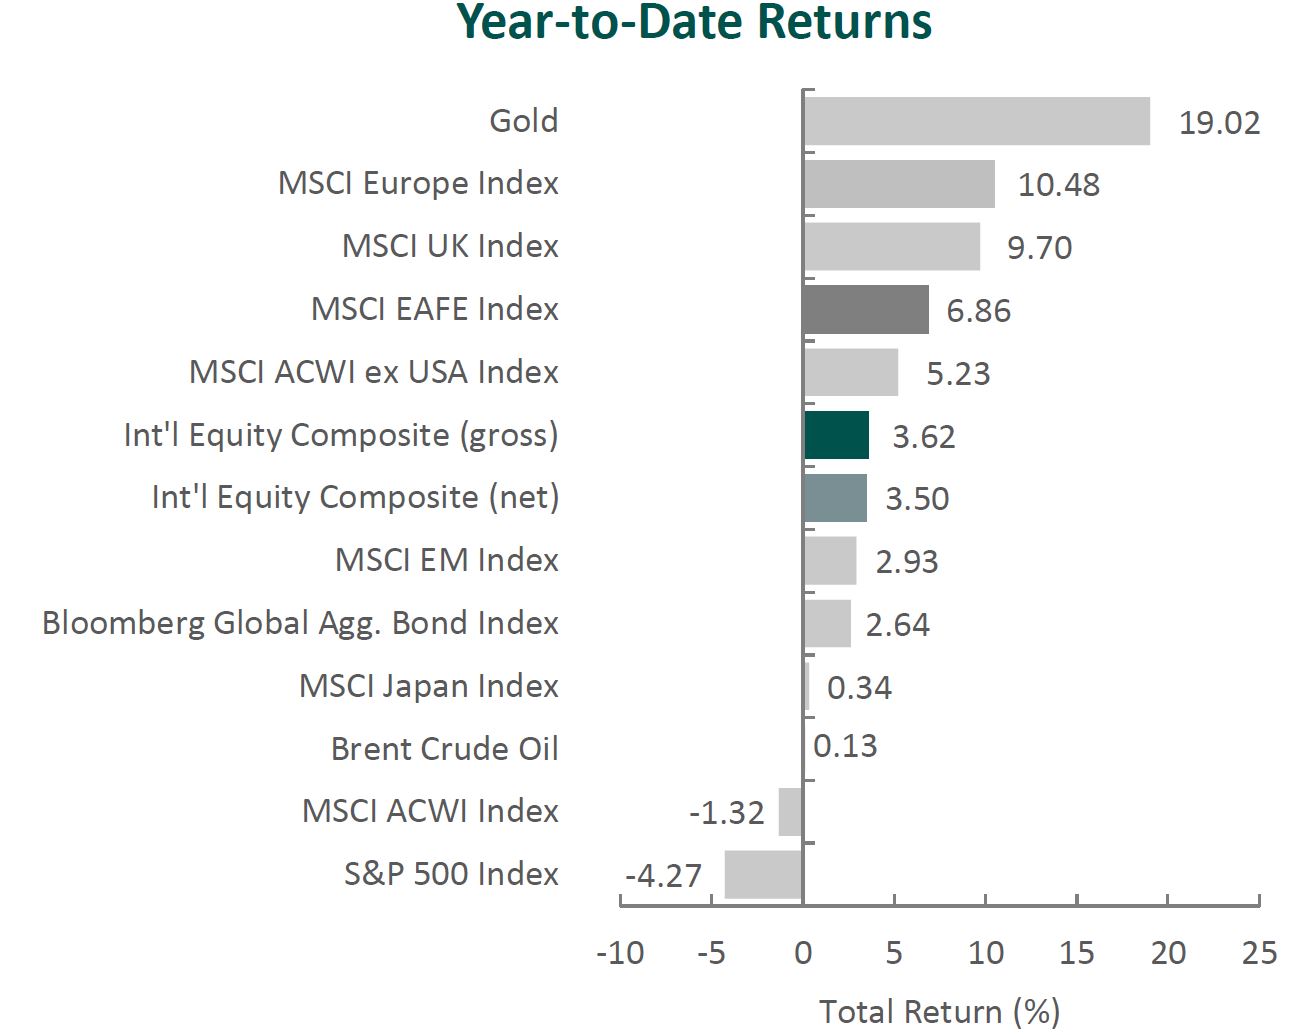
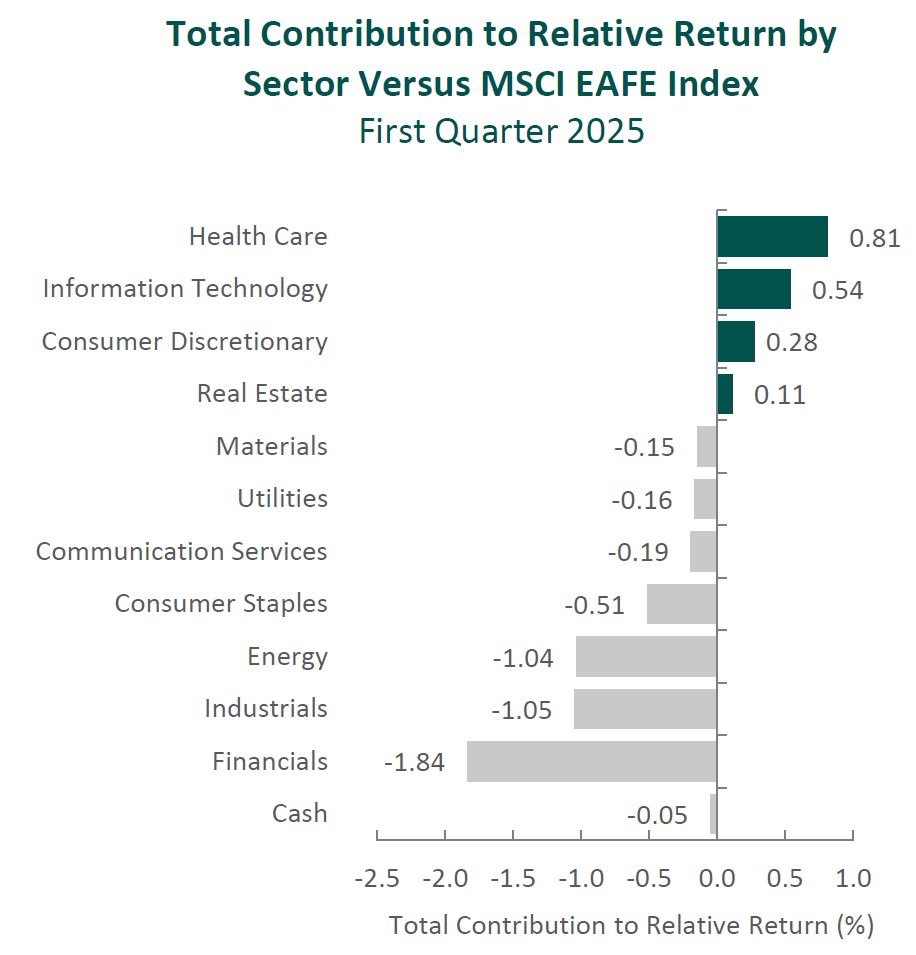

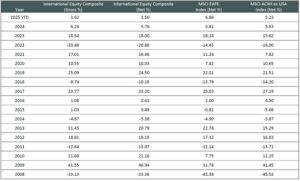 Composite returns for all periods ended March 31, 2025 are preliminary pending final account reconciliation.