ARISTOTLE CAPITAL BOSTON, LLC
Markets Review
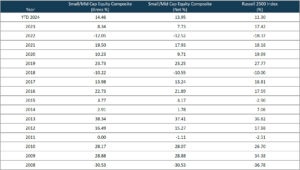
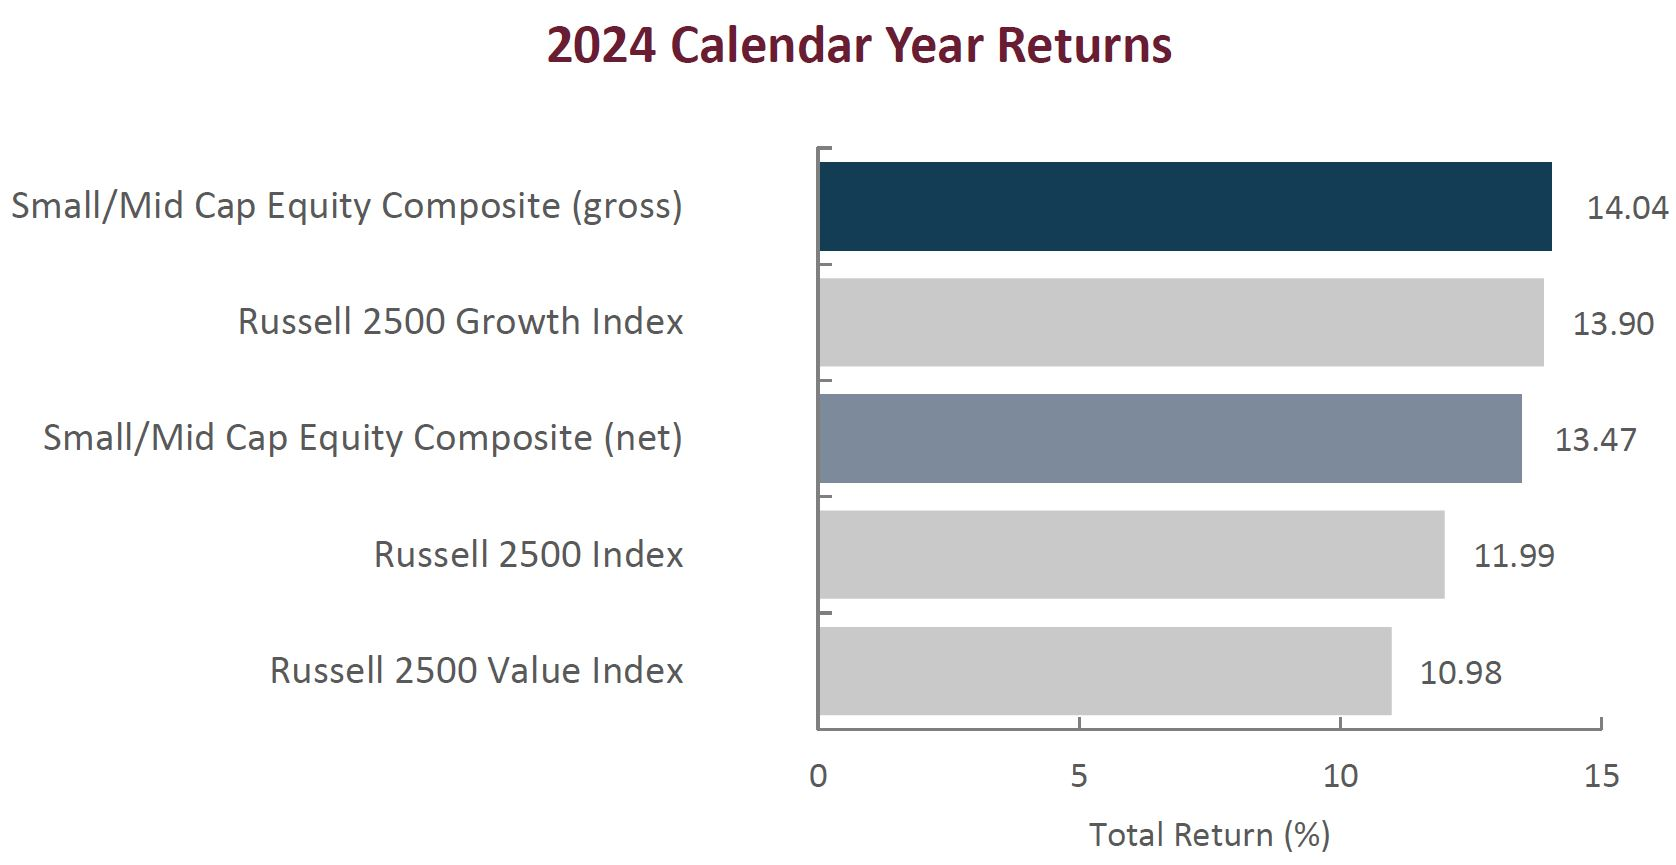
The volatility observed throughout 2024, continued into the fourth quarter. SMID caps posted mild gains in the fourth quarter with the Russell 2500 index delivering a total return of 0.62%, bringing its year-to-date total return to 11.99%. After a sluggish start to the quarter, November was a standout month for SMID cap stocks following the U.S. elections, as the Russell 2500 Index rallied 9.84% driven by expectations of pro-business policies under the incoming Trump administration. However, these gains were largely erased in December, as the Index declined -7.54%, reflecting renewed concerns over geopolitical tensions and uncertainty around the incoming administration’s policies, such as tariffs and immigration, as well as the impact of sharply higher U.S. yields. Furthermore, continued strong economic growth, a stable labor market and firmer inflation data all pushed the Federal Reserve (Fed) in a more hawkish direction in December. After consecutive 25 basis point rate cuts at the November and December meetings, Chairman Powell indicated the Fed is likely to take a more measured approach going forward and the committee updated their projections to forecast only two rate cuts in 2025.
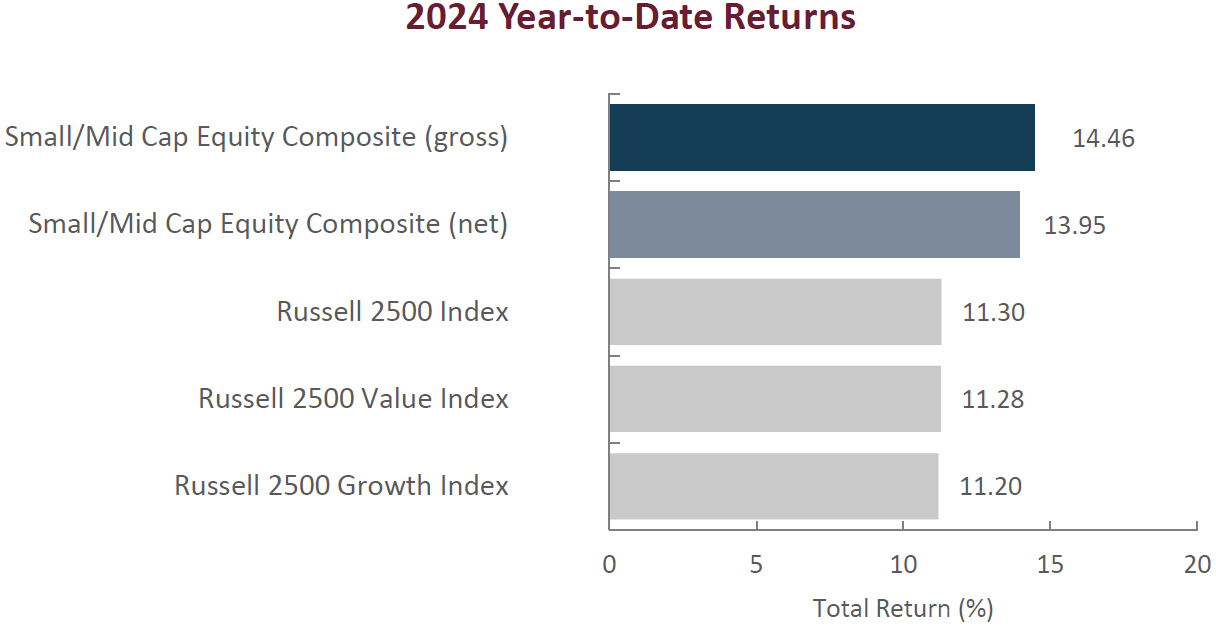
Stylistically, value stocks underperformed their growth counterparts during the quarter as evidenced by the Russell 2500 Value Index returning -0.26% compared to 2.43% for the Russell 2500 Growth Index. This widened the gap between value and growth for the year, as the Russell 2500 Growth Index gained 13.90% in 2024 versus the 10.98% return for the Russell 2500 Value Index.
From a factor performance perspective, the quarter saw continued market preference for higher-growth companies, supported by declining interest rates and improving sentiment. Non-earners outperformed profitable companies by 325bps and the factors that led the way were highest forward sales growth, lowest share price, highest short interest, highest momentum, and lowest ROIC.
At the sector level, six of the eleven sectors in the Russell 2500 Index recorded positive returns during the fourth quarter, led by the Information Technology (+6.85%), Financials (+6.57%), and Energy (+4.92%) sectors. Conversely, Health Care (-6.34%), Materials (-6.01%), and Real Estate (-5.65%) all underperformed. For the full year, all eleven sectors ended in positive territory. Utilities (+29.48), Financials (+20.98), and Information Technology (+16.21) led performance, while Materials (+1.29), Health Care (+2.55), and Energy (+5.55) lagged.
Sources: CAPS Composite Hub, Russell Investments
Past performance is not indicative of future results. Returns are presented gross and net of investment advisory fees and include the reinvestment of all income. Gross returns will be reduced by fees and other expenses that may be incurred in the management of the account. Net returns are presented net of actual investment advisory fees and after the deduction of all trading expenses. Aristotle Small/Mid Cap Equity Composite returns are preliminary pending final account reconciliation. Please see important disclosures at the end of this document.
Performance Review
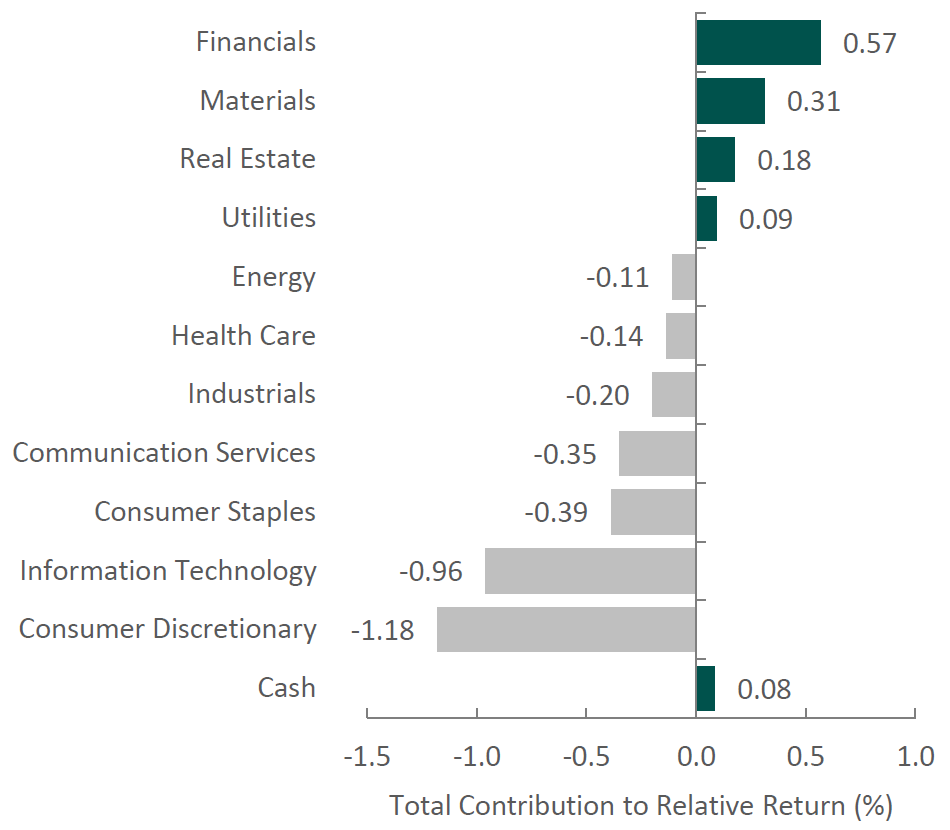
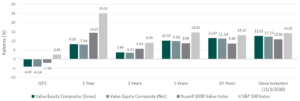
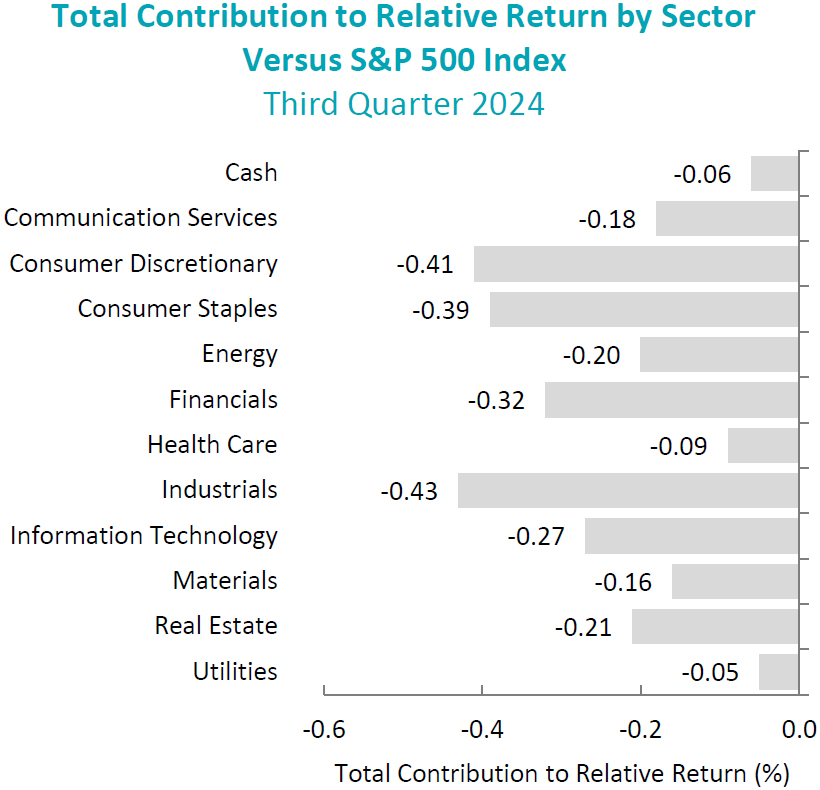
For the fourth quarter, the Aristotle Small/Mid Cap Equity Composite generated a total return of -0.45% net of fees (-0.37% gross of fees), underperforming the 0.62% total return of the Russell 2500 Index. Underperformance was primarily driven by security selection. Overall, security selection in the Financials, Information Technology and Industrials sectors detracted the most. This was partially offset by an overweight in Information Technology, an underweight in Real Estate coupled with strong security selection in Materials.
| Relative Contributors | Relative Detractors |
|---|---|
| Chart Industries | Acadia Healthcare |
| Summit Materials | Catalent |
| MACOM Technology Solutions | Carlisle Cos |
| Ciena | KB Home |
| Wolverine World Wide | HA Sustainable Infrastructure Capital |
CONTRIBUTORS
Chart Industries (GTLS), a company specializing in the design and manufacturing of highly engineered equipment for the industrial gas, energy, and biomedical industries, reported record high orders, a substantial increase in sales, and a strong backlog, driven by surging demand for its cryogenic equipment used in the clean energy sector, coupled with a changing positive sentiment around LNG by the new administration.
Summit Materials (SUM), a North American supplier of aggregates, cement, and ready-mix concrete for the construction industry, announced in November a definitive agreement to be acquired by Quikrete Holdings, Inc. totaling approximately $11.5 billion, including debt at a 30% premium with an expected close date within the first quarter of 2025.
DETRACTORS
Acadia Healthcare (ACHC), a behavioral healthcare and substance abuse treatment services company, continues to be impacted by the negative sentiment surrounding the news headlines related to patient care and questions about billing practices. While we take these developments seriously, we believe investors’ reaction to the news has been more severe than warranted. Industry peers have faced similar levels of scrutiny in the past with limited fundamental impact, and unless additional information is uncovered, we believe the current scrutiny will be resolved without much of an impact on their business. We continue to believe the company is well positioned to be an important part of the solution to an unfortunately growing need for behavioral health services.
Catalent (CTLT), is a global contract development and manufacturing organization that provides advanced delivery technologies and development solutions for drugs, biologics, and consumer health products. Novo Holdings completed its $16.5 billion all-cash acquisition of Catalent, converting it into a private company and delisting it from the New York Stock Exchange.
Recent Portfolio Activity
| Buys/Acquisitions | Sells/Liquidations |
|---|---|
| Americold Realty Trust | Aspen Technology |
| Axalta Coating System | Catalent |
| Columbus McKinnon | Infinera |
| Healthpeak Properties | |
| Hexcel | |
| Insight Enterprises |
BUYS/ACQUISITIONS
Americold Realty Trust (COLD), a global leader in temperature-controlled logistics, offering innovative technology-oriented supply chain and cold storage solutions to food producers, processors, distributors, and retailers was added to the portfolio. We believe that company-specific productivity initiatives coupled with strong industry dynamics are underappreciated by the market and not reflected in our estimate of the current valuation.
Axalta Coating System (AXTA), is a global manufacturer, marketer and distributor of high-performance liquid and powder coating solutions for commercial and light vehicle, industrial and aftermarket refinishing. In addition to an expected cyclical rebound in demand for the company’s products, self-help initiatives implemented by a new management team will likely drive stronger revenue and earnings growth over the next several years.
Columbus McKinnon (CMCO), isa designer and manufacturer of a variety of material handling products and industrial lifts. The company is expected to benefit from a cyclical rebound in demand following a period of subdued performance as well as the harvesting of investments they’ve made over the past several years in faster growing, higher margin intelligent motion solutions (conveyance and automation).
Healthpeak Properties (DOC), is a healthcare-focused real estate investment trust (REIT) that develops, owns and manages medical office buildings, senior housing assets and life science facilities. Following an industry-wide life sciences building boom that created a supply/demand imbalance, DOC is poised to benefit from improved lease rates with its properties as excess industry capacity is absorbed. A solid fundamental backdrop for the demographically driven senior housing portfolio and stability within its medical office building portfolio should allow the company to produce improved financial performance over the next several years.
Hexcel (HXL), develops and manufactures structural materials for use in commercial aerospace, space and defense, and industrial applications. As a leading supplier of carbon fiber, honeycomb and other composite materials for the aerospace industry the company’s financial performance has been negatively impacted by Covid-era disruptions and Boeing’s company-specific manufacturing problems. We believe the combination of company-specific self-help initiatives and an improving outlook for commercial aircraft build rates bodes well for improved financial performance from HXL.
Insights Enterprises (NSIT), is a global technology “solutions integrator” specializing in designing, building and managing complex IT solutions for businesses of various size and scale. Areas of expertise include data center, cloud, security, and AI. Over the next several years, NSIT is poised to benefit from increased demand from an increasing complex technology landscape, the continued transition of enterprise business to the cloud and the emergence of AI as a must have IT tool. They are also expected to realize improved financial performance over the next several years as the benefits of strategic investments that have expanded the company’s portfolio of IT solutions are realized as well as from the integration/cross-selling of acquisitions completed over the past couple of years.
SELLS/LIQUIDATIONS
Aspen Technology (AZPN), is an industrial software company that provides software solutions that optimize asset performance and operational efficiency for industries such as energy, chemicals, and manufacturing. The company was sold as the stock price appreciated after Emerson Electric proposed to buy the 42.6% of Aspen’s outstanding shares it currently does not own, causing the reward/risk ratio to compress.
Catalent (CTLT), is a global contract development and manufacturing organization that provides advanced delivery technologies and development solutions for drugs, biologics, and consumer health products. Novo Holdings completed its $16.5 billion all-cash acquisition of Catalent, converting it into a private company and delisting it from the New York Stock Exchange.
Infinera (INFN), a global provider of advanced optical networking solutions for service providers, cloud operators, and enterprises, was acquired by Nokia at a 28% premium for both stock and cash. The position was sold as Nokia’s market cap is too large for the small/mid cap strategy.
Outlook
We remain optimistic about the long-term potential for the SMID-cap segment of the U.S. market. Valuations in SMID-caps continue to be attractive relative to large caps, with the Russell 2500 Index trading near the lower end of its historical range. Potential tailwinds, including deregulation, increased M&A activity, the continued decline in interest rates, continued reshoring of U.S. manufacturing, and infrastructure-related spending, could provide additional support for SMID-cap stocks. Nonetheless, we remain mindful of risks such as a potential reacceleration in inflation, geopolitical tensions, and ongoing pressures in commercial real estate and regional banking.
Positioning
Our current positioning is a function of our bottom-up security selection process and our ability to identify what we view as attractive investment candidates, regardless of economic sector definitions. Overweights in Industrials and Information Technology are mostly a function of our underlying company specific views rather than any top-down predictions for each sector. Conversely, we continue to be underweight in Consumer Discretionary, as we have been unable to identify what we consider to be compelling long-term opportunities that fit our discipline given the rising risk profiles of many retail businesses and a potential deceleration in goods spending following a period of strength. We also continue to be underweight in Real Estate as a result of structural challenges for various end markets within the sector. Given our focus on long-term business fundamentals, patient investment approach and low portfolio turnover, the strategy’s sector positioning generally does not change significantly from quarter to quarter. However, we may take advantage of periods of volatility by adding selectively to certain companies when appropriate.
The opinions expressed herein are those of Aristotle Capital Boston, LLC (Aristotle Boston) and are subject to change without notice.
Past performance is not indicative of future results. The information provided in this report should not be considered financial advice or a recommendation to purchase or sell any particular security. There is no assurance that any securities discussed herein will remain in an account’s portfolio at the time you receive this report or that securities sold have not been repurchased. The securities discussed may not represent an account’s entire portfolio and, in the aggregate, may represent only a small percentage of an account’s portfolio holdings. The performance attribution presented is of a representative account from Aristotle Boston’s Small/Mid Cap Equity Composite. The representative account is a discretionary client account which was chosen to most closely reflect the investment style of the strategy. The criteria used for representative account selection is based on the account’s period of time under management and its similarity of holdings in relation to the strategy. It should not be assumed that any of the securities transactions, holdings or sectors discussed were or will be profitable, or that the investment recommendations or decisions Aristotle Boston makes in the future will be profitable or equal the performance of the securities discussed herein. Aristotle Boston reserves the right to modify its current investment strategies and techniques based on changing market dynamics or client needs. Recommendations made in the last 12 months are available upon request.
Returns are presented gross and net of investment advisory fees and include the reinvestment of all income. Gross returns will be reduced by fees and other expenses that may be incurred in the management of the account. Net returns are presented net of actual investment advisory fees and after the deduction of all trading expenses.
As of December 31, 2014, there were no non-fee-paying accounts in the Composite.
All investments carry a certain degree of risk, including the possible loss of principal. Investments are also subject to political, market, currency and regulatory risks or economic developments. International investments involve special risks that may in particular cause a loss in principal, including currency fluctuation, lower liquidity, different accounting methods and economic and political systems, and higher transaction costs.
These risks typically are greater in emerging markets. Securities of small‐ and medium‐sized companies tend to have a shorter history of operations, be more volatile and less liquid. Value stocks can perform differently from the market as a whole and other types of stocks.
The material is provided for informational and/or educational purposes only and is not intended to be and should not be construed as investment, legal or tax advice and/or a legal opinion. Investors should consult their financial and tax adviser before making investments.
The opinions referenced are as of the date of publication, may be modified due to changes in the market or economic conditions, and may not necessarily come to pass.
Aristotle Capital Boston, LLC is an independent investment adviser registered under the Investment Advisers Act of 1940, as amended. Registration does not imply a certain level of skill or training. More information about Aristotle Boston, including our investment strategies, fees and objectives, can be found in our Form ADV Part 2, which is available upon request. ACB-2501-23

Sources: CAPS Composite Hub, Russell Investments
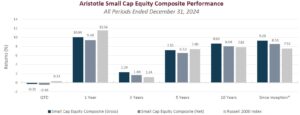
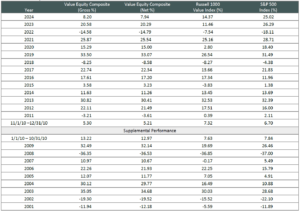
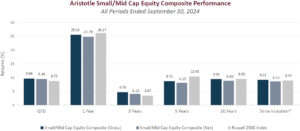
Composite returns for periods ended December 31, 2024, are preliminary pending final account reconciliation.
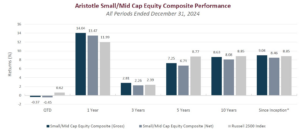
*The Aristotle Small/Mid Cap Equity Composite has an inception date of January 1, 2008, at a predecessor firm. During this time, Jack McPherson and Dave Adams had primary responsibility for managing the strategy. Performance starting January 1, 2015, was achieved at Aristotle Boston.
As of December 31, 2014, there were no non-fee-paying accounts in the Composite. Past performance is not indicative of future results. Performance results for periods greater than one year have been annualized.
Returns are presented gross and net of investment advisory fees and include the reinvestment of all income. Gross returns will be reduced by fees and other expenses that may be incurred in the management of the account. Net returns are presented net of actual investment advisory fees and after the deduction of all trading expenses. Please see important disclosures enclosed within this document.
The Russell 2500 Index is a subset of the Russell 3000® Index representing approximately 10% of the total market capitalization of that index. It includes approximately 2000 of the smallest securities based on a combination of their market cap and current index membership. The Russell 2500 Growth® Index measures the performance of the small/mid cap companies located in the United States that also exhibit a growth probability. The Russell 2500 Value® Index measures the performance of the small/mid cap companies located in the United States that also exhibit a value probability. The volatility (beta) of the composite may be greater or less than the benchmarks. It is not possible to invest directly in these indices.