Markets Review
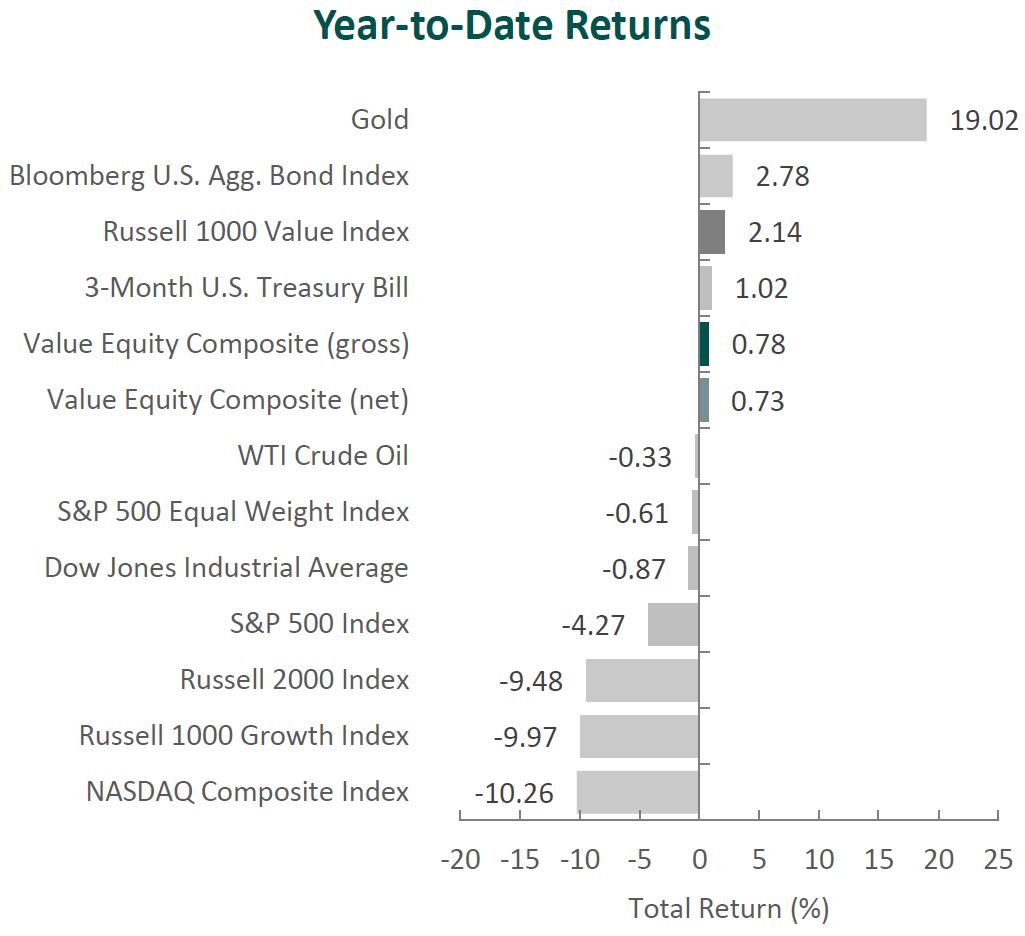
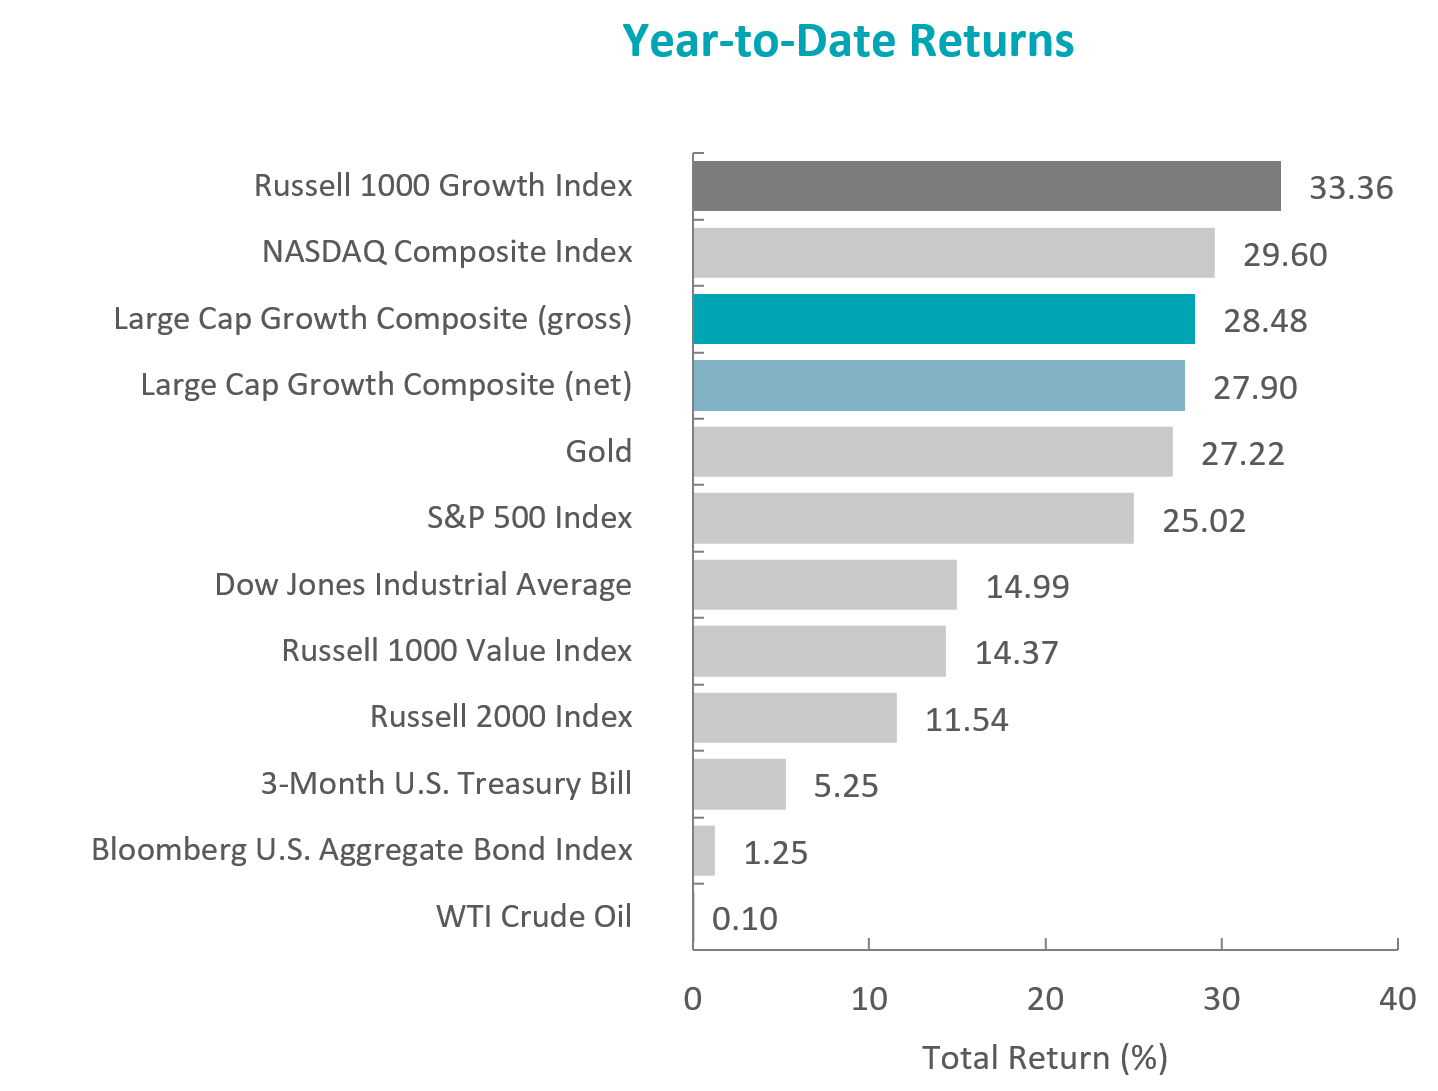
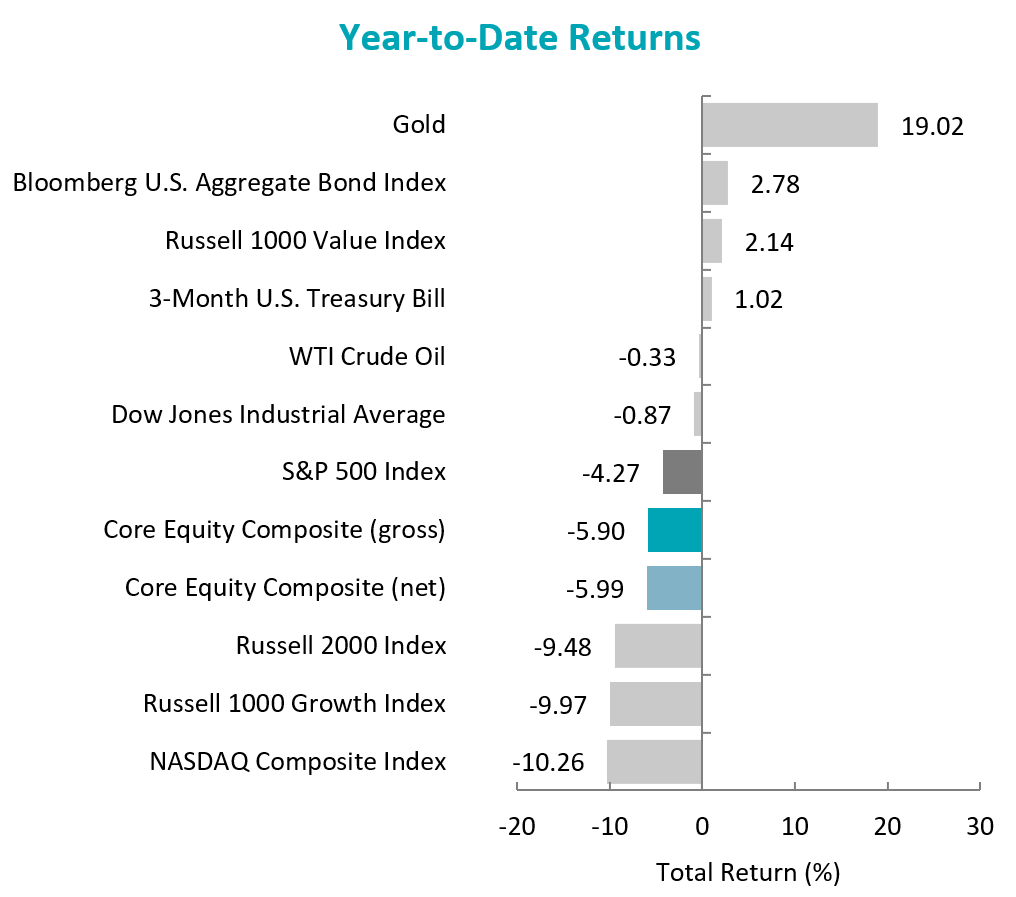
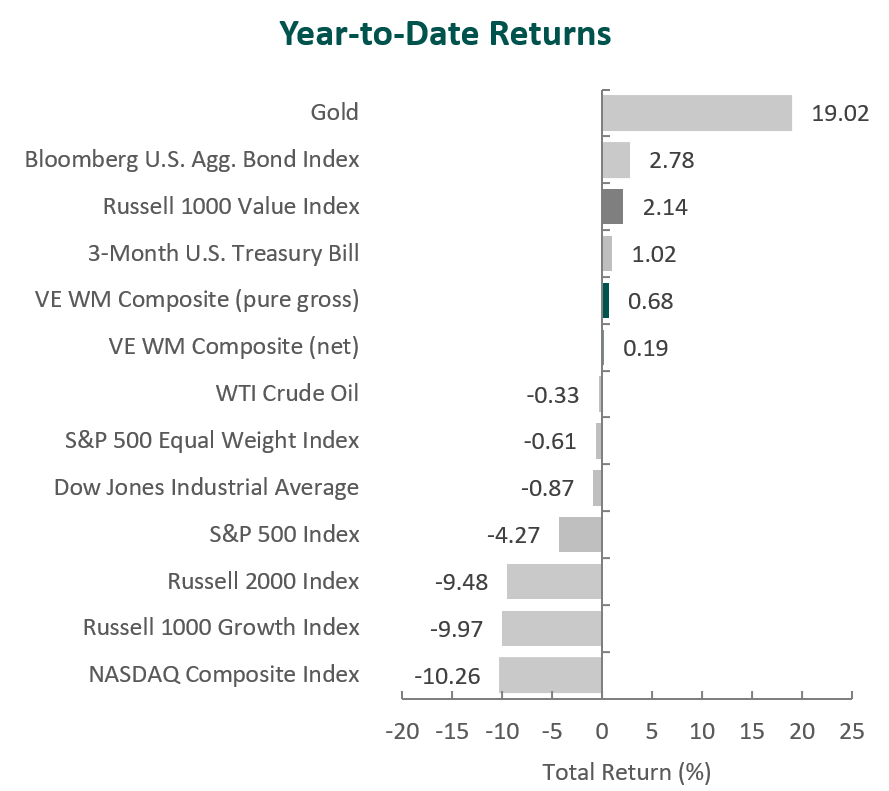
The U.S. equity market began 2025 with a modest decline, with the S&P 500 Index falling 4.27% during the first quarter. In contrast, bonds provided a measure of stability, as the Bloomberg U.S. Aggregate Bond Index rose 2.78%.
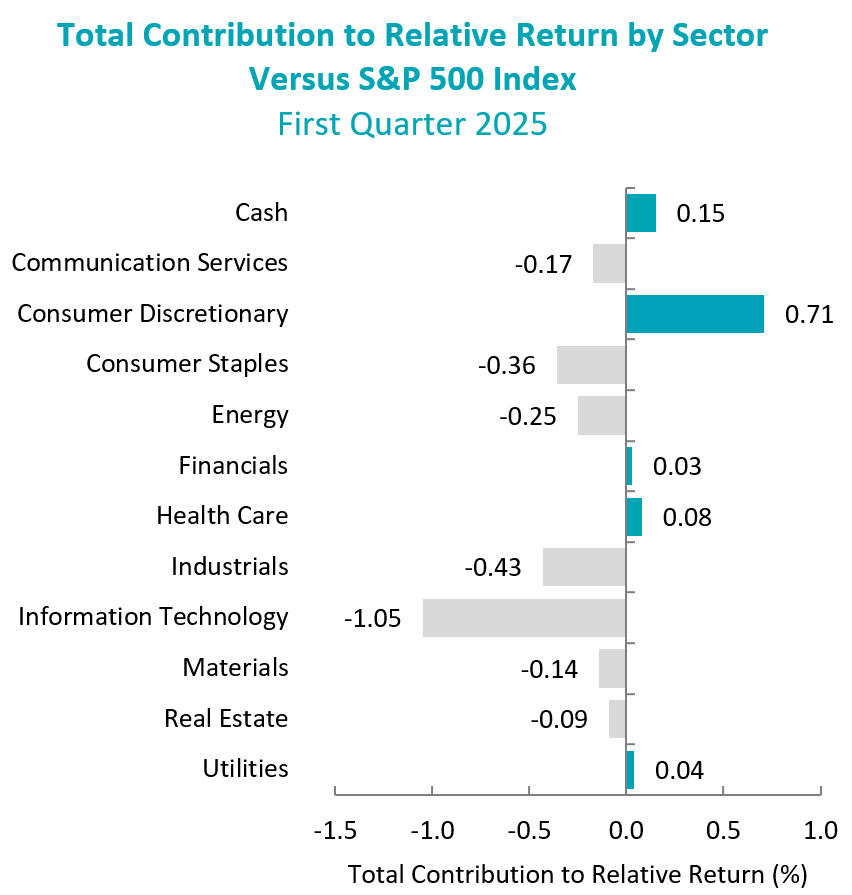
On a sector basis, negative performance was led by four of the eleven sectors within the S&P 500 Index in the first quarter of 2025. The weakest sectors were Consumer Discretionary and Information Technology. The best-performing sectors were Energy and Health Care.
Sources: CAPS CompositeHubTM, Bloomberg
Past performance is not indicative of future results. Aristotle Atlantic Core Equity Composite returns are presented gross and net of investment advisory fees and include the reinvestment of all income. Gross returns will be reduced by fees and other expenses that may be incurred in the management of the account. Net returns are presented net of actual investment advisory fees and after the deduction of all trading expenses. Aristotle Atlantic Composite returns are preliminary pending final account reconciliation. Please see important disclosures at the end of this document.
U.S. economic data reported during the quarter presented a mixed picture. Real GDP growth slowed to an annualized rate of 2.4%, while inflation remained stable. The Consumer Price Index (CPI) rose 2.8% year-over-year in February, reflecting moderate inflationary pressures. Meanwhile, the labor market remained resilient, with the unemployment rate hovering around 4%. However, consumer strength showed signs of strain, as retail sales slowed from levels seen late last year, potentially impacted by adverse weather and broader macroeconomic uncertainty.
Trade policy was a major source of uncertainty during the quarter. President Trump announced a series of new tariffs on imports from Canada, Mexico and China, citing concerns over illegal immigration, drug trafficking and intellectual property theft. Targeted industries included autos, steel, aluminum and energy, particularly Venezuelan oil. While tariffs initially raised concerns, the administration’s selective enforcement and flexible implementation approach helped ease market anxiety. In response to the evolving economic landscape, the Federal Reserve (Fed) maintained its target range for the federal funds rate at 4.25% to 4.50%. The central bank acknowledged potential inflationary pressures from tariffs and moderated expectations for economic growth in 2025.
Despite broader economic headwinds, corporate earnings remained strong. S&P 500 companies reported impressive 17.8% year-over-year earnings growth, the highest rate since 2021. However, tariff-related uncertainties loomed large, with more than 220 companies referencing tariffs in their earnings calls and nearly 15% issuing negative earnings guidance.
On the domestic front, a government shutdown was averted, as President Trump signed a six-month funding bill. Senate Democratic Leader Chuck Schumer supported the measure, believing that a shutdown would have allowed the Department of Government Efficiency (DOGE) to terminate government services at a faster rate.
Geopolitically, the U.S. continued its mediation efforts in the Middle East and Ukraine. While a temporary ceasefire agreement was reached between Israel and Hamas in January, tensions flared again in March over disputes regarding hostage releases in Gaza. In Ukraine, U.S. aid was briefly paused following a contentious White House meeting between presidents Trump and Zelensky. Financial and intelligence support resumed after Ukraine signaled it was open to a ceasefire and agreed to revisit terms of a potential mineral deal, aiming to offset the costs of U.S. assistance.
Performance and Attribution Summary
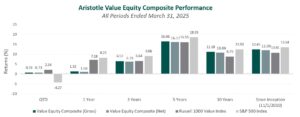
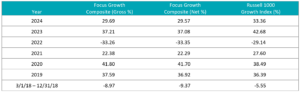
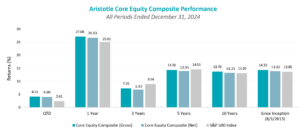
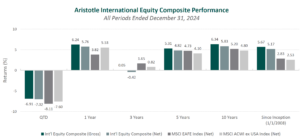
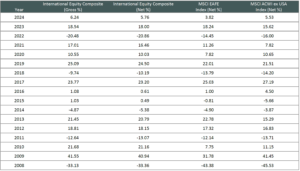
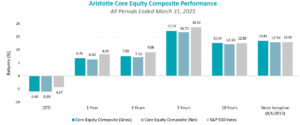
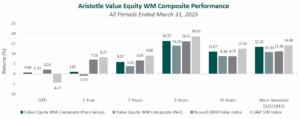
For the first quarter of 2025, Aristotle Atlantic’s Core Equity Composite posted a total return of -5.90% gross of fees (-5.99% net of fees), underperforming the S&P 500 Index, which recorded a total return of -4.27%.
| Performance (%) | 1Q25 | 1 Year | 3 Years | 5 Years | 10 Years | Since Inception* |
|---|---|---|---|---|---|---|
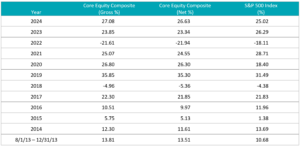
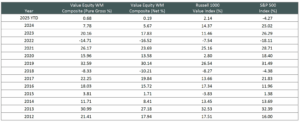
| Core Equity Composite (gross) | -5.90 | 6.76 | 7.59 | 17.19 | 12.58 | 13.41 |
| Core Equity Composite (net) | -5.99 | 6.32 | 7.15 | 16.72 | 12.10 | 12.90 |
| S&P 500 Index | -4.27 | 8.25 | 9.06 | 18.59 | 12.10 | 12.92 |
Source: FactSet
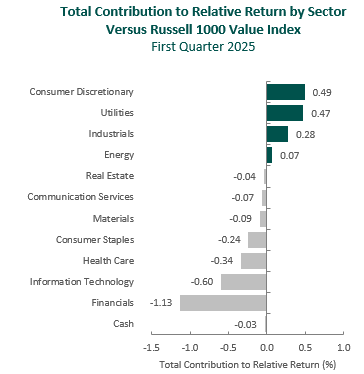
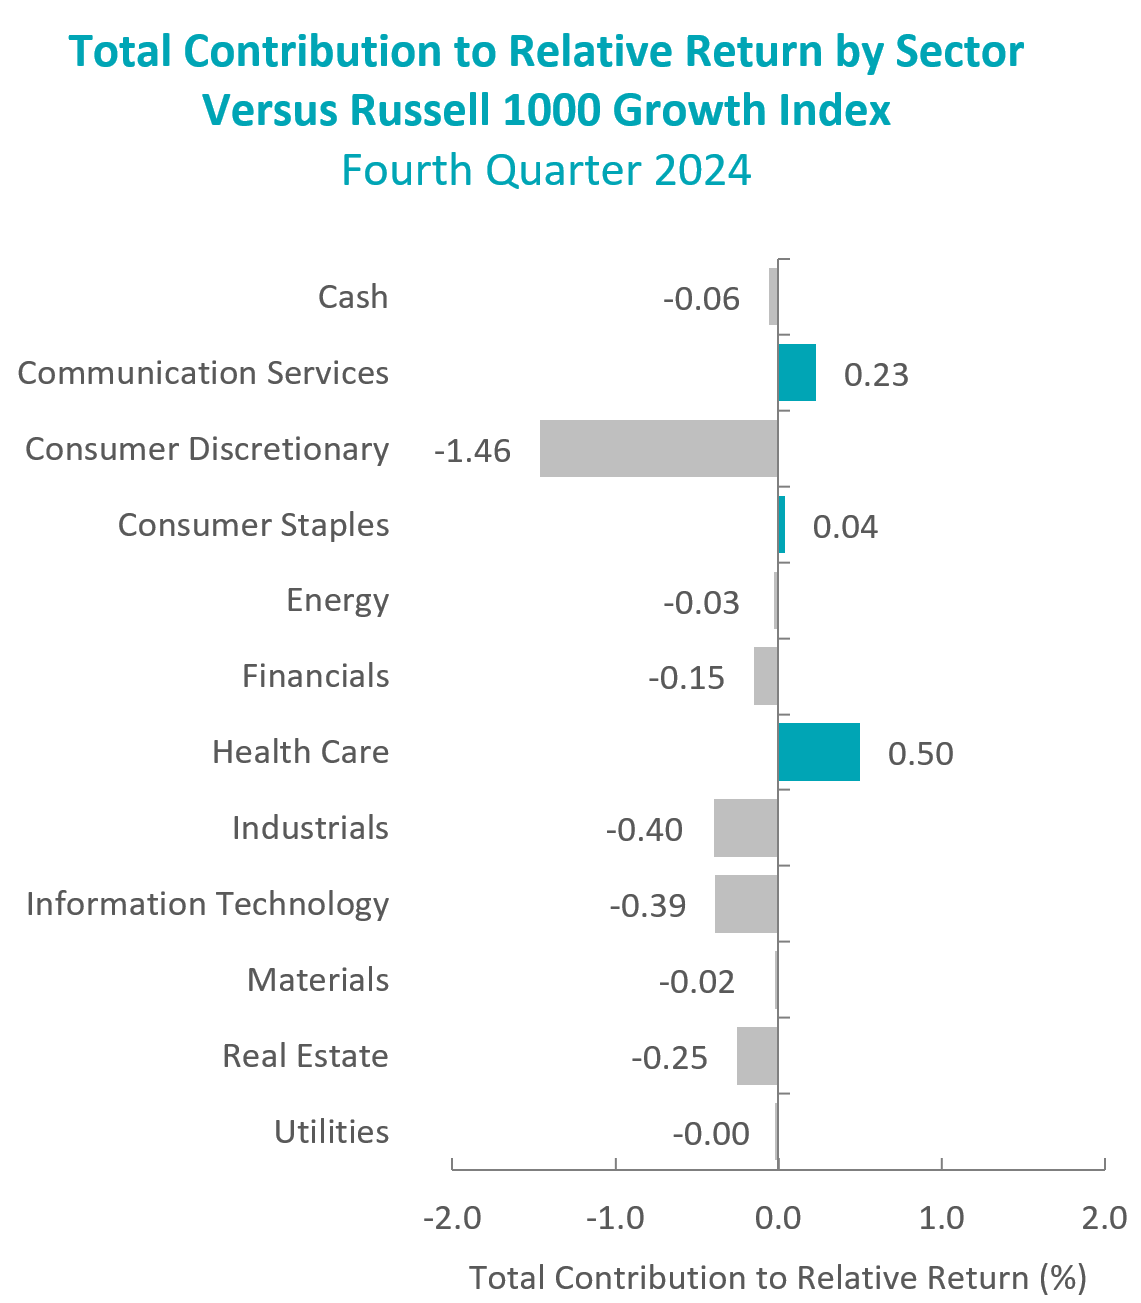
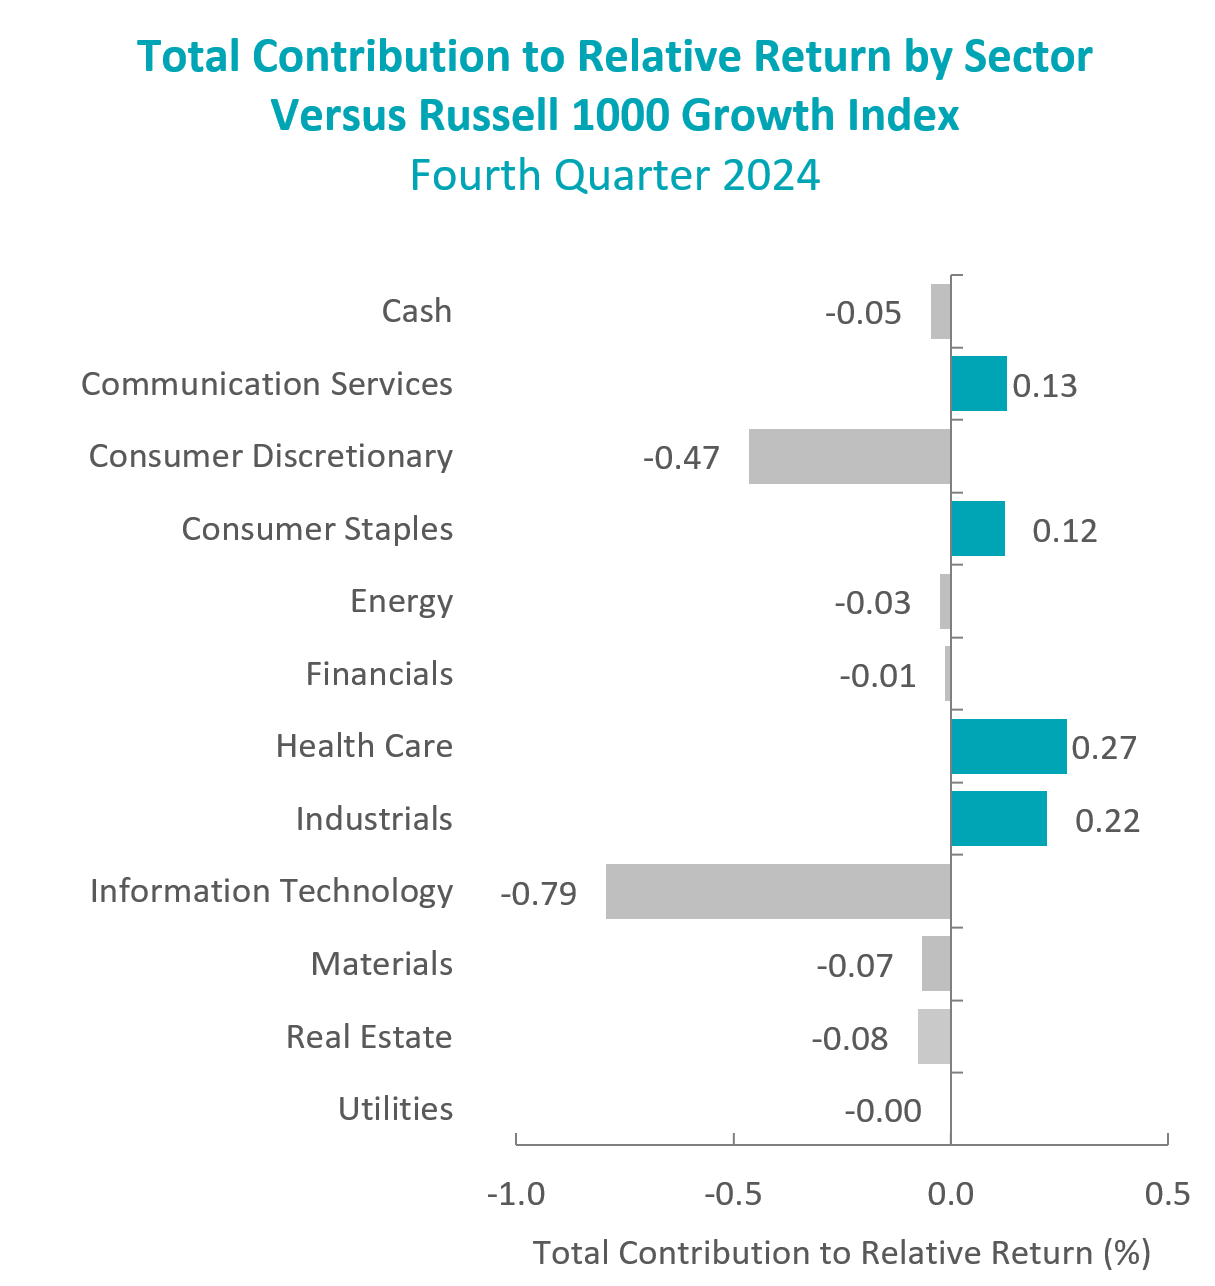
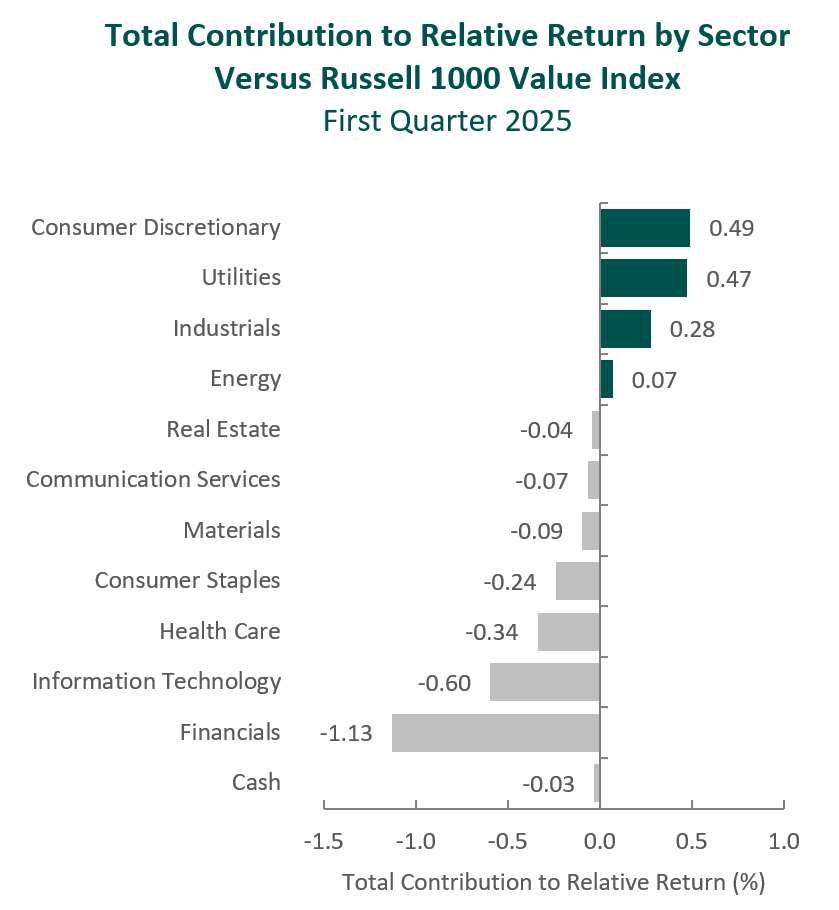
Past performance is not indicative of future results. Sector attribution shows how much of a portfolio’s overall return is directly attributable to stock selection and asset allocation decisions within the portfolio, highlighting which sectors contributed or detracted to the total return. Attribution includes the reinvestment of income. Please see important disclosures at the end of this document.
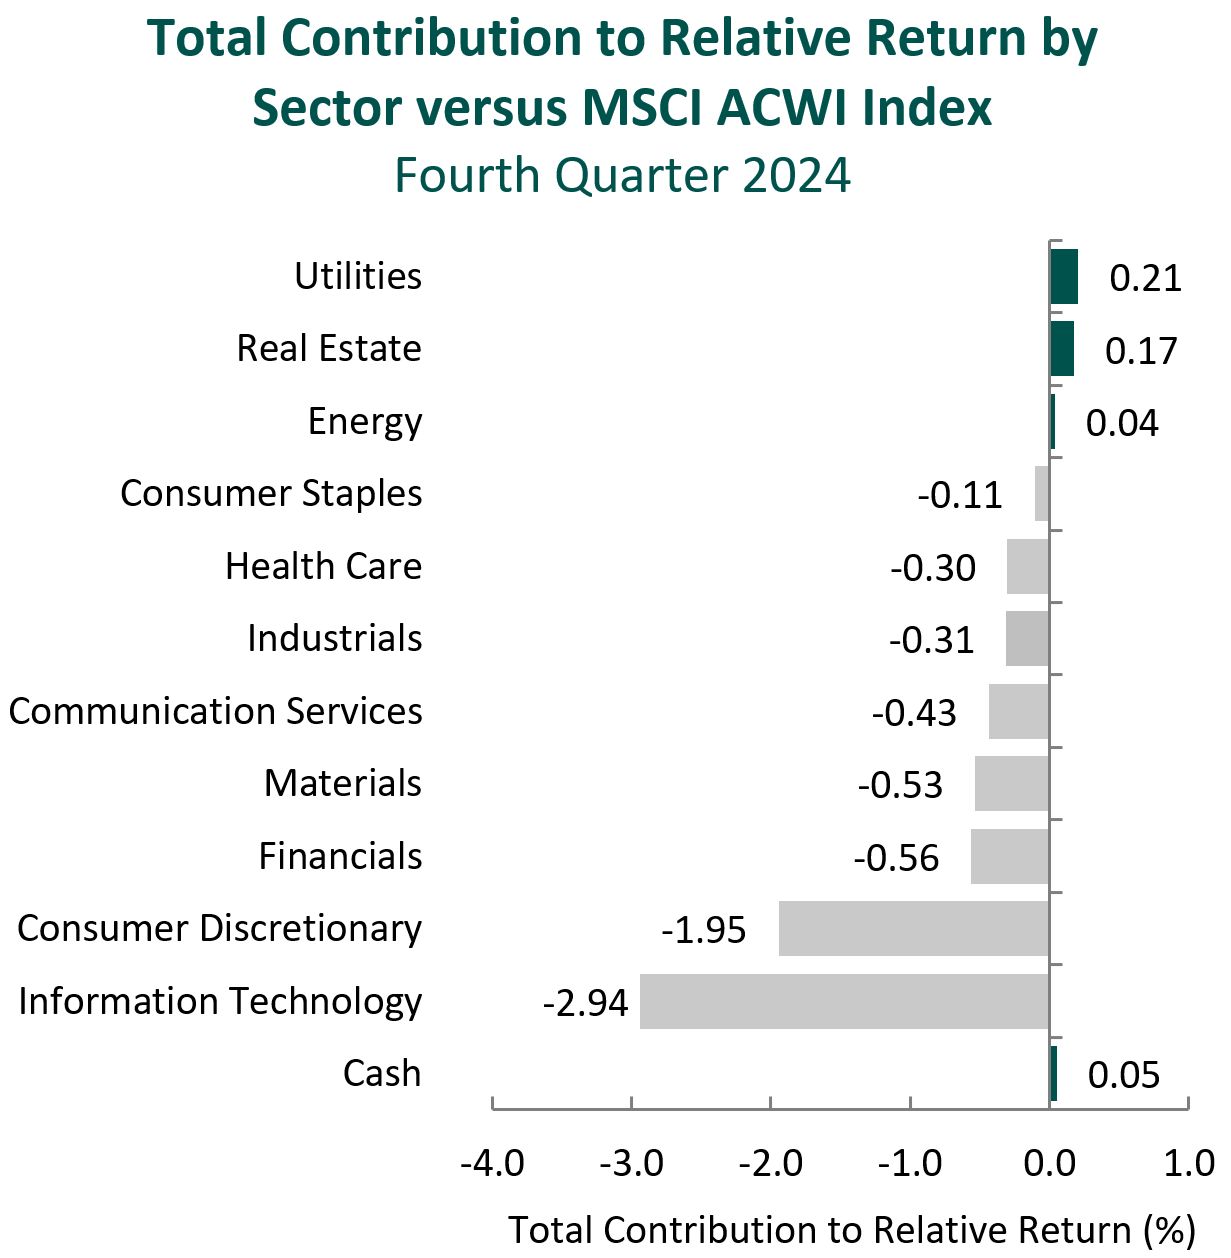
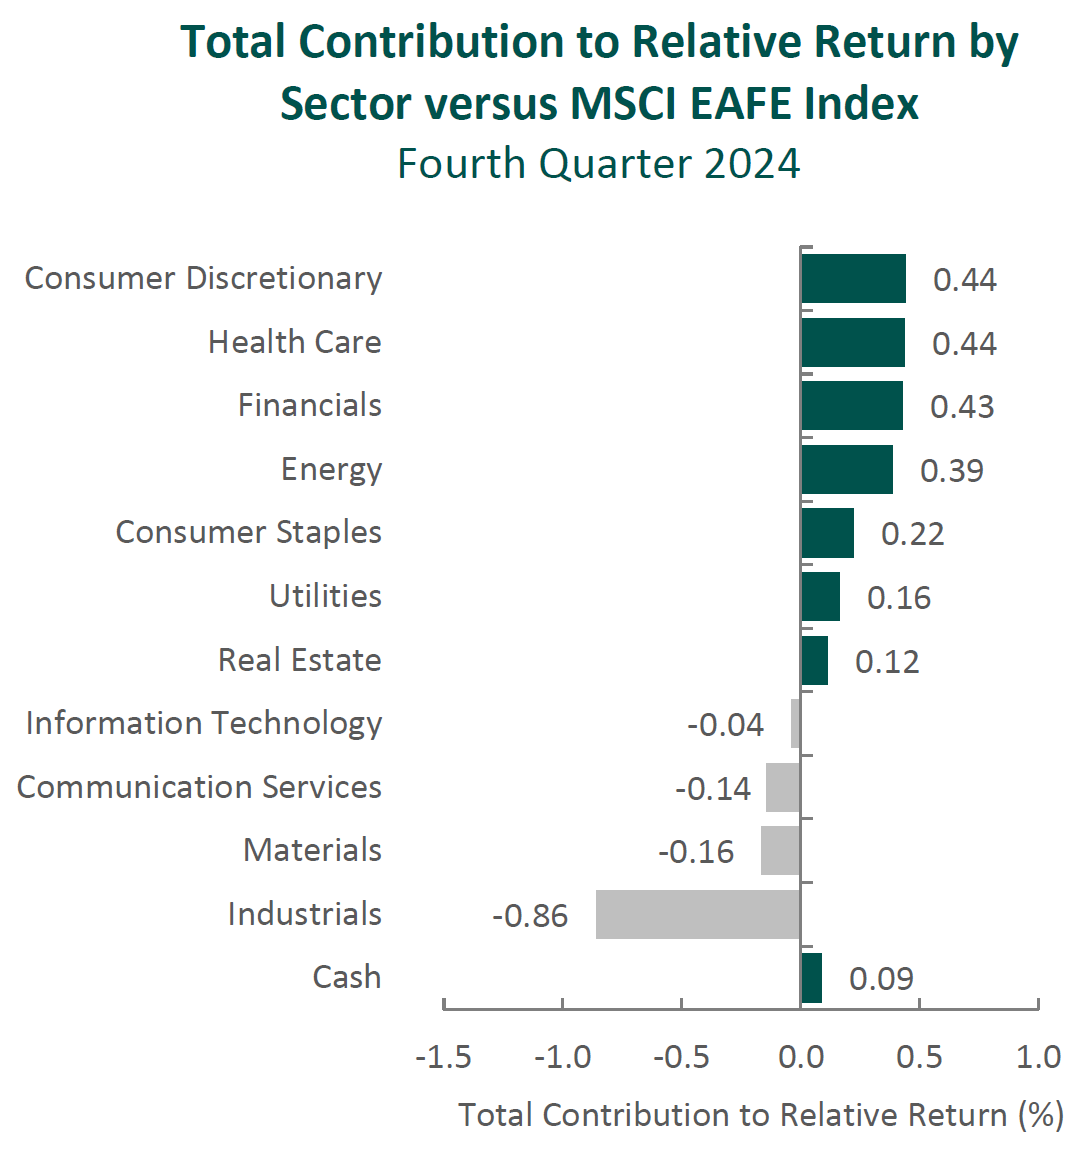
During the first quarter, the portfolio’s underperformance relative to the S&P 500 Index was due to a mix of security selection and allocation effects. Security selection in Information Technology and Industrials detracted the most from relative performance; conversely, security selection in Consumer Discretionary and Utilities contributed the most to relative performance.
Contributors and Detractors for 1Q 2025
| Relative Contributors | Relative Detractors |
|---|---|
| Intercontinental Exchange | Broadcom |
| Guardant Health | ServiceNow |
| O’Reilly Automotive | Bio-Techne |
| Antero Resources | Oracle |
| Vertex Pharmaceuticals | Chart Industries |
Detractors
Boradcom
Broadcom detracted from performance in the first quarter. The release of the DeepSeek AI model and analysis of technological specifications stunned investors. This raised concerns about a rapid decline in AI model development costs and the effect that will have on capex spending for new infrastructure and advanced semiconductors used for accelerated computing needs. The entire AI infrastructure investment space saw significant declines in the final week of January following the DeepSeek announcements and continued to see further weakness in March as concerns around AI capex cuts increased.
ServiceNow
ServiceNow detracted from performance in the first quarter, as the company reported guidance during the fourth quarter earnings call that was below investor expectations. Investors have also begun to incorporate tougher macroeconomic headwinds and negative impacts from the DOGE government spending cuts into their weaker outlook for software revenue growth in 2025.
Contributors
Intercontinental Exchange
Intercontinental Exchange was a relative contributor in the first quarter following a solid fourth quarter earnings report highlighted by continued strong trading activity in energy and interest rate products, additional efficiency gains, and positive commentary about the Mortgage Technology business. In addition, optimism improved following the company’s annual ICE Experience conference, which highlighted new AI solutions in its Mortgage Technology product suite. The company’s AI efforts in Mortgage Technology are accelerating progress toward improving and digitizing workflows and positioning it to gain an increasing share of the long-term market opportunity in the mortgage industry.
Guardant Health
Guardant Health was a relative contributor in the first quarter following several positive announcements and solid fourth quarter earnings. Guardant announced Advanced Diagnostic Laboratory Test (ADLT) pricing from Medicare on its Guardant Shield test and a contract with the VA hospital system to cover patients over 45 years of age. This follows strong momentum and positive full-year revenue guidance.
Recent Portfolio Activity
The table below shows all buys and sells completed during the quarter, followed by a brief rationale.
| Buys | Sells |
|---|---|
| Analog Devices |
Buys
Analog Devices
Analog Devices is a global semiconductor leader dedicated to solving customers’ most complex engineering challenges. The company delivers innovations that connect technology to human breakthroughs and play a critical role at the intersection of the physical and digital worlds by providing the building blocks to sense, measure, interpret, connect and power. Analog designs, manufactures, tests and markets a broad portfolio of solutions. These solutions include integrated circuits, software and subsystems that leverage high-performance analog, mixed-signal and digital signal processing technologies. Its comprehensive product portfolio, deep domain expertise and advanced manufacturing span high-performance precision and high-speed mixed-signal, power management and processing technologies, including data converters, amplifiers, power management, radio frequency, integrated circuits, edge processors and other sensors. The company’s customers include original equipment manufacturers and customers that build electronic subsystems for integration into larger systems.
We see the company’s analog products providing exposure to high-growth trends, including automotive electrification and driver assistance systems, factory intelligence and automation, the Intelligent Edge, Internet of Things device proliferation and sustainable energy. We expect the company to return excess free cash flow, benefiting shareholders.
Sells
There were no sales in the first quarter of 2025.
Outlook
The equity markets in the first quarter declined as investors digested the potential impact of wide-ranging tariffs, along with concerns of a peak in the capital spending cycle around AI. Interest rates declined in the quarter, with the 10-year U.S. Treasury yield down about 35 basis points. The prospects of tariffs pushing prices higher could put the Fed on hold in a period when the economy starts to weaken. Economic data was mostly in line with expectations, reflecting a moderately growing economy. Although equity market valuations have pulled back, they are still in elevated territory with growing concerns of a slowdown in corporate profits. Our focus will continue to be at the company level, with an emphasis on seeking to invest in companies with secular tailwinds or strong product-driven cycles.
The opinions expressed herein are those of Aristotle Atlantic Partners, LLC (Aristotle Atlantic) and are subject to change without notice. Past performance is not a guarantee or indicator of future results. This material is not financial advice or an offer to purchase or sell any product. You should not assume that any of the securities transactions, sectors or holdings discussed in this report were or will be profitable, or that recommendations Aristotle Atlantic makes in the future will be profitable or equal the performance of the securities listed in this report. The portfolio characteristics shown relate to the Aristotle Atlantic Core Equity strategy. Not every client’s account will have these characteristics. Aristotle Atlantic reserves the right to modify its current investment strategies and techniques based on changing market dynamics or client needs. There is no assurance that any securities discussed herein will remain in an account’s portfolio at the time you receive this report or that securities sold have not been repurchased. The securities discussed may not represent an account’s entire portfolio and, in the aggregate, may represent only a small percentage of an account’s portfolio holdings. The performance attribution presented is of a representative account from Aristotle Atlantic’s Core Equity Composite. The representative account is a discretionary client account which was chosen to most closely reflect the investment style of the strategy. The criteria used for representative account selection is based on the account’s period of time under management and its similarity of holdings in relation to the strategy. Recommendations made in the last 12 months are available upon request.
Returns are presented gross and net of investment advisory fees and include the reinvestment of all income. Gross returns will be reduced by fees and other expenses that may be incurred in the management of the account. Net returns are presented net of actual investment advisory fees and after the deduction of all trading expenses.
All investments carry a certain degree of risk, including the possible loss of principal. Investments are also subject to political, market, currency and regulatory risks or economic developments. International investments involve special risks that may in particular cause a loss in principal, including currency fluctuation, lower liquidity, different accounting methods and economic and political systems, and higher transaction costs. These risks typically are greater in emerging markets. Securities of small‐ and medium‐sized companies tend to have a shorter history of operations, be more volatile and less liquid. Value stocks can perform differently from the market as a whole and other types of stocks.
The material is provided for informational and/or educational purposes only and is not intended to be and should not be construed as investment, legal or tax advice and/or a legal opinion. Investors should consult their financial and tax adviser before making investments. The opinions referenced are as of the date of publication, may be modified due to changes in the market or economic conditions, and may not necessarily come to pass. Information and data presented has been developed internally and/or obtained from sources believed to be reliable. Aristotle Atlantic does not guarantee the accuracy, adequacy or completeness of such information.
Aristotle Atlantic Partners, LLC is an independent registered investment adviser under the Advisers Act of 1940, as amended. Registration does not imply a certain level of skill or training. More information about Aristotle Atlantic, including our investment strategies, fees and objectives, can be found in our Form ADV Part 2, which is available upon request. AAP-2504-17
 Sources: CAPS Composite Hub
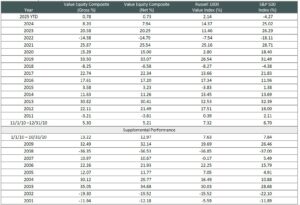
Composite returns for all periods ended March 31, 2025 are preliminary pending final account reconciliation.
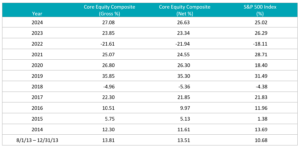
The Aristotle Core Equity Composite has an inception date of August 1, 2013 at a predecessor firm. During this time, Mr. Fitzpatrick had primary responsibility for managing the strategy. Performance starting November 1, 2016 was achieved at Aristotle Atlantic.
Past performance is not indicative of future results. Performance results for periods greater than one year have been annualized. Returns are presented gross and net of investment advisory fees and include the reinvestment of all income. Gross returns will be reduced by fees and other expenses that may be incurred in the management of the account. Net returns are presented net of actual investment advisory fees and after the deduction of all trading expenses.
The Russell 1000® Growth Index measures the performance of the large cap growth segment of the U.S. equity universe. It includes those Russell 1000 companies with higher price-to-book ratios and higher forecasted growth values. This index has been selected as the benchmark and is used for comparison purposes only. The Russell 1000® Value Index measures the performance of the large cap value segment of the U.S. equity universe. It includes those Russell 1000 companies with lower price-to-book ratios and lower expected growth values. The S&P 500® Index is the Standard & Poor’s Composite Index of 500 stocks and is a widely recognized, unmanaged index of common stock prices. The Dow Jones Industrial Average® is a price-weighted measure of 30 U.S. blue-chip companies. The Index covers all industries except transportation and utilities. The NASDAQ Composite Index measures all NASDAQ domestic and international based common type stocks listed on The NASDAQ Stock Market. The NASDAQ Composite includes over 3,000 companies, more than most other stock market indices. The Bloomberg U.S. Aggregate Bond Index is an unmanaged index of domestic investment grade bonds, including corporate, government and mortgage-backed securities. The WTI Crude Oil Index is a major trading classification of sweet light crude oil that serves as a major benchmark price for oil consumed in the United States. The Russell 2000® Index measures the performance of the small cap segment of the U.S. equity universe. The Russell 2000 Index is a subset of the Russell 3000® Index representing approximately 10% of the total market capitalization of that index. It includes approximately 2000 of the smallest securities based on a combination of their market cap and current index membership. The 3-Month U.S. Treasury Bill is a short-term debt obligation backed by the U.S. Treasury Department with a maturity of three months. The Consumer Price Index (CPI) is a measure of the average change over time in the prices paid by urban consumers for a market basket of consumer goods and services. While stock selection is not governed by quantitative rules, a stock typically is added only if the company has an excellent reputation, demonstrates sustained growth and is of interest to a large number of investors. The volatility (beta) of the Composite may be greater or less than its respective benchmarks. It is not possible to invest directly in these indices.


 Composite returns for all periods ended March 31, 2025 are preliminary pending final account reconciliation.