Markets Review
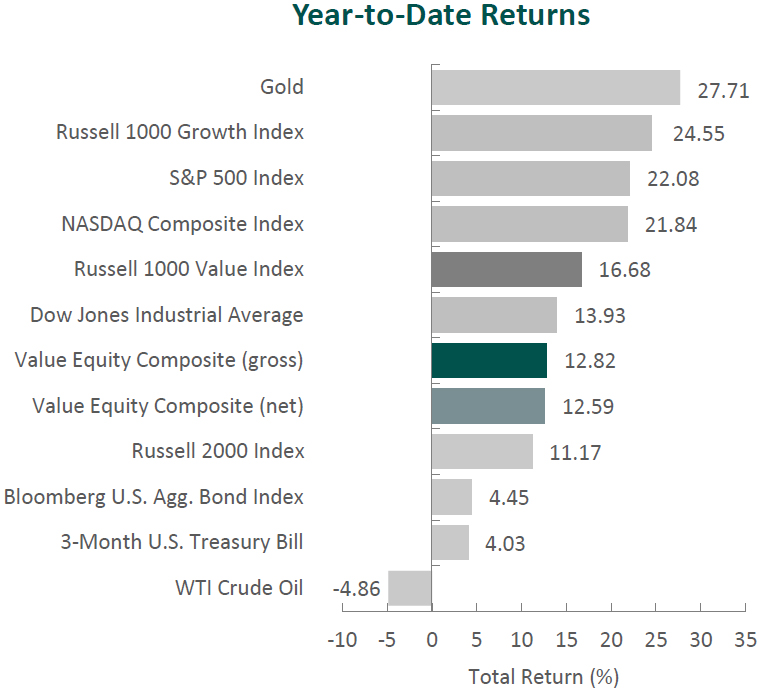
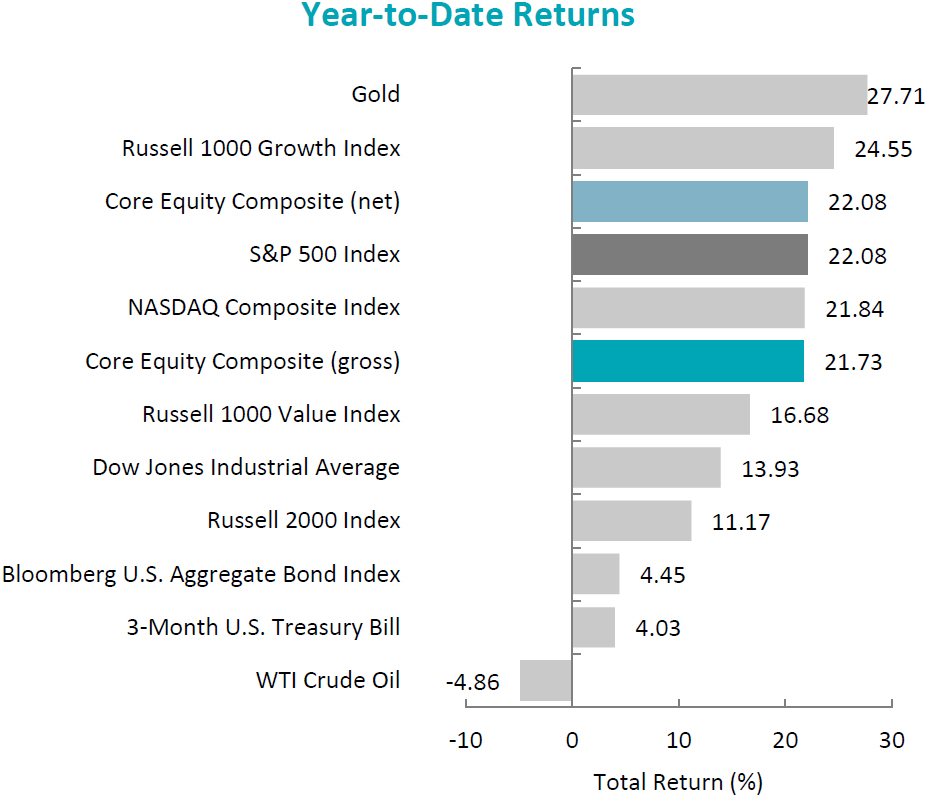
The U.S. equity market continued its ascent to new record highs, with the S&P 500 Index increasing 5.89% during the period. However, unlike last quarter, the market showed broader gains, with the S&P 500 Equal Weight Index outperforming the cap-weighted S&P 500 Index by 3.71%. Concurrently, the Bloomberg U.S. Aggregate Bond Index rose 5.20% for the quarter as interest rates declined. In terms of style, the Russell 1000 Value Index outperformed its growth counterpart by 6.24%.
On a sector basis, gains were made from ten of the eleven sectors within the S&P 500 Index, led by Utilities and Real Estate. The worst-performing sectors were Energy and Information Technology.
Sources: CAPS CompositeHubTM, Bloomberg
Past performance is not indicative of future results. Aristotle Atlantic Core Equity Composite returns are presented gross and net of investment advisory fees and include the reinvestment of all income. Gross returns will be reduced by fees and other expenses that may be incurred in the management of the account. Net returns are presented net of actual investment advisory fees and after the deduction of all trading expenses. Aristotle Atlantic Composite returns are preliminary pending final account reconciliation. Please see important disclosures at the end of this document.
After slowing down for two consecutive quarters, U.S. economic growth accelerated to an annualized rate of 3.0%, as consumer spending and private inventory investments increased. Additionally, inflation inched closer to the Federal Reserve’s 2.0% target, with the CPI increasing at an annualized rate of 2.5% in August and 2.9% in July. Meanwhile, the U.S. labor market cooled slightly, with unemployment at 4.2% and nominal wage growth moderating during the period.
Given the ongoing progress toward target inflation and a softening labor market, the Federal Reserve lowered the target range of the federal funds rate by 50 basis points to 4.75% to 5.00%. Fed Chair Powell acknowledged that loosening policy restraint too quickly could undo progress on inflation, whereas moving too slowly could undermine economic activity and weaken employment. Therefore, Powell stressed the importance of monitoring economic data before making further adjustments to monetary policy.
Corporate earnings remained strong, with S&P 500 companies reporting earnings growth of 11.3%, the highest year-over-year improvement since 2021. Furthermore, only 67 S&P 500 companies issued negative EPS guidance, and about 80% exceeded estimates. Reflecting the general trend of disinflation and a resilient domestic economy, fewer companies mentioned topics like “inflation” and “recession” during earnings calls.
In political news, President Biden announced he would not seek re-election. Vice President Kamala Harris was subsequently named the official Democratic presidential nominee for the 2024 election. In geopolitics, tensions in the Middle East escalated as clashes between Israeli forces and Hezbollah fighters intensified. In response, the U.S. announced the urgent deployment of additional troops to the region in case of a wider regional conflict, while simultaneously mediating a potential ceasefire between the groups.
Performance and Attribution Summary
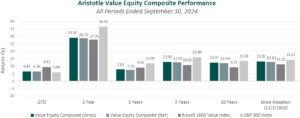
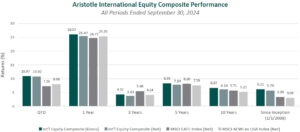
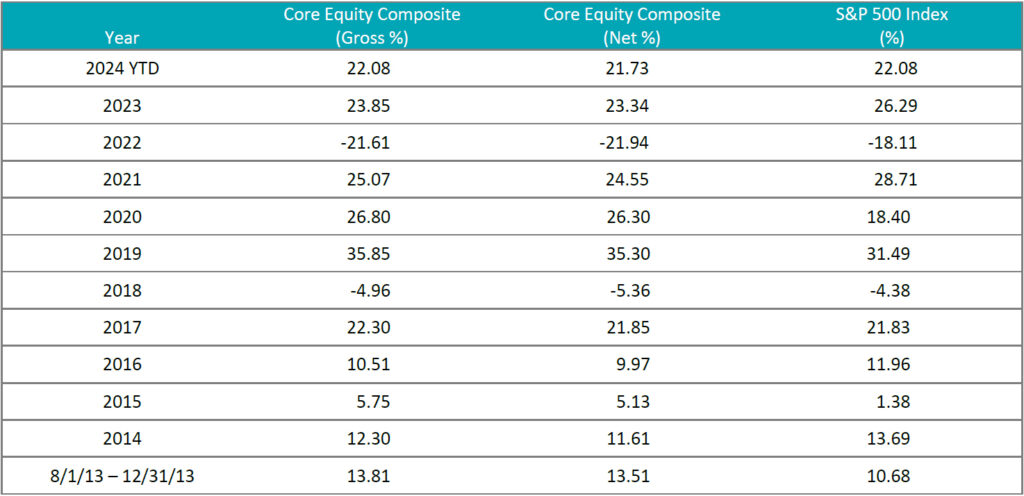
For the third quarter of 2024, Aristotle Atlantic’s Core Equity Composite posted a total return of 3.19% gross of fees (3.09% net of fees), underperforming the S&P 500 Index, which recorded a total return of 5.89%.
| Performance (%) | 3Q24 | 1 Year | 3 Years | 5 Years | 10 Years | Since Inception* |
|---|---|---|---|---|---|---|
| Core Equity Composite (gross) | 3.19 | 37.86 | 9.30 | 15.37 | 13.71 | 14.26 |
| Core Equity Composite (net) | 3.09 | 37.37 | 8.86 | 14.90 | 13.22 | 13.75 |
| S&P 500 Index | 5.89 | 36.35 | 11.91 | 15.98 | 13.38 | 13.73 |
Source: FactSet
Past performance is not indicative of future results. Attribution results are based on sector returns which are gross of investment advisory fees. Attribution is based on performance that is gross of investment advisory fees and includes the reinvestment of income. Please see important disclosures at the end of this document.
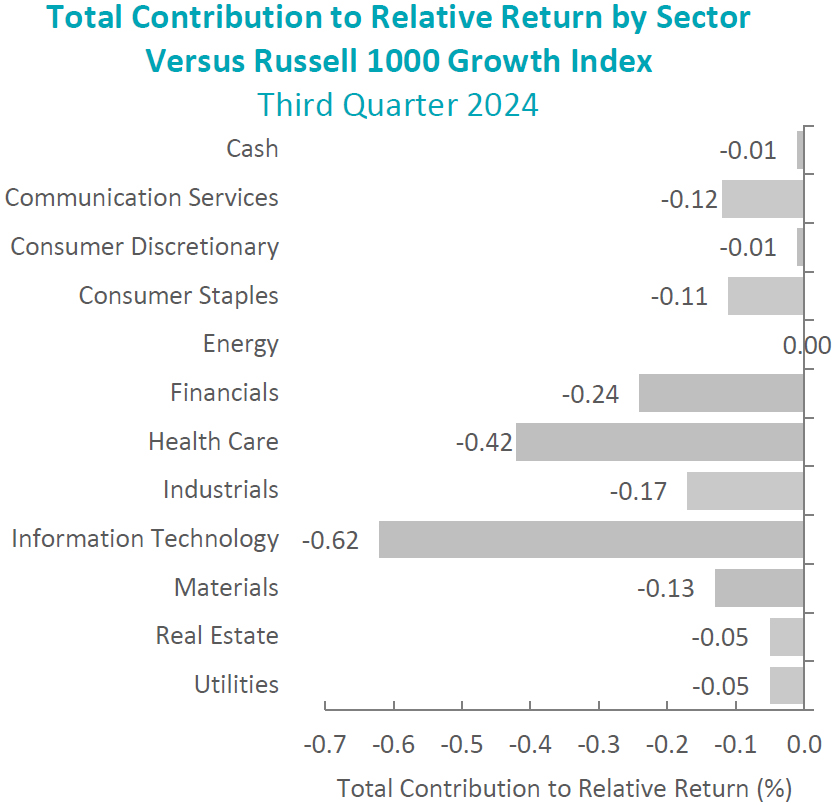
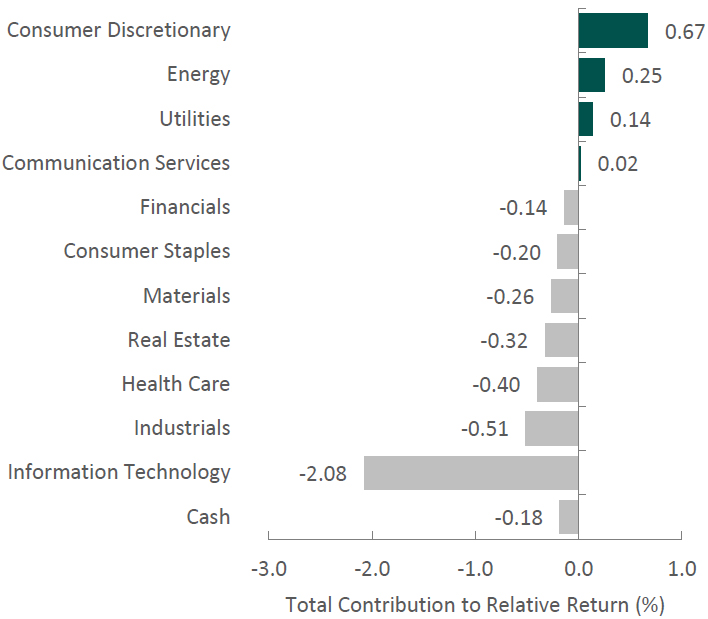
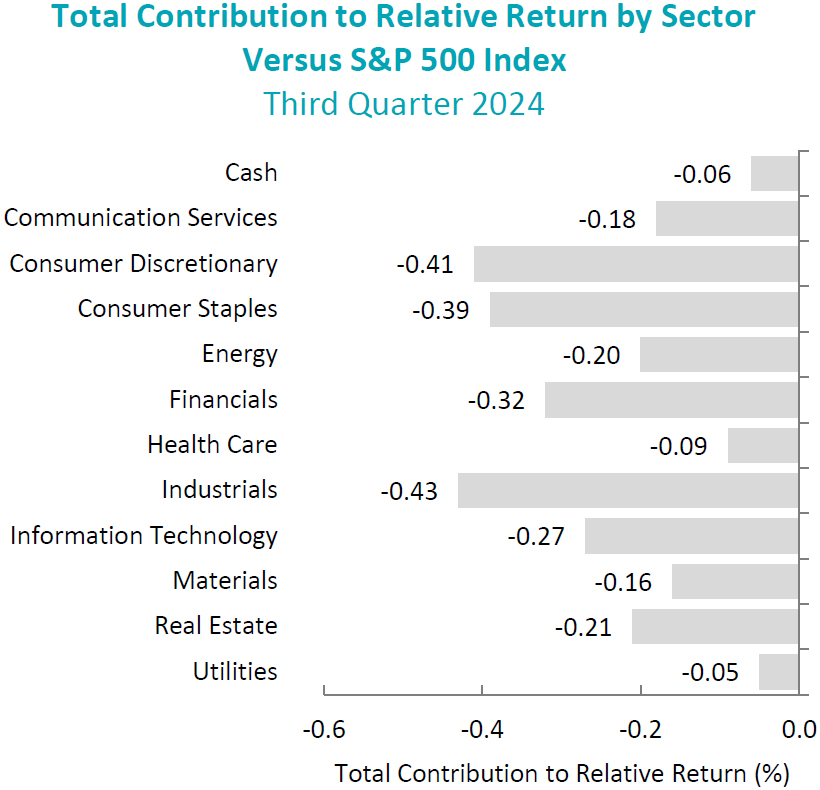
During the third quarter, the portfolio’s underperformance relative to the S&P 500 Index was due to security selection. Security selection in Industrials and Consumer Discretionary detracted the most from relative performance. Conversely, security selection in Utilities and Health Care detracted the least from relative performance.
Contributors and Detractors for 3Q 2024
| Relative Contributors | Relative Detractors |
|---|---|
| Trane Technologies | Applied Materials |
| Intercontinental Exchange | Halliburton |
| Norfolk Southern | Alphabet |
| NextEra Energy | Antero Resources |
| Home Depot | Guardant Health |
Contributors
Trane Technologies
Trane Technologies contributed to performance in the third quarter. After reporting second quarter earnings and revenue that exceeded consensus estimates in early August, the company’s management appeared at multiple investor events in September where they spoke about opportunities for the HVAC market. There is strength in the commercial business related to improving energy efficiency demand broadly and additional cooling opportunities in data centers. The residential business is beginning to recover after a period of weakness.
Intercontinental Exchange
Intercontinental Exchange contributed to portfolio performance in the third quarter, driven by continued strength in the company’s Exchanges segment and expectations that the Mortgage Technology segment’s revenues have troughed ahead of an eventual recovery in U.S. housing market activity. Exchanges’ revenues continue to be driven by growth in energy and interest rate futures trading volumes, with energy trading activity expected to remain elevated, primarily bolstered by increasing data center-driven electricity demand.
Detractors
Applied Materials
Applied Materials detracted from performance in the third quarter as the stock was part of the general investor pullback in AI-related semiconductor names due to concerns about overall AI market growth in the near-term and profitability of the massive capex investments being made in AI infrastructure. The company delivered an inline quarter with solid execution and it continues to benefit from a secular shift to highly complex semiconductors design and manufacturing, but there continue to be pockets of weakness and concerns that include weaker NAND manufacturing and potential for further trade restrictions on Chinese equipment purchases.
Halliburton
Halliburton detracted from performance in the third quarter, as oil prices pulled back on increasing concerns about a slowdown in the U.S. and the global economy and continued headwinds from lower-than-expected growth in the Chinese economy. Halliburton reported second quarter earnings that indicated a weakening North American market for its services, and this was reflected in the company’s guide for the second half of the year, which showed the slower North American market continuing through the end of the year. We believe that 2024 will mark the trough for Halliburton’s North American market and that it should benefit from improving demand from a strengthening natural gas price and newly consolidated customers seeking to use the company’s high-quality product offerings. We are also anticipating better-than-expected growth from its international markets, including offshore. We believe that the current valuation continues to reflect a significantly more negative outlook for the North American market than we view for 2025.
Recent Portfolio Activity
The table below shows all buys and sells completed during the quarter, followed by a brief rationale.
| Buys | Sells |
|---|---|
| None | Estée Lauder |
Buys
None
Sells
Estée Lauder Inc.
We sold Estée Lauder, as Chinese consumer headwinds continue to present an unpredictable pace of recovery. And while Estée has taken action to reduce costs and drive a profit recovery plan, it is apparent that a certain level of volume will be necessary to make that plan successful, and that is difficult to predict with a high degree of certainty. China-driven travel retail business continues to be slower than anticipated, pushing out the expected timing of a recovery. Despite the weakness in share price, Estée continues to trade at a premium multiple, and consensus estimates may prove aggressive should Chinese consumer weakness linger. Lastly, with a pending transition in both the CFO and CEO roles, we see the potential for another reset as the new management team takes over.
Outlook
The equity markets in the third quarter posted positive returns, led by the interest rate sensitive sectors of Utilities and Real Estate. The sector performance reflected a sizable decline in interest rates with the 10-year U.S. Treasury yield down by about 70 basis points for the quarter. Economic activity continued to show signs of moderating with the ISM Manufacturing Index remaining in contraction territory and employment statistics slowing. Equity valuation levels remain elevated compared to historical levels, leaving little room for a sizable multiple expansion. There has been no improvement in the geopolitical situation and the US Presidential election remains a toss-up. The market has become more sensitive to a potential recession and declining earnings and less focused on inflation. Although the upside is more muted given the elevated valuation levels, the backdrop of lower interest rates and moderate earnings growth should support equity markets. Our focus will continue to be at the company level, with an emphasis on seeking to invest in companies with secular tailwinds or strong product-driven cycles.
The opinions expressed herein are those of Aristotle Atlantic Partners, LLC (Aristotle Atlantic) and are subject to change without notice. Past performance is not a guarantee or indicator of future results. This material is not financial advice or an offer to purchase or sell any product. You should not assume that any of the securities transactions, sectors or holdings discussed in this report were or will be profitable, or that recommendations Aristotle Atlantic makes in the future will be profitable or equal the performance of the securities listed in this report. The portfolio characteristics shown relate to the Aristotle Atlantic Core Equity strategy. Not every client’s account will have these characteristics. Aristotle Atlantic reserves the right to modify its current investment strategies and techniques based on changing market dynamics or client needs. There is no assurance that any securities discussed herein will remain in an account’s portfolio at the time you receive this report or that securities sold have not been repurchased. The securities discussed may not represent an account’s entire portfolio and, in the aggregate, may represent only a small percentage of an account’s portfolio holdings. The performance attribution presented is of a representative account from Aristotle Atlantic’s Core Equity Composite. The representative account is a discretionary client account which was chosen to most closely reflect the investment style of the strategy. The criteria used for representative account selection is based on the account’s period of time under management and its similarity of holdings in relation to the strategy. Recommendations made in the last 12 months are available upon request.
Returns are presented gross and net of investment advisory fees and include the reinvestment of all income. Gross returns will be reduced by fees and other expenses that may be incurred in the management of the account. Net returns are presented net of actual investment advisory fees and after the deduction of all trading expenses.
All investments carry a certain degree of risk, including the possible loss of principal. Investments are also subject to political, market, currency and regulatory risks or economic developments. International investments involve special risks that may in particular cause a loss in principal, including currency fluctuation, lower liquidity, different accounting methods and economic and political systems, and higher transaction costs. These risks typically are greater in emerging markets. Securities of small‐ and medium‐sized companies tend to have a shorter history of operations, be more volatile and less liquid. Value stocks can perform differently from the market as a whole and other types of stocks.
The material is provided for informational and/or educational purposes only and is not intended to be and should not be construed as investment, legal or tax advice and/or a legal opinion. Investors should consult their financial and tax adviser before making investments. The opinions referenced are as of the date of publication, may be modified due to changes in the market or economic conditions, and may not necessarily come to pass. Information and data presented has been developed internally and/or obtained from sources believed to be reliable. Aristotle Atlantic does not guarantee the accuracy, adequacy or completeness of such information.
Aristotle Atlantic Partners, LLC is an independent registered investment adviser under the Advisers Act of 1940, as amended. Registration does not imply a certain level of skill or training. More information about Aristotle Atlantic, including our investment strategies, fees and objectives, can be found in our Form ADV Part 2, which is available upon request. AAP-2410-21.

Sources: CAPS Composite Hub, Russell Investments
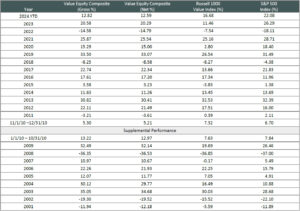
Composite returns for all periods ended September 30, 2024 are preliminary pending final account reconciliation.
The Aristotle Core Equity Composite has an inception date of August 1, 2013 at a predecessor firm. During this time, Mr. Fitzpatrick had primary responsibility for managing the strategy. Performance starting November 1, 2016 was achieved at Aristotle Atlantic.
Past performance is not indicative of future results. Performance results for periods greater than one year have been annualized. Returns are presented gross and net of investment advisory fees and include the reinvestment of all income. Gross returns will be reduced by fees and other expenses that may be incurred in the management of the account. Net returns are presented net of actual investment advisory fees and after the deduction of all trading expenses.
The Russell 1000® Growth Index measures the performance of the large cap growth segment of the U.S. equity universe. It includes those Russell 1000 companies with higher price-to-book ratios and higher forecasted growth values. This index has been selected as the benchmark and is used for comparison purposes only. The Russell 1000® Value Index measures the performance of the large cap value segment of the U.S. equity universe. It includes those Russell 1000 companies with lower price-to-book ratios and lower expected growth values. The S&P 500® Index is the Standard & Poor’s Composite Index of 500 stocks and is a widely recognized, unmanaged index of common stock prices. The S&P 500® Equal Weight Index (EWI) is the equal-weight version of the widely-used S&P 500. The index includes the same constituents as the capitalization weighted S&P 500, but each company in the S&P 500 EWI is allocated a fixed weight – or 0.2% of the index total at each quarterly rebalance. The Dow Jones Industrial Average® is a price-weighted measure of 30 U.S. blue-chip companies. The Index covers all industries except transportation and utilities. The NASDAQ Composite Index measures all NASDAQ domestic and international based common type stocks listed on The NASDAQ Stock Market. The NASDAQ Composite includes over 3,000 companies, more than most other stock market indices. The Bloomberg U.S. Aggregate Bond Index is an unmanaged index of domestic investment grade bonds, including corporate, government and mortgage-backed securities. The WTI Crude Oil Index is a major trading classification of sweet light crude oil that serves as a major benchmark price for oil consumed in the United States. The Russell 2000® Index measures the performance of the small cap segment of the U.S. equity universe. The Russell 2000 Index is a subset of the Russell 3000® Index representing approximately 10% of the total market capitalization of that index. It includes approximately 2000 of the smallest securities based on a combination of their market cap and current index membership. The 3-Month U.S. Treasury Bill is a short-term debt obligation backed by the U.S. Treasury Department with a maturity of three months. The Consumer Price Index (CPI) is a measure of the average change over time in the prices paid by urban consumers for a market basket of consumer goods and services. While stock selection is not governed by quantitative rules, a stock typically is added only if the company has an excellent reputation, demonstrates sustained growth and is of interest to a large number of investors. The volatility (beta) of the Composite may be greater or less than its respective benchmarks. It is not possible to invest directly in these indices.