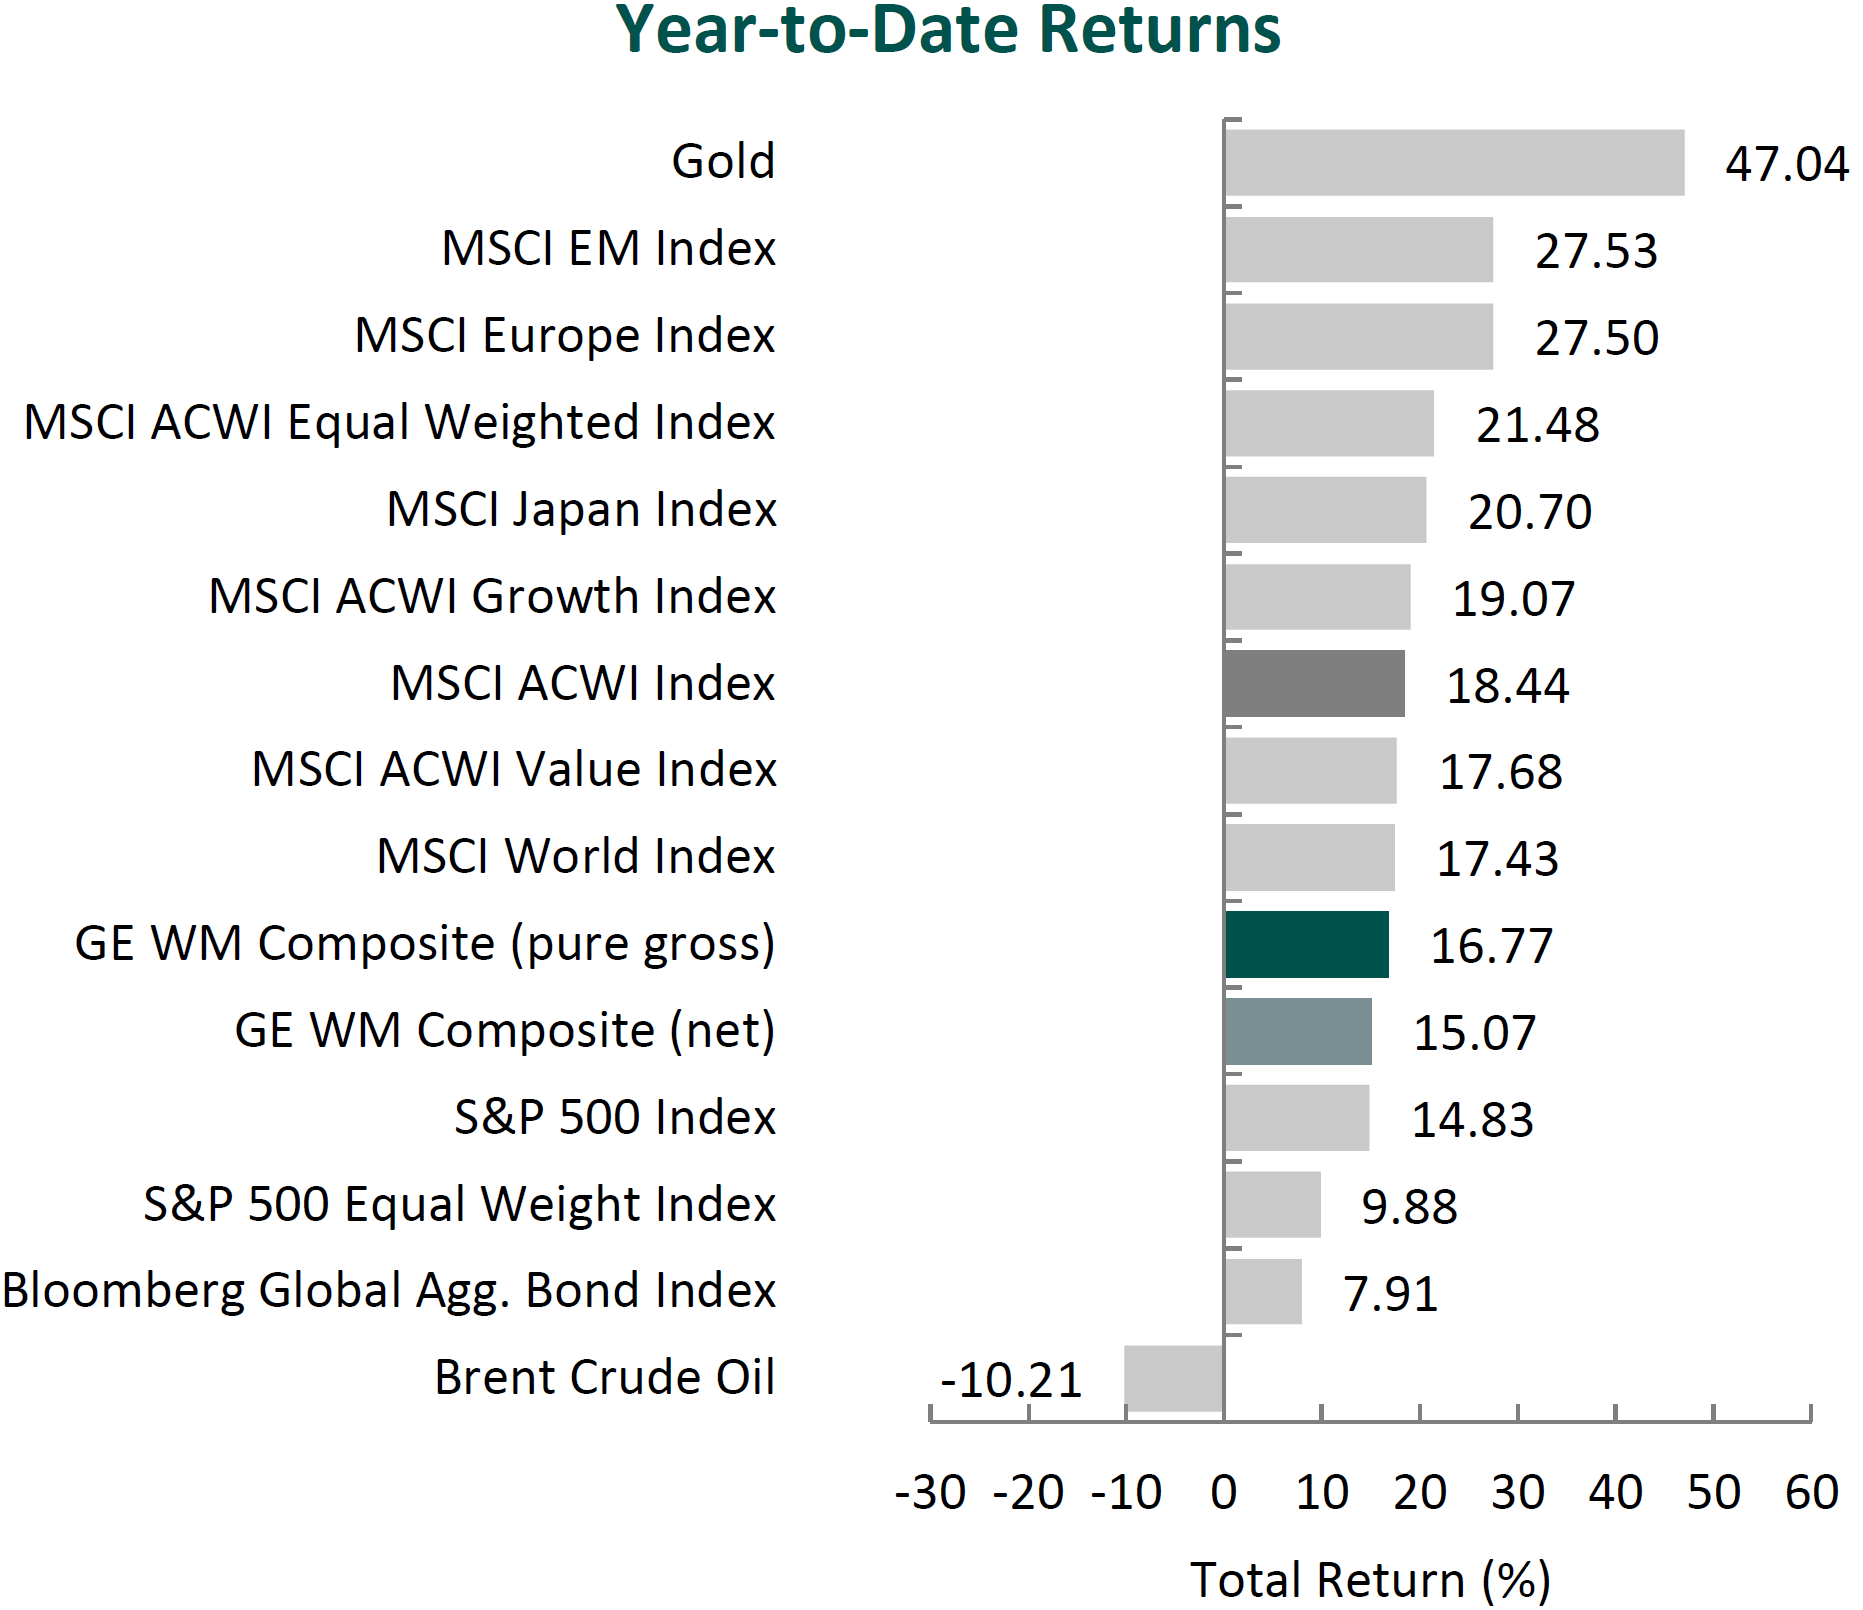


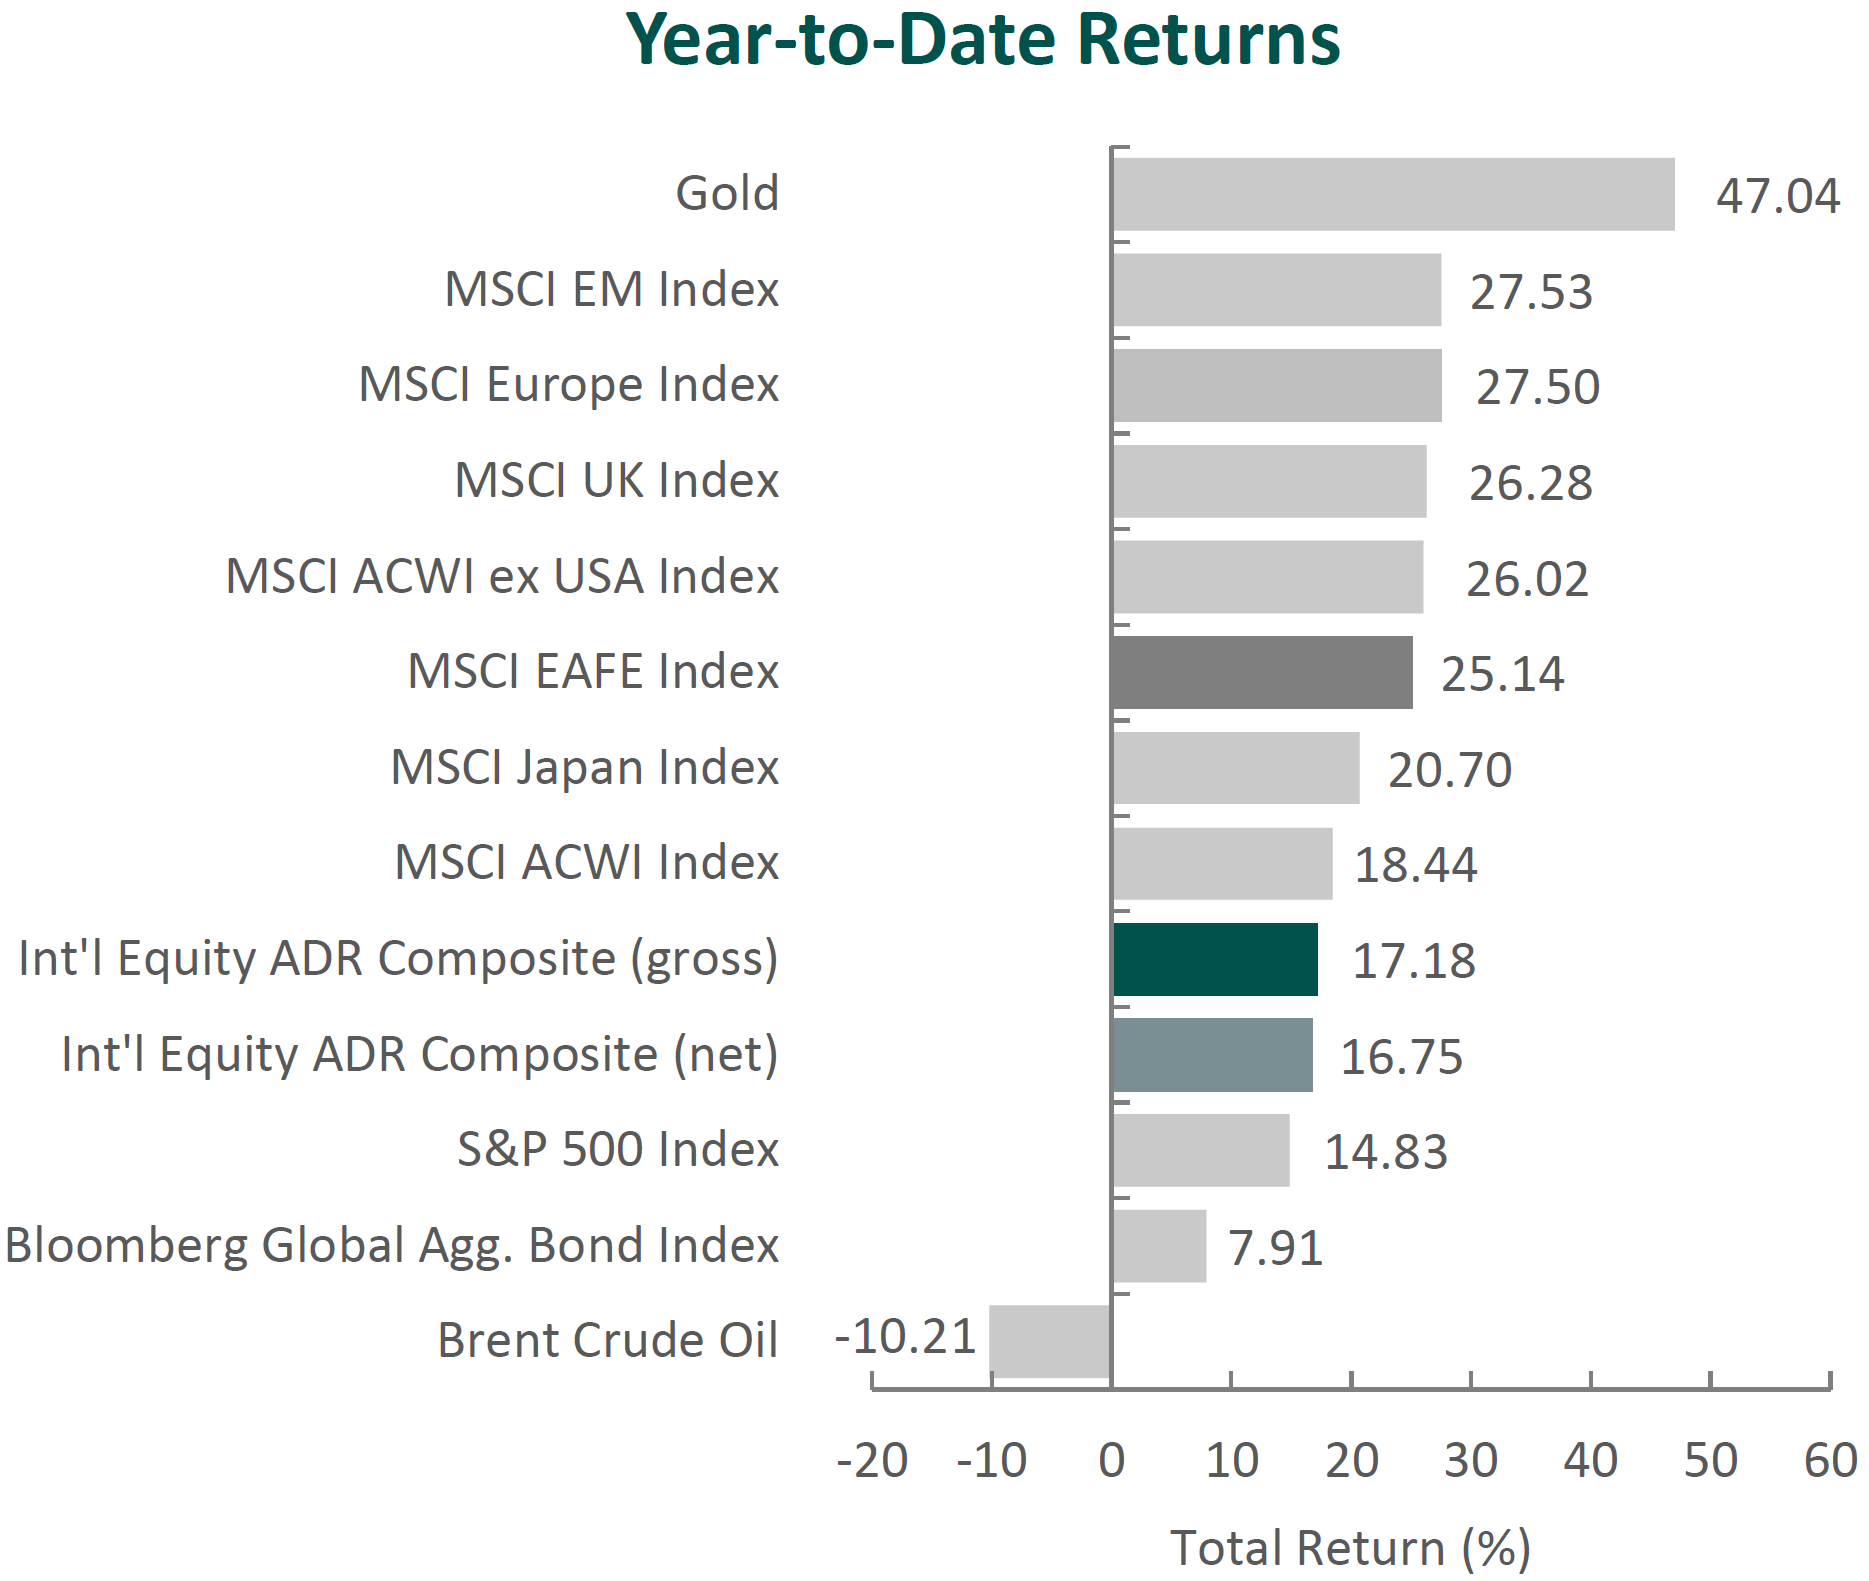
(All MSCI index returns are shown net and in U.S. dollars unless otherwise noted.)
Markets Review
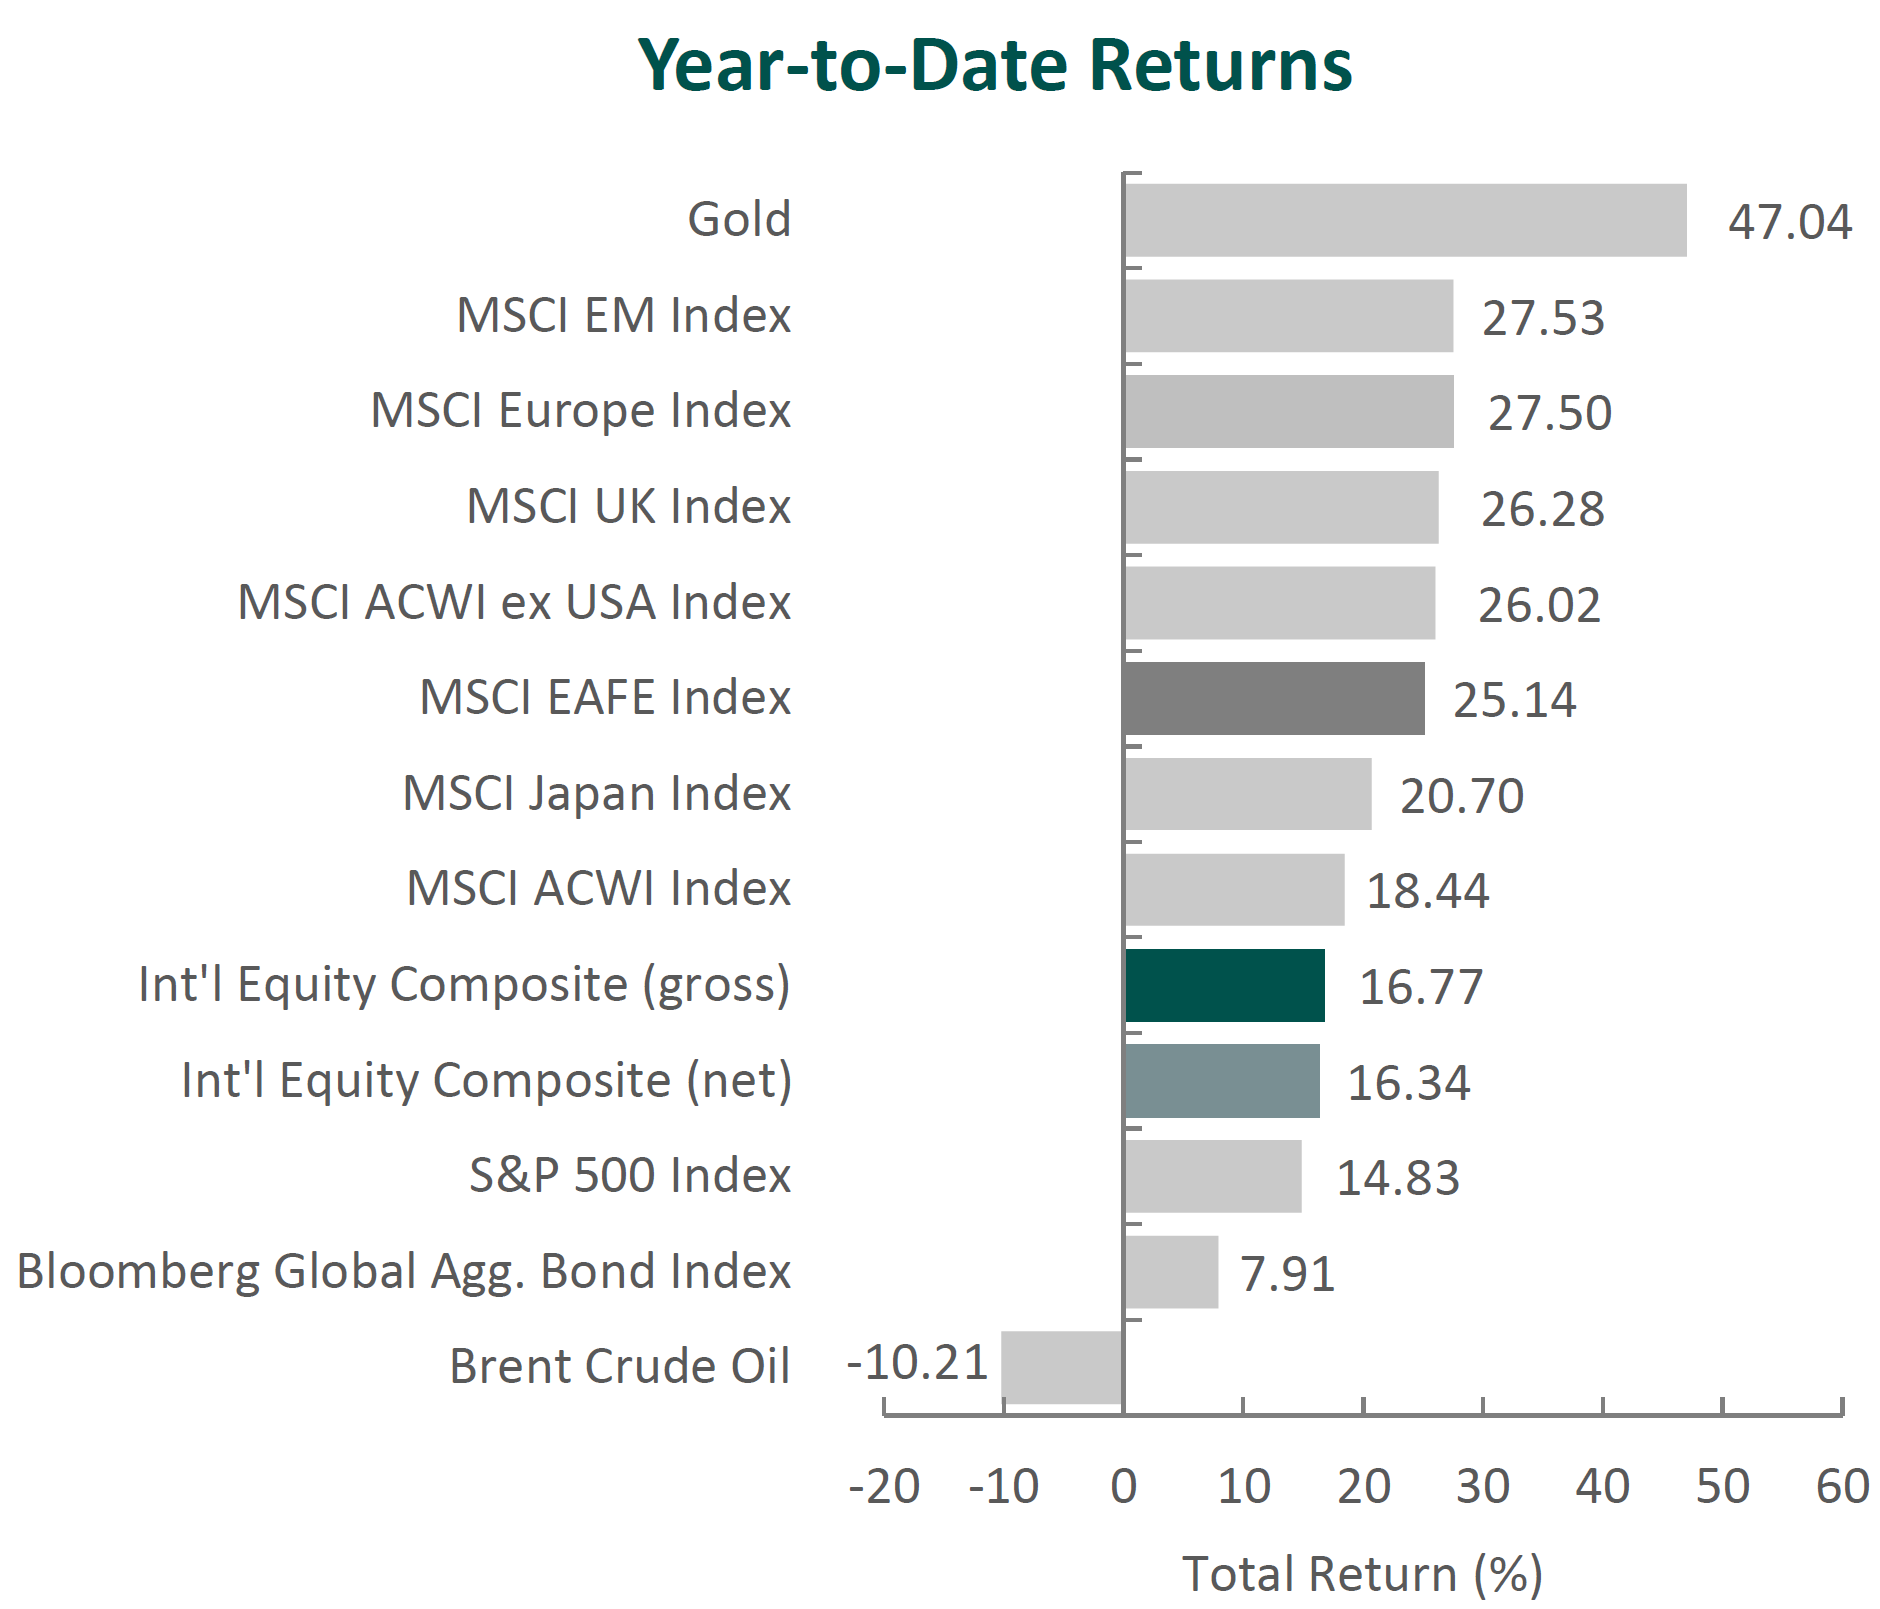
Sources: CAPS CompositeHubTM, Bloomberg
Past performance is not indicative of future results. Aristotle International Equity ADR Composite returns are presented gross and net of investment advisory fees and include the reinvestment of all income. Gross returns will be reduced by fees and other expenses that may be incurred in the management of the account. Net returns are calculated by subtracting a model fee of 0.50% on an annual basis or 0.04167% on a monthly basis, which includes trading costs and the revinvestment of all income. Aristotle Capital Composite returns are preliminary pending final account reconciliation. Please see important disclosures at the end of this document.
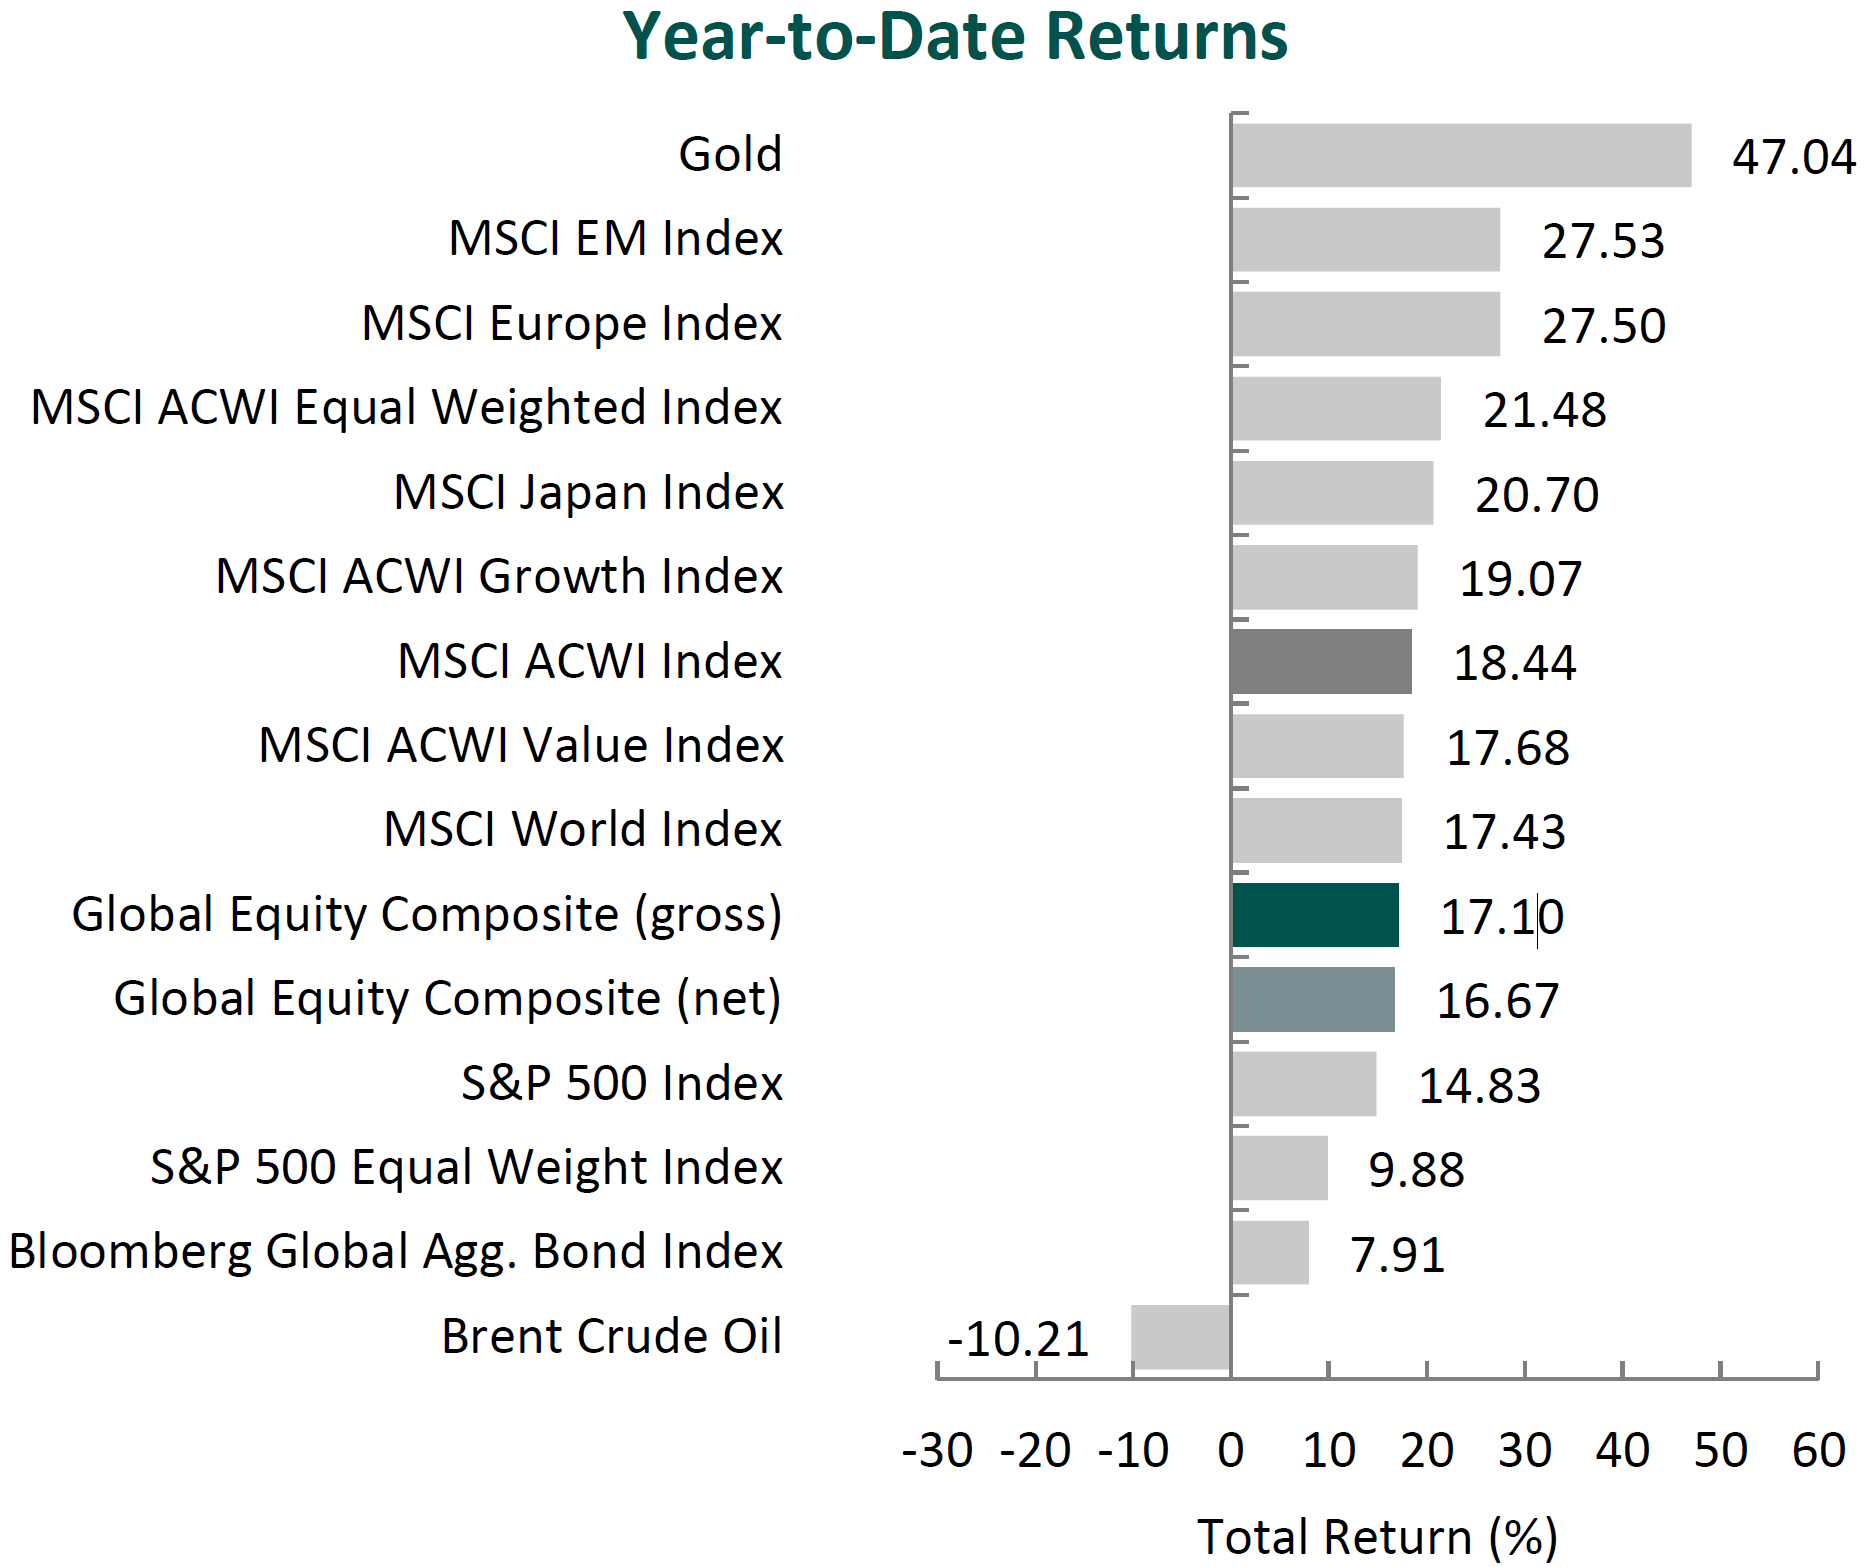
Global equity markets continued to surge, with the MSCI ACWI Index returning 7.62% for the third quarter. Concurrently, global fixed income markets also advanced, as the Bloomberg Global Aggregate Bond Index increased 0.60%. Value stocks underperformed growth stocks over the quarter, with the MSCI ACWI Value Index trailing the MSCI ACWI Growth Index by 2.85%.
The MSCI EAFE Index gained 4.77% during the period, while the MSCI ACWI ex USA Index rose 6.89%. Within the MSCI EAFE Index, Asia and the U.K. were the strongest performers, while Europe & Middle East increased the least. On a sector basis, ten out of the eleven sectors within the MSCI EAFE Index posted positive returns, with Financials, Consumer Discretionary and Energy generating the largest gains. Conversely, Consumer Staples, Health Care and Communication Services performed the worst.
Global growth projections improved, supported by fiscal expansion in major economies and a trade environment that, while still strained, has shown some stabilization compared to earlier this year. The IMF now forecasts global GDP growth of 3.0% in 2025 and 3.1% in 2026, both higher than prior estimates. While uncertainties remain—ranging from trade negotiations and tariff changes to fiscal deficits and geopolitical tensions—financial conditions have strengthened. A notable factor has been the ~14% depreciation of the U.S. dollar against the euro this year, which has helped flatten implied policy paths and provided monetary policy flexibility for developing economies. Meanwhile, global inflation readings were mixed, as headline inflation edged slightly higher, while core inflation declined below 2%, with varying levels on a regional basis.
Europe and the U.S. reached an agreement under which the EU said it would eliminate tariffs on all U.S. industrial goods and expand access to its agricultural market, while the U.S. set a 15% tariff on most EU imports, a rate that was much lower than initially proposed. The EU also pledged $600 billion of investment in the U.S. and committed to purchase $750 billion in U.S. energy products through 2028. Although the scale of these commitments has been met with skepticism, the deal eased near-term pressure on the European Central Bank, which left interest rates unchanged amid volatile trade policy conditions. Similarly, the Bank of England kept rates steady at its September meeting, despite a weakening labor market and slowing economic growth, as U.K. CPI rose 3.8% year-over-year in August. Separately, the U.K. struck a technology agreement with the U.S. under which major U.S. firms will invest in U.K. data centers and AI infrastructure.
In Asia, trade developments were mixed. Japan’s July agreement with the U.S. faces potential renegotiation following Prime Minister Shigeru Ishiba’s resignation after electoral losses. U.S. negotiations with South Korea also remain unresolved, particularly around investment commitments and visa policies. Furthermore, U.S.-India trade relations deteriorated as the Trump administration imposed an additional 25% tariff on Indian imports over continued Russian oil purchases, along with a $100,000 H-1B visa fee disproportionately affecting Indian professionals, who represent more than 70% of recipients. Meanwhile, relations with China steadied as President Trump extended the China tariff deadline by another 90 days and U.S. lawmakers visited Beijing for the first time since 2019. Across Asia, monetary policy generally remained stable, with major central banks keeping interest rates unchanged.
While much of the market’s attention has been fixated on trade policy, geopolitics also garnered headlines as President Putin visited the U.S. for the first time since 2015. While prospects of a ceasefire were tempered, President Trump expressed hopes for a second summit to include Ukrainian President Volodymyr Zelensky. Nevertheless, major hurdles remain, as President Zelensky has rejected any proposal involving territorial concessions in the Donbas region, and Russian media has downplayed the likelihood of a meeting.
Performance and Attribution Summary
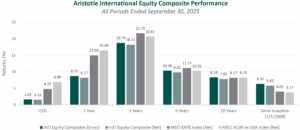
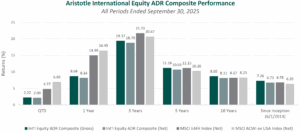
For the third quarter of 2025, Aristotle Capital’s International Equity ADR Composite posted a total return of 2.22% gross of fees (2.09% net of fees), underperforming the MSCI EAFE Index, which returned 4.77%, and the MSCI ACWI ex USA Index, which returned 6.89%. Please refer to the table below for detailed performance.
| Performance (%) | 3Q25 | YTD | 1 Years | 3 Years | 5 Years | 10 Years | Since Inception* |
|---|---|---|---|---|---|---|---|
| International Equity ADR Composite (gross) | 2.22 | 17.18 | 8.68 | 19.37 | 11.18 | 8.65 | 7.26 |
| International Equity ADR Composite (net) | 2.09 | 16.75 | 8.14 | 18.79 | 10.63 | 8.11 | 6.73 |
| MSCI EAFE Index (net) | 4.77 | 25.14 | 14.99 | 21.70 | 11.15 | 8.17 | 6.78 |
| MSCI ACWI ex USA Index (net) | 6.89 | 26.02 | 16.45 | 20.67 | 10.26 | 8.23 | 6.35 |
Source: FactSet
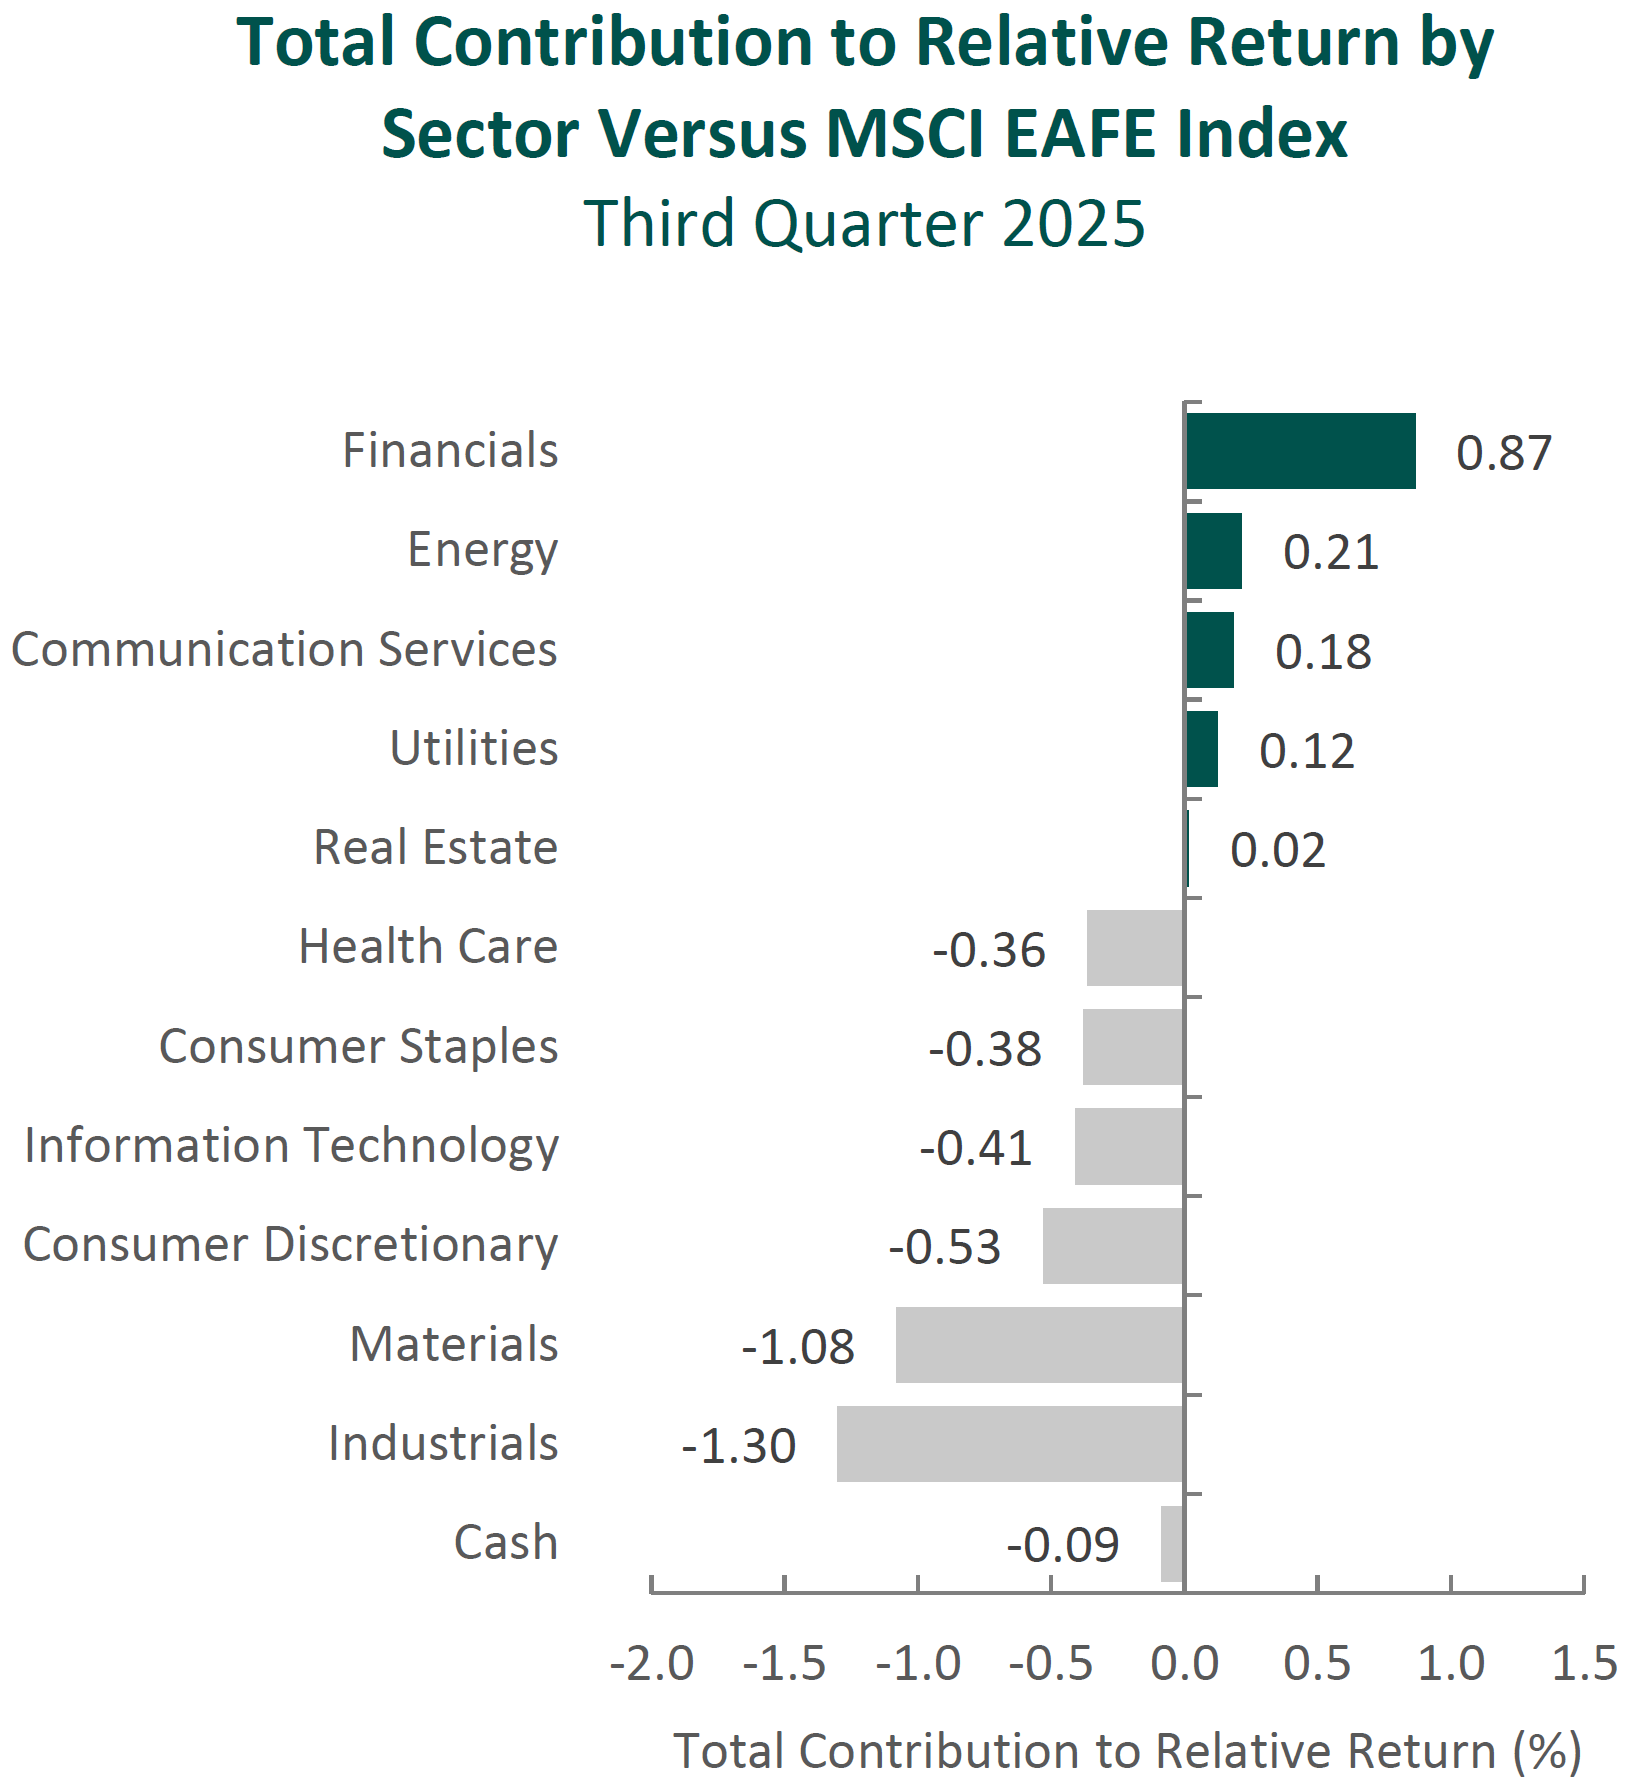
Past performance is not indicative of future results. Sector attribution shows how much of a portfolio’s overall return is directly attributable to stock selection and asset allocation decisions within the portfolio, highlighting which sectors contributed or detracted to the total return. Attribution includes the reinvestment of income. Attribution is presented gross of fees and does not include the deduction of all fees and expenses that a client or investor has paid or would have paid. Please refer to the gross and net composite returns included within to understand the overall impact of fees.
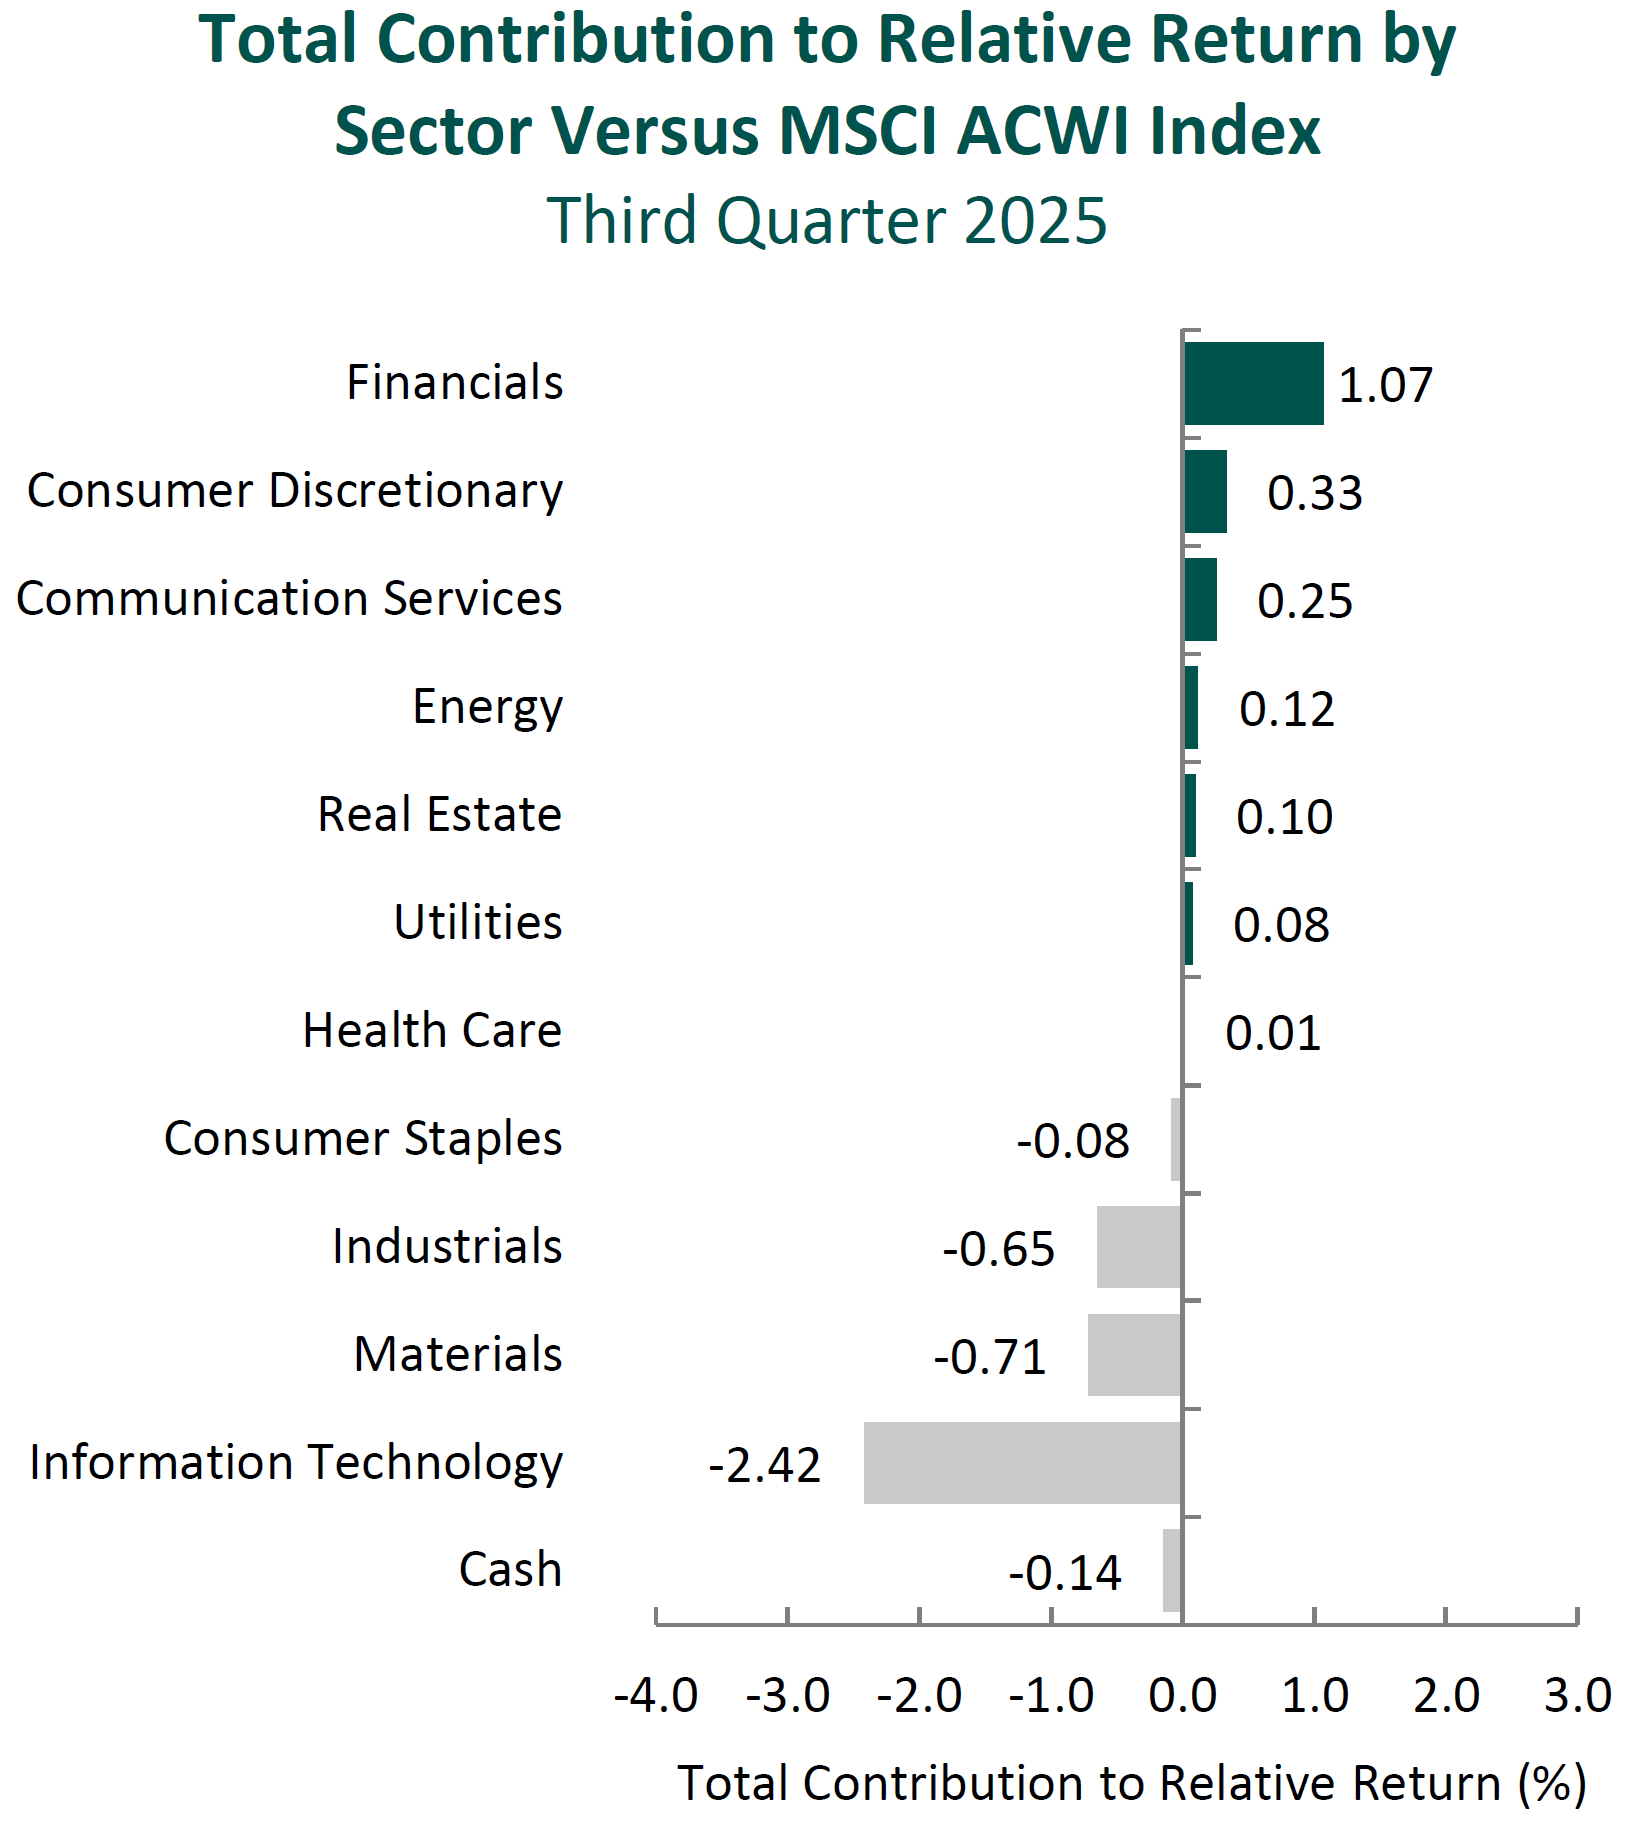
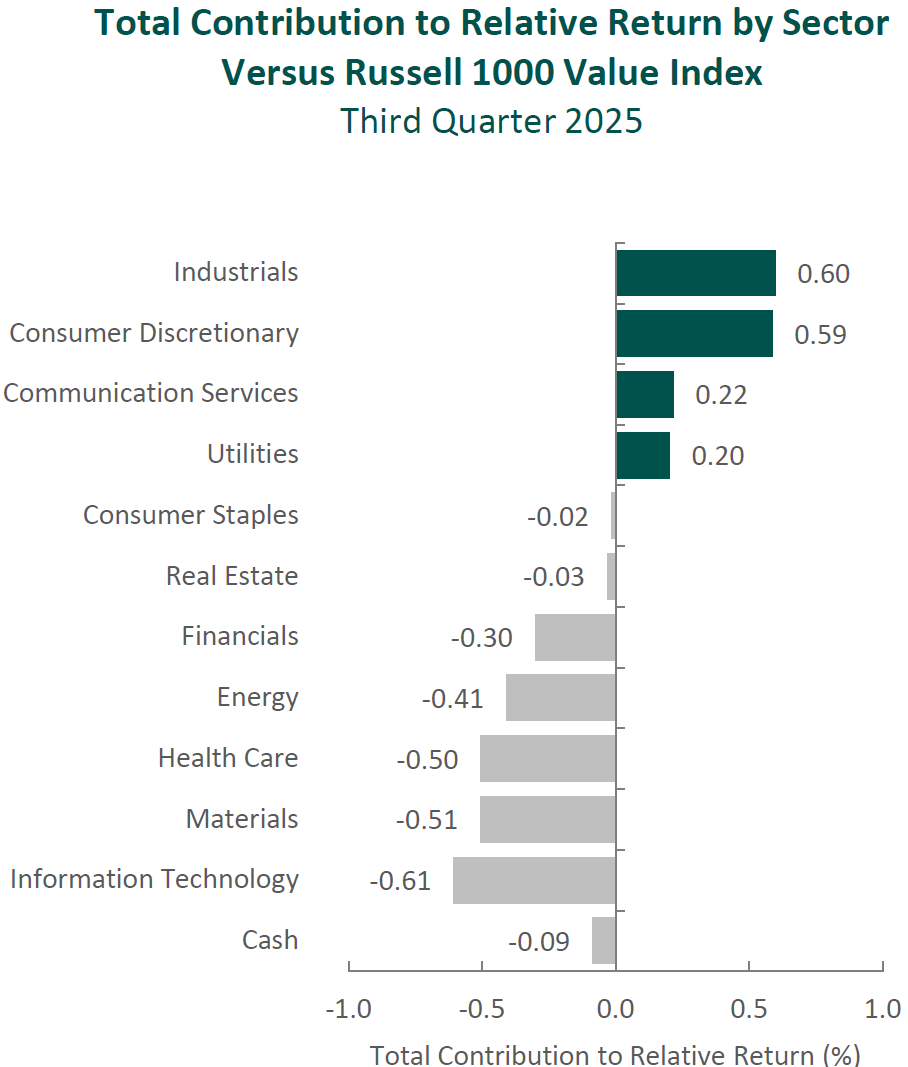
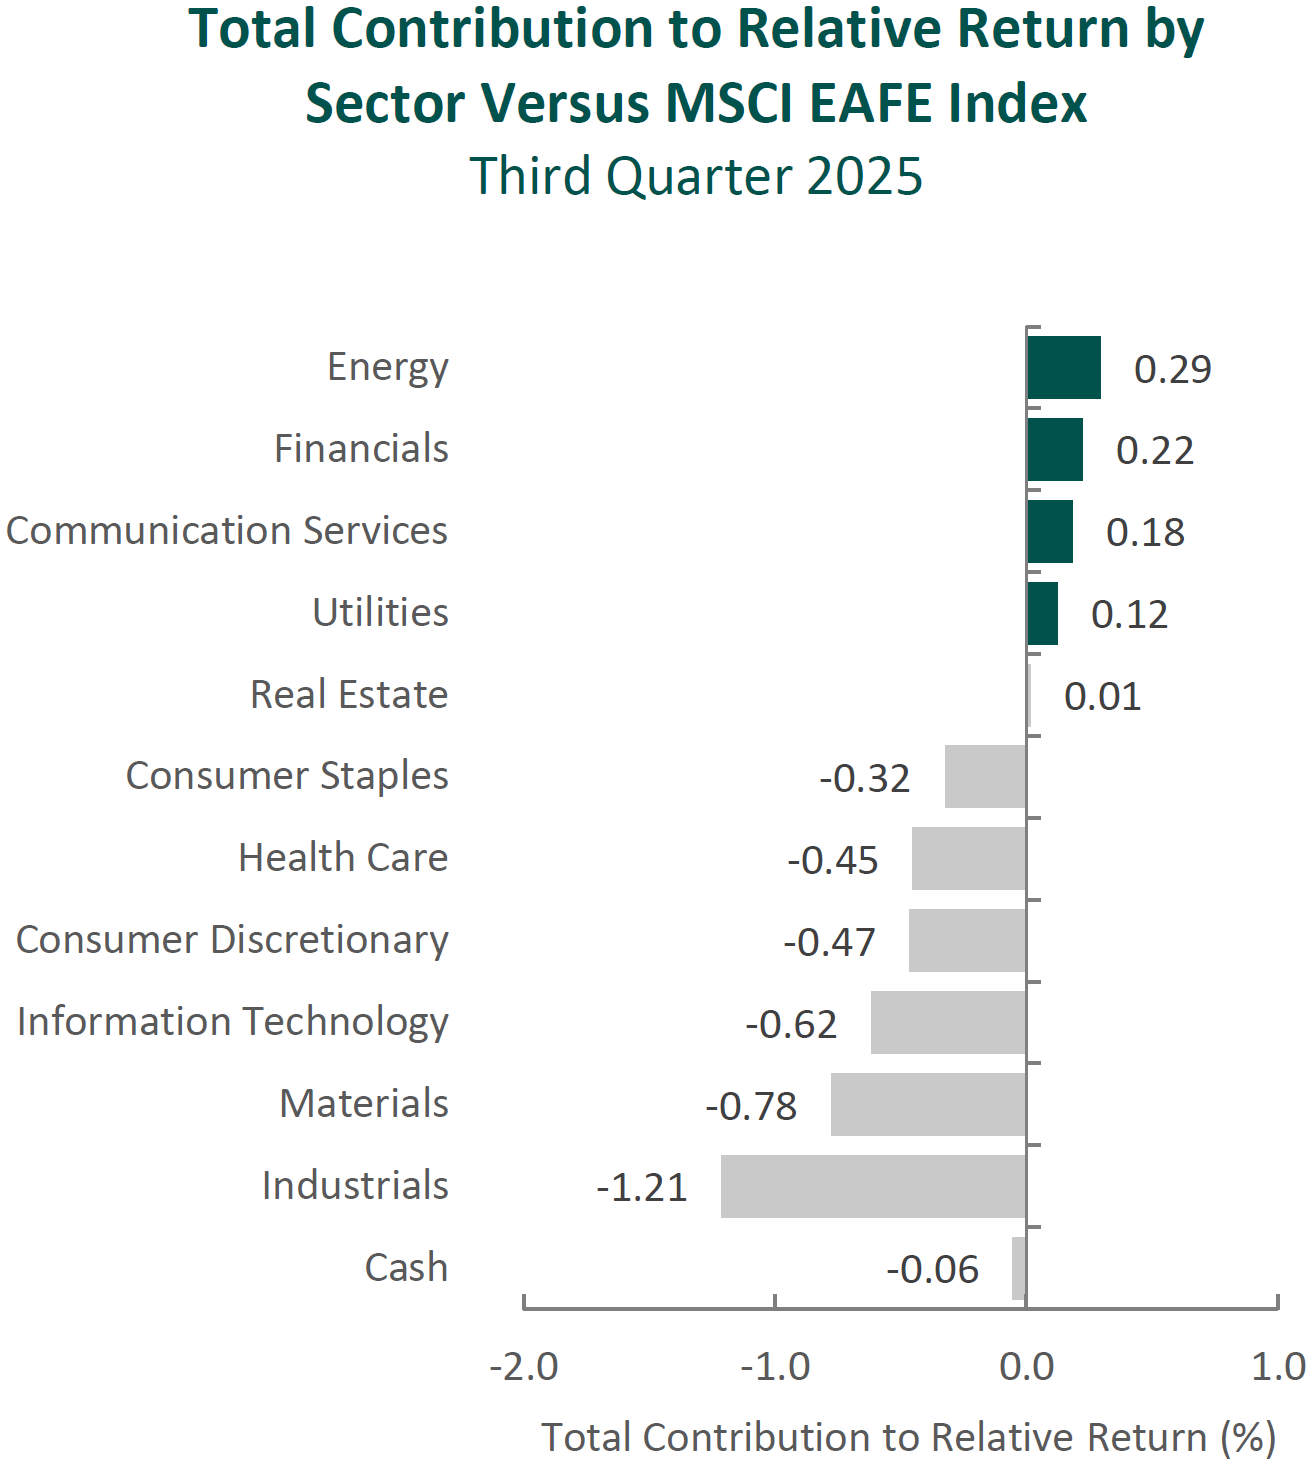
From a sector perspective, the portfolio’s underperformance relative to the MSCI EAFE Index can be attributed to security selection, while allocation effects had a positive impact. Security selection in Industrials, Materials and Consumer Discretionary detracted the most from the portfolio’s relative performance. Conversely, security selection in Financials and Energy, as well as a lack of exposure to Communication Services, contributed to relative returns.
Regionally, security selection was responsible for the portfolio’s underperformance, while allocation effects had a positive impact. Security selection in Asia and the U.K. detracted the most from relative performance, while exposure to Canada and Emerging Markets contributed.
Contributors and Detractors for 3Q 2025
| Relative Contributors | Relative Detractors |
|---|---|
| ING Group | MonotaRO |
| Creditcorp | Accenture |
| Cameco | DSM-Firmenich |
| Sony | Alcom |
| Erste Group Bank | Haleon |
MonotaRO, the Japanese business-to-business (B2B) e-commerce platform, was the largest detractor during the quarter. The company—which enables customers to source millions of maintenance, repair and operations (MRO) products through a centralized digital interface—reported a deceleration in sales growth, prompting downward revisions to full-year targets. Results were impacted by weaker-than-expected demand from industrial end markets, and we believe some of the share price weakness also reflected profit-taking following strong performance in prior periods. From our perspective, these short-term dynamics do not alter the structural advantages of MonotaRO’s business model. The company continues to gain traction with large enterprise customers, who now represent over 30% of sales. These clients typically have higher lifetime value and are more likely to adopt MonotaRO’s value-added services, such as purchase management systems, which enhance customer retention and deepen relationships. Importantly, we believe MonotaRO’s value proposition lies in convenience, execution and product curation—qualities that are difficult to replicate in Japan’s fragmented MRO market. With a high-margin, asset-light model, a scalable platform and a long runway to expand share across businesses of all sizes, we continue to view MonotaRO as a high-quality, competitively advantaged business.
Accenture, the global IT consultancy, was one of the largest detractors. The company’s operations are split roughly evenly between Consulting and Managed Services (outsourcing). While Accenture’s strategic pivot to AI in 2023 has driven a rapid increase in AI-related revenue and bookings (nearly doubling to $5.9 billion in fiscal 2025), investors have grown increasingly concerned about the longer-term impact of AI on its outsourcing business—revenue heavily reliant on billable hours. Moreover, the U.S. government’s DOGE initiative created a headwind, as federal contracts have historically represented about 8% of Accenture’s revenue. Despite these challenges, Accenture continues to grow, albeit at a below-normal rate in the recent period, while simultaneously investing in its workforce—now employing roughly 77,000 AI and data specialists, about 10% of its global staff—and returning billions of dollars to shareholders through double-digit increases in both dividends (+10% year-over-year) and share buybacks (+15%). While we acknowledge that market concerns about AI’s disruptive potential warrant consideration, we believe Accenture shares have been excessively punished (valuations are at 10-year lows). The stock has retreated to mid-2020 levels, even though earnings per share and FREE cash flow are more than 50% and 40% higher, respectively, than they were at that time.
Credicorp, the largest bank in Peru, was a leading contributor during the quarter. Results exceeded expectations, supported by robust loan growth—particularly in microfinance and retail segments—stable asset quality and disciplined cost management, even as Peru’s central bank cut rates. From our perspective, these outcomes represent the strength of a well-executed long-term strategy. Credicorp’s multi-pronged platform—anchored in banking, insurance and wealth management—offers durable advantages in an underpenetrated financial system. Its leading positions in microfinance (via Mibanco), pension fund management and investment advisory foster lasting customer relationships and recurring revenue through multi-product engagement. The company is also prudently expanding its digital ecosystem, enhancing efficiency and broadening access across income levels. Importantly, even amid macroeconomic uncertainty, management has consistently prioritized long-term value over volume, allocating capital conservatively and maintaining disciplined underwriting. We believe this enduring combination of diversification, market leadership and risk-aware culture supports our conviction in Credicorp as a resilient business with the ability to compound value over time.
Erste Group Bank, a leading retail and commercial bank in Central and Eastern Europe, was a primary contributor during the quarter. Shares rose following strong results, supported by healthy loan growth, stable deposits and solid fee income. Looking beyond near-term performance, Erste announced its intent to acquire a significant stake in Santander Bank Polska, one of Poland’s largest banks. This transaction would expand Erste’s geographic footprint into a structurally attractive market, adding scale and diversification while providing exposure to one of the fastest-growing economies in the region. As a retail-oriented bank with meaningful exposure to underbanked populations across Central and Eastern Europe, we believe Erste is well positioned to benefit as Central and Eastern economies grow, cross key income thresholds, and drive increasing demand for financial services. In addition, we believe ongoing cost efficiencies—particularly through increased use of technology—should further improve profitability.
Recent Portfolio Activity
| Buys | Sells |
|---|---|
| Wal-Mart de Mexico | None |
During the quarter, we invested in Wal-Mart de Mexico.
Wal-Mart de Mexico SAB de CV
Founded in 1952 and headquartered in Mexico City, Wal-Mart de Mexico (Walmex) is the largest retailer in Mexico and Central America and a key subsidiary of Walmart Inc., which retains a majority ownership stake. Walmex operates more than 3,800 stores across multiple formats—Bodega Aurrerá (discount stores and the company’s fastest-growing format), Walmart Supercenter (big-box retail), Sam’s Club (membership warehouse), Walmart Express (small supermarkets) and other discount outlets—giving it a uniquely diversified presence across the consumer landscape.
This multi-format approach serves a wide spectrum of customers and shopping occasions—from everyday essentials and large family baskets to convenience and premium purchases. Bodega Aurrerá, for example, has become a household name across Mexico and now represents roughly half of the company’s stores, while Sam’s Club caters to membership customers seeking bulk purchases and higher-ticket items. Together, these formats provide Walmex broad market coverage, geographic reach and strong brand loyalty across urban centers, suburban communities and regional towns.
In recent years, the company has significantly expanded its omnichannel ecosystem, investing in e-commerce, logistics and digital services to enhance convenience and deepen customer engagement. E-commerce is ~8% of total sales, supported by strong growth in online grocery and third-party marketplace offerings. Complementary platforms, such as Cashi (digital payments), BAIT (mobile telecom) and Walmart Connect (digital advertising), extend Walmex’s reach into financial and digital services, strengthening customer ties and building new revenue streams.
High-Quality Business
Some of the quality characteristics we have identified for Walmex include:
- Dominant scale advantages with over 3,000 stores in Mexico, making it the clear market leader in food and general merchandise retail;
- Diversified and resilient revenue base, with a meaningful percentage of sales from grocery—providing recurring traffic and stable cash flow—complemented by general merchandise, fuel, pharmacy and membership-based services;
- Strong returns on invested capital (~18%) supported by consistent execution and capital discipline; and
- Support from Walmart Inc., which provides access to global best practices, digital tools and procurement efficiencies.
Attractive Valuation
We believe Walmex shares are attractively valued relative to its long-term normalized earnings power. In our view, the market underappreciates the company’s ability to grow revenue through ongoing store expansion and strengthen margins and FREE cash flow generation through efficiency gains, scale benefits and continued growth in higher-margin channels, such as private label and e-commerce.
Compelling Catalysts
Catalysts we have identified for Walmex, which we believe will cause its stock price to appreciate over our three- to five-year investment horizon, include:
- Expansion of private label penetration (from mid-teens to mid-20s), which should improve profitability and customer loyalty;
- Further development of the e-commerce platform, with Walmex aiming to become a one-stop shop by combining online grocery and a third-party marketplace, supported by digital tools adapted from Walmart U.S.;
- Disciplined store expansion, with current plans to add approximately 1,500 new stores across Mexico and Central America over the next five years, extending reach and scale advantages; and
- Leadership continuity, as newly appointed interim CEO Cristian Barrientos, a veteran Walmart executive with more than 25 years of experience, provides operational stability and maintains focus on profitable growth during the leadership transition.
Conclusion
A core tenet of our investment philosophy is the commitment to understanding businesses with a long-term perspective. This discipline is especially critical during periods of heightened uncertainty, when macroeconomic events can dominate headlines. At Aristotle Capital, we believe one of the distinguishing strengths of our investment process is that we do not reactively reposition portfolios based on near-term developments. Instead, we maintain our focus on business fundamentals. We are convinced that it is fundamentals that ultimately drive long-term shareholder value. As such, we continue to attentively study what we believe are high quality companies with sustainable competitive advantages poised to unlock value over full market cycles.
The opinions expressed herein are those of Aristotle Capital Management, LLC (Aristotle Capital) and are subject to change without notice. Past performance is not a guarantee or indicator of future results. This material is not financial advice or an offer to buy or sell any product. You should not assume that any of the securities transactions, sectors or holdings discussed in this report were or will be profitable, or that recommendations Aristotle Capital makes in the future will be profitable or equal the performance of the securities listed in this report. The portfolio characteristics shown relate to the Aristotle International Equity ADR strategy. Not every client’s account will have these characteristics. Aristotle Capital reserves the right to modify its current investment strategies and techniques based on changing market dynamics or client needs. There is no assurance that any securities discussed herein will remain in an account’s portfolio at the time you receive this report or that securities sold have not been repurchased. The securities discussed may not represent an account’s entire portfolio and, in the aggregate, may represent only a small percentage of an account’s portfolio holdings. The performance attribution presented is of a representative account from Aristotle Capital’s International Equity ADR Composite. The representative account is a discretionary client account which was chosen to most closely reflect the investment style of the strategy. The criteria used for representative account selection is based on the account’s period of time under management and its similarity of holdings in relation to the strategy. Recommendations made in the last 12 months are available upon request.
Returns are presented gross and net of model fees and include the reinvestment of all income. Gross returns will be reduced by fees and other expenses that may be incurred in the management of the account. Net returns are presented net of model fees. Net returns are calculated by subtracting a model fee of .50% on an annual basis or .04167% on a monthly basis, which includes trading costs and the reinvestment of all income.
All investments carry a certain degree of risk, including the possible loss of principal. Investments are also subject to political, market, currency and regulatory risks or economic developments. International investments involve special risks that may in particular cause a loss in principal, including currency fluctuation, lower liquidity, different accounting methods and economic and political systems, and higher transaction costs. These risks typically are greater in emerging markets. While Large-capitalization companies may have more stable prices than smaller, less established companies, they are still subject to equity securities risk. In addition, large-capitalization equity security prices may not rise as much as prices of equity securities of small-capitalization companies. Securities of small- and medium-sized companies tend to have a shorter history of operations and be more volatile and less liquid. Value stocks can perform differently from the market as a whole and other types of stocks. The material is provided for informational and/or educational purposes only and is not intended to be and should not be construed as investment, legal or tax advice and/or a legal opinion. Investors should consult their financial and tax adviser before making investments. The opinions referenced are as of the date of publication, may be modified due to changes in the market or economic conditions, and may not necessarily come to pass. Information and data presented has been developed internally and/or obtained from sources believed to be reliable. Aristotle Capital does not guarantee the accuracy, adequacy or completeness of such information.
Aristotle Capital Management, LLC is an independent registered investment adviser under the Advisers Act of 1940, as amended. Registration does not imply a certain level of skill or training. More information about Aristotle Capital, including our investment strategies, fees and objectives, can be found in our Form ADV Part 2, which is available upon request. ACM-2510-110
Sources: CAPS CompositeHubTM, MSCI
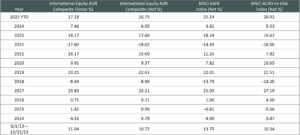
Composite returns for all periods ended September 30, 2025 are preliminary pending final account reconciliation.
Past performance is not indicative of future results. The information provided should not be considered financial advice or a recommendation to purchase or sell any particular security or product. Performance results for periods greater than one year have been annualized. Returns are presented gross and net of model fees and include the reinvestment of all income. Gross returns will be reduced by fees and other expenses that may be incurred in the management of the account. Net returns are presented net of model fees. Net returns are calculated by subtracting a model fee of .50% on an annual basis or .04167% on a monthly basis, which includes trading costs and the reinvestment of all income.
The MSCI EAFE Index (Europe, Australasia, Far East) is a free float-adjusted market capitalization-weighted index that is designed to measure the equity market performance of developed markets, excluding the United States and Canada. The MSCI EAFE Index consists of the following 21 developed market country indexes: Australia, Austria, Belgium, Denmark, Finland, France, Germany, Hong Kong, Ireland, Israel, Italy, Japan, the Netherlands, New Zealand, Norway, Portugal, Singapore, Spain, Sweden, Switzerland and the United Kingdom. The MSCI ACWI captures large and mid-cap representation across 23 developed market countries and 24 emerging markets countries. With approximately 2,500 constituents, the Index covers approximately 85% of the global investable equity opportunity set. The MSCI ACWI Growth Index captures large and mid-cap securities exhibiting overall growth style characteristics across 23 developed markets countries and 24 emerging markets countries. The MSCI ACWI Value Index captures large and mid-cap securities exhibiting overall value style characteristics across 23 developed markets countries and 24 emerging markets countries. The MSCI ACWI ex USA Index captures large and mid-cap representation across 22 of 23 developed markets countries (excluding the United States) and 24 emerging markets countries. With approximately 2,000 constituents, the Index covers approximately 85% of the global equity opportunity set outside the United States. The MSCI Emerging Markets Index is a free float-adjusted market capitalization-weighted index that is designed to measure the equity market performance of emerging markets. The MSCI Emerging Markets Index consists of the following 24 emerging market country indexes: Brazil, Chile, China, Colombia, Czech Republic, Egypt, Greece, Hungary, India, Indonesia, Korea, Kuwait, Malaysia, Mexico, Peru, Philippines, Poland, Qatar, Saudi Arabia, South Africa, Taiwan, Thailand, Turkey and United Arab Emirates. The S&P 500® Index is the Standard & Poor’s Composite Index of 500 stocks and is a widely recognized, unmanaged index of common stock prices. The Brent Crude Oil Index is a major trading classification of sweet light crude oil that serves as a major benchmark price for purchases of oil worldwide. The MSCI Japan Index is designed to measure the performance of the large and mid-cap segments of the Japanese market. With approximately 200 constituents, the Index covers approximately 85% of the free float-adjusted market capitalization in Japan. The Bloomberg Global Aggregate Bond Index is a flagship measure of global investment grade debt from 27 local currency markets. This multi-currency benchmark includes treasury, government-related, corporate and securitized fixed-rate bonds from both developed and emerging markets issuers. The MSCI United Kingdom Index is designed to measure the performance of the large and mid-cap segments of the U.K. market. With nearly 100 constituents, the Index covers approximately 85% of the free float-adjusted market capitalization in the United Kingdom. The MSCI Europe Index captures large and mid-cap representation across 15 developed markets countries in Europe. With approximately 400 constituents, the Index covers approximately 85% of the free float-adjusted market capitalization across the European developed markets equity universe. UK CPI Index is a measurement of inflation and prices, including consumer price inflation, producer price inflation and the House Price Index. These indexes have been selected as the benchmarks and are used for comparison purposes only. The volatility (beta) of the Composite may be greater or less than the respective benchmarks. It is not possible to invest directly in these indexes.