This site has been created for institutional investors and RIAs. An institutional investor is an entity that invests capital on behalf of others such as pension funds, banks, insurance companies, mutual funds, foundations/endowments, trust companies or other large investors and their investment consultants. RIA is a registered investment advisor who is responsible for allocating their client funds. This site is not intended for individual investor access, as it does not consider individual risk tolerances or investment objectives of an individual investor. Click “Accept and Continue” to affirm you meet the description of an Institutional Investor.
This site has been designed for financial intermediaries such as financial advisors, wealth managers, broker/dealers and home office research teams. This site is not intended for individual investor access, as it does not consider individual risk tolerances or investment objectives of an individual investor. Click “Accept and Continue” to affirm you meet the description of a Financial Advisor.
This area of the website contains information that is general and/or educational in nature. Individual investors should consider their own investment objectives and risk tolerances or consult with a financial advisor before making any investment decision. Click “Accept and Continue” to continue.
Aristotle Pacific’s Jeffrey Klingelhofer, CFA, was live on Schwab Network’s “Market on Close” with Marley Kayden. In this segment, he discusses the evolving Fed narrative and shifting rate expectations to what these developments could mean for investors navigating today’s complex market environment.
Jeff Klingelhofer Managing Director, Portfolio Manager
About Aristotle Pacific Aristotle Pacific Capital is a Newport Beach, Calif.-based registered investment adviser that actively invests in credit securities on the basis of fundamental credit analysis with the objective of identifying and realizing relative value. The firm manages credit strategies across floating-rate loans, CLOs, multi-sector, high-yield, investment-grade, and short-duration bonds.
The Latin word cultellus (in Italian, coltello) generally means “smaller knife” or “dagger.” It is a common Latin root for several Italian and French words that, today, refer to small swords. As well, it is the origin of the English word cutlery.
Cultellus became coutelas, a 16th-century French word for a mid-length single-edged blade. A coutelas then became a cutlass, a 17th-century English abbreviated sword. This tool (or weapon, depending upon its use) has a short and more or less curved single-edged blade. The grip is generally of wood, but some specimens show a brass grip with spiral grooves, the fancier ones perhaps adorned with stones. The length of the blade is usually about twenty-four inches.
To read the full article, please use the link below.
(All MSCI index returns are shown net and in U.S. dollars unless otherwise noted.)
Markets Review
Sources: CAPS CompositeHubTM, Bloomberg Past performance is not indicative of future results. Aristotle Global Equity WM Composite returns are presented pure gross and net of maximum wrap fee and include the reinvestment of all income. Pure gross returns do not reflect the deduction of any trading costs or other fees and are supplemental to the net returns. Net returns are calculated by subtracting the highest applicable wrap/SMA fee, which includes trading costs and custodial fees, from the pure gross composite return. The highest applicable wrap/SMA fee is 2.00% on an annual basis, or 0.50% quarterly from inception to 12/31/2023 and 0.17% monthly from 1/1/2024 to present. Aristotle Capital Composite returns are preliminary pending final account reconciliation. Please see important disclosures at the end of this document.
Global equity markets rallied, with the MSCI ACWI Index advancing 11.53% in the second quarter. Concurrently, global fixed income gained ground, as the Bloomberg Global Aggregate Bond Index rose 4.52%. Value stocks significantly lagged growth stocks over the quarter, with the MSCI ACWI Value Index underperfoming the MSCI ACWI Growth Index by 11.42%.
Asia/Pacific ex-Japan and Emerging Markets were the strongest regions, while Europe and Japan, though posting double-digit returns, increased the least. On a sector basis, nine out of the eleven sectors within the MSCI ACWI Index finished higher, with Information Technology, Communication Services and Industrials rising the most. Meanwhile, Energy and Health Care finished with negative returns.
Trade policy remained a focal point. In early April, President Trump introduced a universal 10% import tariff, as well as reciprocal tariffs on dozens of countries, as part of “Liberation Day.” Roughly a week later, and to encourage the start of negotiations, a 90-day pause on reciprocal tariffs was enacted for almost all countries. Later in the quarter, the U.S. and U.K. finalized the Economic Prosperity Deal, which included expanding American access to British markets and lowering tariffs on the first 100,000 of U.K. autos entering the U.S. each year. Meanwhile, negotiations continued with the EU, Japan, Canada and India. After escalating, trade tensions with China eased somewhat; however, considerable tariffs and other trade policy disputes remain for both countries as negotiations continue.
While the full impact of trade policy changes is still uncertain, major economies—including the U.S., U.K., eurozone and Japan—experienced downward revisions to 2025 GDP growth projections. Additionally, inflation trends were notably mixed during the quarter. In the U.S., changes in the Consumer Price Index (CPI) remained stable at approximately 2.4% year-over-year, while annual inflation in the eurozone fell below the European Central Bank’s 2% target. In contrast, the U.K. saw its CPI rise 3.4% year-over-year, with policymakers warning that ongoing geopolitical tensions may continue to drive inflation higher by disrupting oil prices and global supply chains. Japan also experienced elevated inflation, with core CPI rising 3.7% year-over-year—its fastest pace since January of 2023.
Amid a backdrop of macroeconomic uncertainty and mixed economic data, central bank policy decisions generally aligned with expectations. Monetary authorities in the U.S. and Japan held their key interest rates steady, while their counterparts in the U.K. and eurozone implemented rate cuts.
In geopolitics, tensions in the Middle East escalated sharply during the quarter, with Israel and Iran engaging in direct missile exchanges—their most overt confrontation in decades. A succession of precision strikes on key Iranian figures and military sites, as well as U.S. airstrikes on nuclear infrastructure, further fueled fears of a broader regional conflict. However, after 12 days of war, a ceasefire was reached late in the quarter, easing immediate tensions but leaving uncertainty over its durability. In Europe, Russian forces entered eastern Ukraine in the Dnipropetrovsk region for the first time in three years. While the two sides engaged in a second round of negotiations and completed prisoner exchanges, prospects of a material advancement toward a ceasefire remain unclear. Despite the heightened geopolitical events, Brent crude oil fell 9.5% during the quarter.
Performance and Attribution Summary
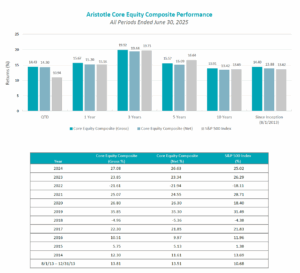
For the second quarter of 2025, Aristotle Capital’s Global Equity WM Composite posted a total return of 9.92% pure gross of fees (9.40% net of fees), underperforming the MSCI ACWI Index, which returned 11.53%, and the MSCI World Index, which returned 11.47%. Please refer to the table below for detailed performance.
Performance (%)
2Q25
YTD
1 Year
3 Years
5 Years
10 Years
Since Inception*
Global Equity WM Composite (pure gross)
9.92
11.41
10.16
13.61
12.14
10.26
10.18
Global Equity WM Composite (net)
9.40
10.33
8.01
11.36
9.92
8.07
8.00
MSCI ACWI Index (net)
11.53
10.06
16.17
17.35
13.66
10.00
9.85
MSCI World Index (net)
11.47
9.48
16.26
18.31
14.55
10.66
10.71
* The inception date for the Global Equity WM Composite is December 1, 2010. Past performance is not indicative of future results. Aristotle Global Equity WM Composite returns are presented pure gross and net of maximum wrap fee and include the reinvestment of all income. Pure gross returns do not reflect the deduction of any trading costs or other fees and are supplemental to the net returns. Net returns are calculated by subtracting the highest applicable wrap/SMA fee, which includes trading costs and custodial fees, from the pure gross composite return. The highest applicable wrap/SMA fee is 2.00% on an annual basis, or 0.50% quarterly from inception to 12/31/2023 and 0.17% monthly from 1/1/2024 to present. Aristotle Capital Composite returns are preliminary pending final account reconciliation. Please see important disclosures at the end of this document.
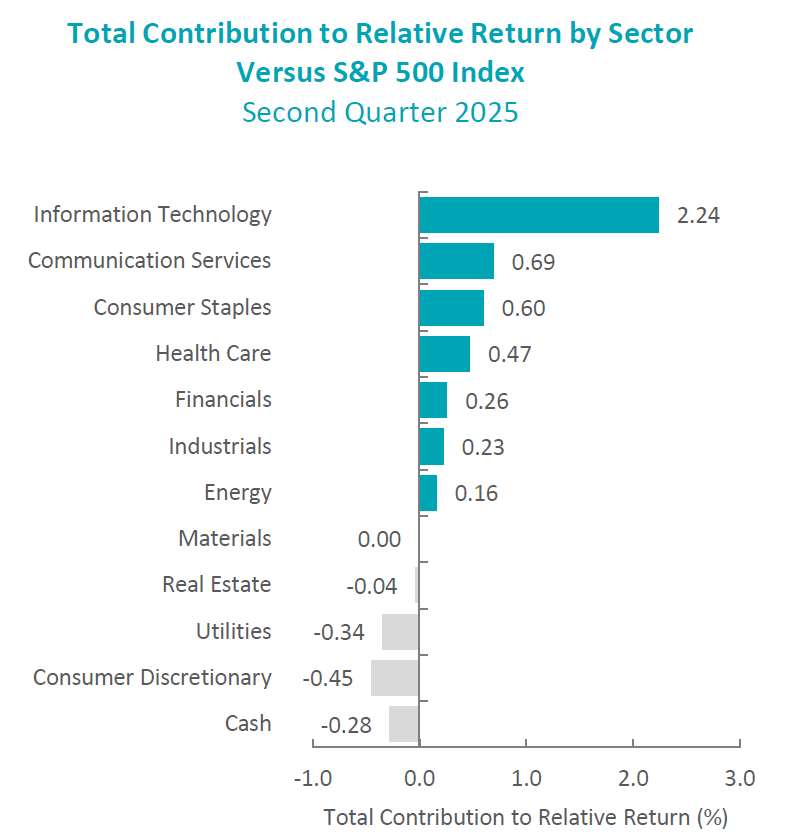
Source: FactSet Past performance is not indicative of future results. Sector attribution shows how much of a portfolio’s overall return is directly attributable to stock selection and asset allocation decisions within the portfolio, highlighting which sectors contributed or detracted to the total return. Attribution includes the reinvestment of income. Attirbution is presented gross of fees and does not include the deduction of all fees and expenses that a client or investor has paid or would have paid. Please refer to the gross and net composite returns included within to understand the overall impact of fees.
From a sector perspective, the portfolio’s underperformance relative to the MSCI ACWI Index can be attributed to allocation effects, while security selection had a positive overall impact. An underweight in Information Technology and security selection in Consumer Discretionary and Industrials detracted the most from the portfolio’s relative performance. Conversely, security selection in Energy and Financials and an overweight in Industrials contributed to relative return.
Regionally, both security selection and allocation effects were responsible for the portfolio’s underperformance relative to the MSCI ACWI Index. Security selection in Europe and Japan detracted the most from relative performance, while security selection in North America and Emerging Markets contributed.
Contributors and Detractors for 2Q 2025
Relative Contributors
Relative Detractors
Cameco
Lennar
Microchip Technology
Amgen
Nemetschek
Jazz Pharmaceuticals
Uber
Alcon
Erste Group Bank
Otsuka Holdings
Amgen, the biopharmaceutical company, was one of the largest detractors for the quarter. While the company’s branded drugs continued to advance (a previously identified catalyst), with cholesterol medicine Repatha, osteoporosis treatment Evenity and bone-strengthening drug Prolia all growing sales in the double digits, concerns surrounding potential tariff impacts, tax reform and pressure on drug prices weighed on shares. We believe it is too early to assess the full impact of these macro uncertainties and are confident in Amgen’s demonstrated ability to adapt through evolving policy and pricing dynamics. The company reaffirmed its long-term commitment to domestic manufacturing and innovation through its upcoming $2 billion expansions in Ohio and North Carolina, building on more than $5 billion in U.S. operational investments since 2017. Furthermore, Amgen continued to advance its robust pipeline, as its 1L bemarituzumab (bema) phase 3 trial for gastric cancer met its primary endpoint, and MariTide, the company’s weight-loss drug, demonstrated strong efficacy in phase 1 and 2 trials. MariTide, which could offer more convenient monthly dosing compared to daily or weekly regimens, showed promising early results, though tolerability will be an important focus heading into phase 3. Management noted that modified dose ramp-up strategies may help mitigate these effects. Despite near-term pressures, we remain encouraged by Amgen’s continued market share gains across key therapies and the potential to enhance the company’s competitiveness and resilience in a dynamic healthcare landscape.
Alcon, a global leader in eye care, was one of the largest detractors during the quarter. Aside from its earnings report, there was little material news, and we did not view anything in the report as affecting the company’s long-term fundamentals. While quarterly updates can influence sentiment, our focus remains on the strength and quality of the business. Alcon operates in a resilient, oligopolistic industry with high barriers to entry and recurring revenue streams tied to its large installed base of cataract surgery systems. It also continues to innovate across product categories, including its premium intraocular lens portfolio (e.g., PanOptix, Vivity), ultra-premium daily contact lenses (e.g., Dailies Total1) and over-the-counter products, such as Systane for dry eyes. Since its spinoff from Novartis in 2019, the company has also demonstrated greater agility in R&D, commercial execution and capital allocation—catalysts we previously identified. More broadly, we believe Alcon’s ability to strengthen its partnerships with eye care professionals and broaden access to underutilized premium technologies makes the company uniquely positioned to benefit from an aging population, increased access to eye care in emerging markets, and rising awareness and diagnosis of chronic dry eye conditions.
Cameco, one of the world’s largest uranium producers, was the biggest contributor during the quarter. The company continued to demonstrate the hallmarks of a high-quality business: a long-duration contract portfolio, disciplined capital allocation and resilience in the face of operational disruption. Despite a nearly 30% decline in uranium spot prices year-over-year, Cameco reported higher average realized prices under its contracted sales—underscoring its pricing power and long-term customer relationships. The company maintained stable operations despite a temporary production pause at the Inkai joint venture and wildfires in northern Saskatchewan. Meanwhile, management continued to deepen its exposure to the nuclear fuel cycle through its Westinghouse unit, which expands its reach into reactor services and fuels. With rising global interest in nuclear energy for energy security and decarbonization, Cameco’s strong balance sheet, vertically integrated platform and ability to flex production volume (thereby controlling costs) remain important catalysts in our eyes.
Microchip Technology, the microcontroller (MCU) and analog semiconductor producer, was a top contributor for the quarter. After several quarters of underperformance driven by prolonged customer destocking, the company’s fundamentals began to improve meaningfully, as returning CEO Steve Sanghi’s turnaround plan is underway. Bookings showed signs of stabilization, supported by more balanced inventories across customers and distribution channels, as well as indications of recovering end-market demand. Operational execution also improved under the renewed leadership, with early benefits emerging from cost-saving initiatives—such as the closure of its Arizona wafer fabrication facility—and tighter inventory management. Microchip’s long-standing customer relationships and commitment to extended product lifecycles continue to support recurring revenue and reduce design-in risk. Combined with its consistent record of strong FREE cash flow generation and shareholder returns, this disciplined approach reinforces our conviction in the company’s ability to manage through industry cycles. Longer term, we believe Microchip remains well-positioned to gain share in 16- and 32-bit MCUs and areas including IoT, 5G infrastructure, autonomous vehicles and data centers.
Recent Portfolio Activity
Buys
Sells
Capital One
PayPal Holdings
Uber
Rational
During the quarter, we sold our positions in PayPal Holdings and Rational and invested in Capital One and Uber.
We first invested in PayPal, the online and mobile e-commerce payments company, in the third quarter of 2015. Over the past decade, we have admired PayPal’s ability to expand its unique and hard-to-replicate dual-sided network, even amid intensifying competition. In 2023, Alex Chriss succeeded Dan Schulman as CEO and refocused the company on profitable growth by enhancing the checkout experience and deepening user engagement, rather than emphasizing top-line expansion. Partnerships with Apple, J.P. Morgan, Amazon and Shopify support this shift, embedding PayPal more deeply across digital commerce ecosystems. Mr. Chriss has also prioritized higher-margin branded checkout while phasing out select Braintree deals that were unprofitable or contributed little to earnings. Braintree primarily serves large enterprise clients—such as Uber, Airbnb and Live Nation—through unbranded, custom-priced processing agreements. While these actions have moderated near-term revenue growth, we view them as a more disciplined and sustainable approach to long-term value creation. That said, we remain concerned about PayPal’s continued investment in its “One Platform” strategy, which includes expanding into offline and omnichannel payments—a direction that has shown limited success to date. While we will continue monitoring Mr. Chriss’s progress and the broader payments landscape, we ultimately determined PayPal was the most suitable candidate for sale in order to fund what we believe is a more compelling investment opportunity.
We first invested in Rational, the German-based global leader in commercial kitchen equipment, in May 2021. The company holds a dominant position in combi-steamers—advanced appliances that integrate steam and convection cooking, allowing professional kitchens to improve consistency, expand menu flexibility, reduce energy use and optimize cooking time in a single unit. During our holding period, Rational made meaningful progress across several catalysts, including deeper penetration of combi-steamers and cooking centers into kitchens still reliant on traditional appliances. The company also expanded its geographic footprint, especially in North America and Asia, where demand for automated and energy-efficient cooking solutions continues to rise. While we continue to view Rational as a high-quality business with attractive long-term prospects, we grew incrementally more cautious about its evolving competitive position. Additionally, Rational’s expansion into adjacent product categories, while strategically logical, introduced added complexity and some potential for product overlap. Given these considerations, we decided Rational was the optimal candidate for sale to fund what we believe is a more compelling investment in Uber.
Capital One Financial Corporation
Founded in 1988 and headquartered in McLean, Virginia, Capital One is one of the largest credit card issuers in the U.S. The company was spun out of Signet Financial in 1995 under the leadership of founder and current Chairman and CEO Richard Fairbank. Over the past three decades, Capital One has evolved from a monoline credit card lender into a diversified financial services firm offering a broad range of consumer and commercial banking products.
In 2025, Capital One completed its acquisition of Discover, becoming one of the only major U.S. banks to own and operate a credit card network. This should position the company to enhance its profitability by reducing its reliance on third-party networks (i.e., Visa and Mastercard) and reduce earnings volatility as fee-based revenue increases. The deal also advances Capital One’s efforts to attract high-spend, premium-tier customers. Products like Venture X—the firm’s premium travel rewards card—stand to benefit from the integration of Discover’s transaction data with Capital One’s advanced analytics capabilities. This combination enables more personalized offers, deeper customer engagement and targeted cross-selling across lending and deposit products, reinforcing a cycle of data-driven growth.
High-Quality Business
Some of the quality characteristics we have identified for Capital One include:
A leading card platform with national brand recognition and a diversified customer base across geographies and credit tiers;
Differentiated technology infrastructure: the only major U.S. bank operating fully in the public cloud, enabling real-time data processing, faster product iteration and cost efficiencies that are difficult for peers to replicate;
A history of prudent underwriting and a disciplined credit culture developed through multiple economic and credit cycles; and
Proven, long-tenured management team led by Richard Fairbank has demonstrated a long-term orientation and disciplined capital deployment across cycles.
Attractive Valuation
We believe shares of Capital One are attractively valued relative to our estimates of normalized earnings power. In our view, the market underappreciates the long-term value creation potential of the Discover integration, including enhanced payment economics and greater strategic control. In addition, Capital One’s ongoing shift toward higher-credit-tier customers and fee-based revenue—combined with its technology-enabled cost advantages—supports margin expansion and more durable earnings. Strong FREE cash flow generation provides ample flexibility to reinvest in growth while continuing to return capital to shareholders through buybacks and dividends.
Compelling Catalysts
Catalysts we have identified for Capital One, which we believe will cause its stock price to appreciate over our three- to five-year investment horizon, include:
Successful integration of Discover’s network, enabling vertical payment processing and greater fee capture;
Continued shift in customer mix toward higher credit tiers, driving more stable earnings and increased fee-based revenue;
Utilization of cloud-based infrastructure and proprietary data to enhance underwriting, deliver personalized product offers and strengthen cross-sell opportunities across lending and deposits; and
Increased market share in cards, driven by brand strength, customer loyalty and expanded co-brand partnerships with leading merchants that enhance customer engagement and distribution.
Uber Technologies, Inc.
Founded in 2009 and headquartered in San Francisco, California, Uber is a global technology platform that facilitates the movement of people, goods and services across a wide range of markets. What began as a simple ride-hailing app has evolved into a multi-segment leader operating in more than 70 countries, connecting millions of consumers, drivers, couriers and merchants worldwide.
Uber’s operations are organized into three primary business segments: Mobility, which includes ridesharing, car rentals and other personal transportation services (~45% of revenue); Delivery, which spans food, grocery, convenience and retail delivery through the Uber Eats platform (~50%); and Freight, its digital brokerage and logistics arm (~5%). These segments are built on a shared platform supported by real-time matching technology, global app penetration, strong network effects and one of the most recognized consumer brands globally—reflected in the familiar phrase, “I’ll call an Uber.”
High-Quality Business
Some of the quality characteristics we have identified for Uber include:
Global scale and platform efficiency, underpinned by strong brand recognition and an asset-light, supply-led model that enables rapid expansion, high operating leverage and efficient capital deployment;
Integrated, cross-segment ecosystem, where offerings like Uber One memberships drive customer activity and loyalty (i.e., the majority of gross delivery bookings come from members); and
Market leadership across core categories, including approximately 70% market share in U.S. ridesharing, a strong #2 position in U.S. delivery, and leading positions in key international delivery markets, such as the U.K., France and Australia.
Attractive Valuation
Uber has scaled to sustainably FREE cash flow with continued progress on margin expansion driven by scale and disciplined cost control. Based on our analysis, shares of the company currently trade at a greater than 10% normalized Cash Flow Return on Economic Value, reflecting what we believe is meaningful upside potential. Uber’s strong balance sheet—with approximately $7 billion in cash—also provides flexibility to reinvest in growth, pursue strategic initiatives or return capital to shareholders.
Compelling Catalysts
Catalysts we have identified for Uber, which we believe will cause its stock price to appreciate over our three- to five-year investment horizon, include:
Increased profitability and stronger FREE cash flow generation as enhanced cross-promotion between Mobility and Delivery deepens user engagement and significantly lowers customer acquisition costs;
Further partnerships—such as with taxi fleets, travel platforms and autonomous vehicle companies—should continue to expand Uber’s reach and reduce supply costs; and
Continued expansion in non-urban markets, with new features like Uber Reserve broadening addressable demand and improving service in suburban areas.
Conclusion
As the world continues to navigate shifting trade dynamics, complex monetary and fiscal policy decisions, and heightened geopolitical uncertainty, the broader implications for the global economy remain unclear. While we are mindful of these macroeconomic forces, we do not attempt to predict their timing or short-term market impact. Instead, we anchor our investment approach in what we believe to be more reliable and enduring: the fundamentals of individual businesses and their long-term potential. By concentrating on high-quality companies with management teams we consider proven, we aim to build portfolios capable of withstanding a wide range of economic environments and delivering attractive returns over full market cycles.
Disclosures
The opinions expressed herein are those of Aristotle Capital Management, LLC (Aristotle Capital) and are subject to change without notice. Past performance is not a guarantee or indicator of future results. This material is not financial advice or an offer to buy or sell any product. You should not assume that any of the securities transactions, sectors or holdings discussed in this report were or will be profitable, or that recommendations Aristotle Capital makes in the future will be profitable or equal the performance of the securities listed in this report. The portfolio characteristics shown relate to the Aristotle Global Equity Advisory strategy. Not every client’s account will have these characteristics. Aristotle Capital reserves the right to modify its current investment strategies and techniques based on changing market dynamics or client needs. There is no assurance that any securities discussed herein will remain in an account’s portfolio at the time you receive this report or that securities sold have not been repurchased. The securities discussed may not represent an account’s entire portfolio and, in the aggregate, may represent only a small percentage of an account’s portfolio holdings. The performance attribution presented is of a representative account from Aristotle Capital’s Global Equity WM Composite. The representative account is a discretionary client account which was chosen to most closely reflect the investment style of the strategy. The criteria used for representative account selection is based on the account’s period of time under management and its similarity of holdings in relation to the strategy. Recommendations made in the last 12 months are available upon request.
Composite returns are presented pure gross and net of the maximum wrap fee and include the reinvestment of all income. Pure gross returns do not reflect the deduction of any trading costs or other fees and are supplemental to the net returns. Net returns are calculated by subtracting the highest applicable wrap/SMA fee, which includes trading costs and custodial fees, from the pure gross composite return. The highest applicable wrap/SMA fee is 2.00% on an annual basis, or 0.50% quarterly from inception to 12/31/2023 and 0.17% monthly from 1/1/2024 to present.
All investments carry a certain degree of risk, including the possible loss of principal. Investments are also subject to political, market, currency and regulatory risks or economic developments. International investments involve special risks that may in particular cause a loss in principal, including currency fluctuation, lower liquidity, different accounting methods and economic and political systems, and higher transaction costs. These risks typically are greater in emerging markets. While Large-capitalization companies may have more stable prices than smaller, less established companies, they are still subject to equity securities risk. In addition, large-capitalization equity security prices may not rise as much as prices of equity securities of small-capitalization companies. Securities of small- and medium-sized companies tend to have a shorter history of operations and be more volatile and less liquid. Value stocks can perform differently from the market as a whole and other types of stocks. The material is provided for informational and/or educational purposes only and is not intended to be and should not be construed as investment, legal or tax advice and/or a legal opinion. Investors should consult their financial and tax adviser before making investments. The opinions referenced are as of the date of publication, may be modified due to changes in the market or economic conditions, and may not necessarily come to pass. Information and data presented has been developed internally and/or obtained from sources believed to be reliable. Aristotle Capital does not guarantee the accuracy, adequacy or completeness of such information.
Aristotle Capital Management, LLC is an independent investment adviser registered under the Investment Advisers Act of 1940, as amended. Registration does not imply a certain level of skill or training. More information about Aristotle Capital, including our investment strategies, fees and objectives, can be found in our Form ADV Part 2, which is available upon request. ACM-2507-81
Performance Disclosures
Sources: CAPS CompositeHubTM, MSCI
Composite returns for all periods ended June 30, 2025 are preliminary pending final account reconciliation.MSCI ACWI (Net) was stated as the primary benchmark on June 1, 2024 and MSCI World (Net) became the secondary benchmark.
The Aristotle Global Equity WM Composite has an inception date of December 1, 2010. As of 1/1/2024, the composite was renamed from the Global Equity Advisory Composite.
Past performance is not indicative of future results. The information provided should not be considered financial advice or a recommendation to purchase or sell any particular security or product. Performance results for periods greater than one year have been annualized.
Composite returns are presented pure gross and net of the maximum wrap fee and include the reinvestment of all income. Pure gross returns do not reflect the deduction of any trading costs or other fees and are supplemental to the net returns. Net returns are calculated by subtracting the highest applicable wrap/SMA fee, which includes trading costs and custodial fees, from the pure gross composite return. The highest applicable wrap/SMA fee is 2.00% on an annual basis, or 0.50% quarterly from inception to 12/31/2023 and 0.17% monthly from 1/1/2024 to present.
Index Disclosures
MSCI ACWI (Net) was stated as the primary benchmark on June 1, 2024 and MSCI World (Net) became the secondary benchmark. The MSCI ACWI captures large and mid-cap representation across 23 developed markets and 24 emerging markets countries. With approximately 2,600 constituents, the Index covers approximately 85% of the global investable equity opportunity set. The MSCI ACWI Equal Weighted Index represents an alternative weighting scheme to its market cap weighted parent index, MSCI ACWI. The Index includes the same constituents as its parent (large and mid-cap securities from 23 developed markets and 24 emerging markets countries. However, at each quarterly rebalance date, all index constituents are weighted equally, effectively removing the influence of each constituent’s current price (high or low). Between rebalances, index constituent weightings will fluctuate due to price performance. The MSCI World Index is a free float-adjusted market capitalization weighted index that is designed to measure the equity market performance of developed markets. The MSCI World Index consists of the following 23 developed market country indexes: Australia, Austria, Belgium, Canada, Denmark, Finland, France, Germany, Hong Kong, Ireland, Israel, Italy, Japan, Netherlands, New Zealand, Norway, Portugal, Singapore, Spain, Sweden, Switzerland, the United Kingdom and the United States. The MSCI Emerging Markets Index is a free float-adjusted market capitalization-weighted index that is designed to measure equity market performance of emerging markets. The MSCI Emerging Markets Index consists of the following 24 emerging market country indexes: Brazil, Chile, China, Colombia, Czech Republic, Egypt, Greece, Hungary, India, Indonesia, Korea, Kuwait, Malaysia, Mexico, Peru, Philippines, Poland, Qatar, Saudi Arabia, South Africa, Taiwan, Thailand, Turkey and United Arab Emirates. The MSCI ACWI Growth Index captures large and mid-cap securities exhibiting overall growth style characteristics across 23 developed markets countries and 24 emerging markets countries. The MSCI ACWI Value Index captures large and mid-cap securities exhibiting overall value style characteristics across 23 developed markets countries and 24 emerging markets countries. The MSCI Europe Index captures large and mid-cap representation across 15 developed markets countries in Europe. With approximately 400 constituents, the Index covers approximately 85% of the free float-adjusted market capitalization across the European developed markets equity universe. The MSCI Japan Index is designed to measure the performance of the large and mid-cap segments of the Japanese market. With approximately 200 constituents, the Index covers approximately 85% of the free float-adjusted market capitalization in Japan. The S&P 500® Index is the Standard & Poor’s Composite Index of 500 stocks and is a widely recognized, unmanaged index of common stock prices. The S&P 500 Equal Weight Index is designed to be the size-neutral version of the S&P 500. It includes the same constituents as the cap-weighted S&P 500, but each company in the S&P 500 Equal Weight Index is allocated the same weight at each quarterly rebalance. The Bloomberg Global Aggregate Bond Index is a flagship measure of global investment grade debt from 27 local currency markets. This multi-currency benchmark includes Treasury, government-related, corporate and securitized fixed rate bonds from both developed and emerging markets issuers. The Brent Crude Oil Index is a major trading classification of sweet light crude oil that serves as a major benchmark price for purchases of oil worldwide. The U.S. Consumer Price Index is a measure of the average change over time in the prices paid by urban consumers for a market basket of consumer goods and services. The U.K. Consumer Price Index is a measure of inflation that is calculated by the Office for National Statistics (ONS). It measures the change in the price of a basket of goods and services consumed by households in the U.K. The Japanese core Consumer Price Index measures changes in the prices paid by consumers for a basket of goods and services, excluding fresh food costs. The volatility (beta) of the Composite may be greater or less than the benchmarks. It is not possible to invest directly in these indexes.
(All MSCI index returns are shown net and in U.S. dollars unless otherwise noted.)
Markets Review
Sources: CAPS CompositeHubTM, Bloomberg Past performance is not indicative of future results. Aristotle International Equity ADR WM Composite returns are presented pure gross and net of the maximum wrap fee and include the reinvestment of all income. Pure gross returns do not reflect the deduction of any trading costs or other fees and are supplemental to the net returns. Net returns are calculated by subtracting the highest applicable wrap/SMA fee, which includes trading costs and custodial fees, from the pure gross composite return. (From inception to 12/31/2015, the highest applicable wrap/SMA fee is 3.00% on an annual basis, or 0.75% quarterly. From 1/1/2016 to 12/31/2023, the highest applicable wrap/SMA fee is 2.00% on an annual basis, or 0.50% quarterly and 0.17% monthly from 1/1/2024 to present.) Aristotle Capital Composite returns are preliminary pending final account reconciliation. Please see important disclosures at the end of this document.
Global equity markets rallied, with the MSCI ACWI Index advancing 11.53% in the second quarter. Global fixed income also performed well, as the Bloomberg Global Aggregate Bond Index returned 4.52%. Value stocks significantly lagged growth over the quarter, with the MSCI ACWI Value Index underperforming the MSCI ACWI Growth Index by 11.42%.
The MSCI EAFE Index rose 11.78% during the second quarter, while the MSCI ACWI ex USA Index climbed 12.03%. Within the MSCI EAFE Index, Europe & Middle East and Asia were the strongest performers, while the U.K. increased the least. On a sector basis, ten out of the eleven sectors within the MSCI EAFE Index posted positive returns, with Communication Services, Information Technology and Industrials generating the largest gains. Conversely, Energy was the only sector to finish in the red, and Health Care and Consumer Discretionary increased the least.
Trade policy remained a focal point. In early April, President Trump introduced a universal 10% import tariff, as well as reciprocal tariffs on dozens of countries, as part of “Liberation Day.” Roughly a week later, and to encourage the start of negotiations, a 90-day pause on reciprocal tariffs was enacted for almost all countries. Later in the quarter, the U.S. and U.K. finalized the Economic Prosperity Deal, which included expanding American access to British markets and lowering tariffs on the first 100,000 of U.K. autos entering the U.S. each year. Meanwhile, negotiations continued with the EU, Japan, Canada and India. After escalating, trade tensions with China eased somewhat; however, considerable tariffs and other trade policy disputes remain for both countries as negotiations continue.
While the full impact of trade policy changes is still uncertain, major economies—including the U.S., U.K., eurozone and Japan— experienced downward revisions to 2025 GDP growth projections. Additionally, inflation trends were notably mixed during the quarter. In the U.S., changes in the Consumer Price Index (CPI) remained stable at approximately 2.4% year-over-year, while annual inflation in the eurozone fell below the European Central Bank’s 2% target. In contrast, the U.K. saw its CPI rise 3.4% year-over-year, with policymakers warning that ongoing geopolitical tensions may continue to drive inflation higher by disrupting oil prices and global supply chains. Japan also experienced elevated inflation, with core CPI rising 3.7% year-over-year—its fastest pace since January of 2023.
Amid a backdrop of macroeconomic uncertainty and mixed economic data, central bank policy decisions generally aligned with expectations. Monetary authorities in the U.S. and Japan held their key interest rates steady, while their counterparts in the U.K. and eurozone implemented rate cuts.
In geopolitics, tensions in the Middle East escalated sharply during the quarter, with Israel and Iran engaging in direct missile exchanges—their most overt confrontation in decades. A succession of precision strikes on key Iranian figures and military sites, as well as U.S. airstrikes on nuclear infrastructure, further fueled fears of a broader regional conflict. However, after 12 days of war, a ceasefire was reached late in the quarter, easing immediate tensions but leaving uncertainty over its durability. In Europe, Russian forces entered eastern Ukraine in the Dnipropetrovsk region for the first time in three years. While the two sides engaged in a second round of negotiations and completed prisoner exchanges, prospects of a material advancement toward a ceasefire remain unclear. Despite the heightened geopolitical events, Brent crude oil fell 9.5% during the quarter.
Performance and Attribution Summary
For the second quarter of 2025, Aristotle Capital’s International Equity ADR WM Composite posted a total return of 10.41% pure gross of fees (9.88% net of fees), underperforming the MSCI EAFE Index, which returned 11.78%, and the MSCI ACWI ex USA Index, which returned 12.03%. Please refer to the table below for detailed performance.
Performance (%)
2Q25
YTD
1 Year
3 Years
5 Years
10 Years
Since Inception*
International Equity ADR WM Composite (pure gross)
10.41
14.90
18.59
15.40
11.82
7.52
8.50
International Equity ADR WM Composite (net)
9.88
13.79
16.29
13.13
9.61
5.39
6.14
MSCI EAFE Index (net)
11.78
19.45
17.73
15.97
11.16
6.51
7.75
MSCI ACWI ex USA Index (net)
12.03
17.89
17.72
13.99
10.13
6.12
6.88
*The inception date for the International Equity ADR WM Composite is 7/1/2012. Past performance is not indicative of future results. Aristotle International Equity ADR WM Composite returns are presented pure gross and net of the maximum wrap fee and include the reinvestment of all income. Pure gross returns do not reflect the deduction of any trading costs or other fees and are supplemental to the net returns. Net returns are calculated by subtracting the highest applicable wrap/SMA fee, which includes trading costs and custodial fees, from the pure gross composite return. (From inception to 12/31/2015, the highest applicable wrap/SMA fee is 3.00% on an annual basis, or 0.75% quarterly. From 1/1/2016 to 12/31/2023, the highest applicable wrap/SMA fee is 2.00% on an annual basis, or 0.50% quarterly and 0.17% monthly from 1/1/2024 to present.) Aristotle Capital Composite returns are preliminary pending final account reconciliation. Please see important disclosures at the end of this document.
Source: FactSet Past performance is not indicative of future results. Sector attribution shows how much of a portfolio’s overall return is directly attributable to stock selection and asset allocation decisions within the portfolio, highlighting which sectors contributed or detracted to the total return. Attribution includes the reinvestment of income. Attribution is presented gross of fees and does not include the deduction of all fees and expenses that a client or investor has paid or would have paid. Please refer to the gross and net composite returns included within to understand the overall impact of fees.
From a sector perspective, the portfolio’s underperformance relative to the MSCI EAFE Index can be primarily attributed to allocation effects. While there were both positive and negative contributions from security selection across sectors, these impacts largely offset one another over the period. Security selection in Industrials, Health Care and Information Technology detracted the most from the portfolio’s relative performance. Conversely, security selection in Energy, Financials and Consumer Discretionary contributed to relative returns.
Regionally, security selection was responsible for the portfolio’s underperformance. Security selection in Europe & Middle East and Asia detracted the most from relative performance, while exposure to Canada and Emerging Markets contributed.
Contributors and Detractors for 2Q 2025
Relative Contributors
Relative Detractors
Cameco
Alcon
Safran
Accenture
Pan Pacific International
Otsuka Holdings
Erste Group Bank
Sony
Credicorp
Kubota
Alcon, a global leader in eye care, was the largest detractor during the quarter. Aside from its earnings report, there was little material news, and we did not view anything in the report as affecting the company’s long-term fundamentals. While quarterly updates can influence sentiment, our focus remains on the strength and quality of the business. Alcon operates in a resilient, oligopolistic industry with high barriers to entry and recurring revenue streams tied to its large installed base of cataract surgery systems. It also continues to innovate across product categories, including its premium intraocular lens portfolio (e.g., PanOptix, Vivity), ultra-premium daily contact lenses (e.g., Dailies Total1) and over-the-counter products, such as Systane for dry eyes. Since its spinoff from Novartis in 2019, the company has also demonstrated greater agility in R&D, commercial execution and capital allocation—catalysts we previously identified. More broadly, we believe Alcon’s ability to strengthen its partnerships with eye care professionals and broaden access to underutilized premium technologies makes the company uniquely positioned to benefit from an aging population, increased access to eye care in emerging markets, and rising awareness and diagnosis of chronic dry eye conditions.
Kubota, the Japanese maker of tractors and construction equipment, was a top detractor during the quarter. Despite rising revenue, results were pressured by a stronger yen, elevated fixed costs, and slowing North American tractor demand. Investor concerns were further heightened by the potential for new U.S. tariffs, which could impact profitability. However, despite these near-term headwinds, we believe the fundamentals remain solid. Kubota continues to expand its footprint in Southeast Asia’s “wet field” rice markets as farming becomes increasingly mechanized, while gaining share in “dry field” agriculture globally through new market entry and a broader product lineup. In North America, the company has also reinforced its leadership in compact machinery, building on established strengths in mini-excavators and track loaders. Its long-standing reputation for quality, reliability, ease of use, and distribution support reinforces our view that Kubota remains well-positioned to benefit from long-term global demand for efficient agricultural and construction solutions.
Cameco, one of the world’s largest uranium producers, was the biggest contributor during the quarter. The company continued to demonstrate the hallmarks of a high-quality business: a long-duration contract portfolio, disciplined capital allocation and resilience in the face of operational disruption. Despite a nearly 30% decline in uranium spot prices year-over-year, Cameco reported higher average realized prices under its contracted sales—underscoring its pricing power and long-term customer relationships. The company maintained stable operations despite a temporary production pause at the Inkai joint venture and wildfires in northern Saskatchewan. Meanwhile, management continued to deepen its exposure to the nuclear fuel cycle through its Westinghouse unit, which expands its reach into reactor services and fuels. With rising global interest in nuclear energy for energy security and decarbonization, Cameco’s strong balance sheet, vertically integrated platform and ability to flex production volume (thereby controlling costs) remain important catalysts in our eyes.
Safran, the French aerospace propulsion and equipment manufacturer, was a top contributor during the quarter. The company continues to demonstrate high-quality characteristics—namely durable aftermarket revenue, strong pricing power and long-standing customer relationships across its propulsion, avionics and interiors franchises. Record 2024 results carried into 2025, supported by strong air traffic recovery, particularly in Asia, and increased aircraft utilization. As the dominant supplier of narrow-body aircraft engines (approximately 70% market share), Safran benefits from rising demand for required maintenance as airlines extend the lives of aging fleets. With roughly one-fifth of its revenues tied to defense, the company also stands to gain from rising European defense budgets, where policymakers are placing increased emphasis on sourcing from regional suppliers. We also continue to view the transition from the legacy CFM56 engine to the more fuel-efficient LEAP platform as a meaningful catalyst—especially given that a large portion of the installed LEAP fleet has yet to reach its first maintenance cycle, providing a long and visible runway (pardon the pun) of profit growth. Looking ahead, we believe Safran remains well-positioned to benefit from global fleet modernization and the industry’s pivot toward more efficient and sustainable aircraft platforms.
Recent Portfolio Activity
Buys
Sells
None
None
Consistent with our long-term horizon and low turnover, there were no new purchases or sales completed during the quarter.
Conclusion
As the world continues to navigate shifting trade dynamics, complex monetary and fiscal policy decisions, and heightened geopolitical uncertainty, the broader implications for the global economy remain unclear. While we are mindful of these macroeconomic forces, we do not attempt to predict their timing or short-term market impact. Instead, we anchor our investment approach in what we believe to be more reliable and enduring: the fundamentals of individual businesses and their long-term potential. By concentrating on high-quality companies with management teams we consider proven, we aim to build portfolios capable of withstanding a wide range of economic environments and delivering attractive returns over full market cycles.
Disclosures
The opinions expressed herein are those of Aristotle Capital Management, LLC (Aristotle Capital) and are subject to change without notice. Past performance is not a guarantee or indicator of future results. This material is not financial advice or an offer to buy or sell any product. You should not assume that any of the securities transactions, sectors or holdings discussed in this report were or will be profitable, or that recommendations Aristotle Capital makes in the future will be profitable or equal the performance of the securities listed in this report. The portfolio characteristics shown relate to the Aristotle International Equity strategy. Not every client’s account will have these characteristics. Aristotle Capital reserves the right to modify its current investment strategies and techniques based on changing market dynamics or client needs. There is no assurance that any securities discussed herein will remain in an account’s portfolio at the time you receive this report or that securities sold have not been repurchased. The securities discussed may not represent an account’s entire portfolio and, in the aggregate, may represent only a small percentage of an account’s portfolio holdings. The performance attribution presented is of a representative account from Aristotle Capital’s International Equity ADR strategy. The representative account is a discretionary client account which was chosen to most closely reflect the investment style of the strategy. The criteria used for representative account selection is based on the account’s period of time under management and its similarity of holdings in relation to the strategy. Recommendations made in the last 12 months are available upon request.
Composite returns are presented pure gross and net of the maximum wrap fee and include the reinvestment of all income. Pure gross returns do not reflect the deduction of any trading costs or other fees and are supplemental to the net returns. Net returns are calculated by subtracting the highest applicable wrap/SMA fee, which includes trading costs and custodial fees, from the pure gross composite return. (From inception to 12/31/2015, the highest applicable wrap/SMA fee is 3.00% on an annual basis, or 0.75% quarterly. From 1/1/2016 to 12/31/2023, the highest applicable wrap/SMA fee is 2.00% on an annual basis, or 0.50% quarterly and 0.17% monthly from 1/1/2024 to present.)
All investments carry a certain degree of risk, including the possible loss of principal. Investments are also subject to political, market, currency and regulatory risks or economic developments. International investments involve special risks that may in particular cause a loss in principal, including currency fluctuation, lower liquidity, different accounting methods and economic and political systems, and higher transaction costs. These risks typically are greater in emerging markets. Securities of small‐ and medium‐sized companies tend to have a shorter history of operations, be more volatile and less liquid. Value stocks can perform differently from the market as a whole and other types of stocks.
The material is provided for informational and/or educational purposes only and is not intended to be and should not be construed as investment, legal or tax advice and/or a legal opinion. Investors should consult their financial and tax adviser before making investments. The opinions referenced are as of the date of publication, may be modified due to changes in the market or economic conditions, and may not necessarily come to pass. Information and data presented has been developed internally and/or obtained from sources believed to be reliable. Aristotle Capital does not guarantee the accuracy, adequacy or completeness of such information.
Aristotle Capital Management, LLC is an independent registered investment adviser under the Advisers Act of 1940, as amended. Registration does not imply a certain level of skill or training. More information about Aristotle Capital, including our investment strategies, fees and objectives, can be found in our Form ADV Part 2, which is available upon request. ACM-2507-102
Performance Disclosures
Sources: CAPS CompositeHubTM, MSCI
Composite returns for all periods ended June 30, 2025 are preliminary pending final account reconciliation.
Past performance is not indicative of future results. The information provided should not be considered financial advice or a recommendation to purchase or sell any particular security or product. Performance results for periods greater than one year have been annualized.
The Aristotle International Equity ADR WM Composite has an inception date of 7/1/2012. As of 1/1/2024, the Composite was renamed from the International Equity ADR Wrap Composite.
Composite returns are presented pure gross and net of the maximum wrap fee and include the reinvestment of all income. Pure gross returns do not reflect the deduction of any trading costs or other fees and are supplemental to the net returns. Net returns are calculated by subtracting the highest applicable wrap/SMA fee, which includes trading costs and custodial fees, from the pure gross composite return. (From inception to 12/31/2015, the highest applicable wrap/SMA fee is 3.00% on an annual basis, or 0.75% quarterly. From 1/1/2016 to 12/31/2023, the highest applicable wrap/SMA fee is 2.00% on an annual basis, or 0.50% quarterly and 0.17% monthly from 1/1/2024 to present.)
Index Disclosures
The MSCI EAFE Index (Europe, Australasia, Far East) is a free float-adjusted market capitalization-weighted index that is designed to measure the equity market performance of developed markets, excluding the United States and Canada. The MSCI EAFE Index consists of the following 21 developed market country indexes: Australia, Austria, Belgium, Denmark, Finland, France, Germany, Hong Kong, Ireland, Israel, Italy, Japan, the Netherlands, New Zealand, Norway, Portugal, Singapore, Spain, Sweden, Switzerland and the United Kingdom. The MSCI ACWI captures large and mid-cap representation across 23 developed market countries and 24 emerging markets countries. With approximately 2,600 constituents, the Index covers approximately 85% of the global investable equity opportunity set. The MSCI ACWI Growth Index captures large and mid-cap securities exhibiting overall growth style characteristics across 23 developed markets countries and 24 emerging markets countries. The MSCI ACWI Value Index captures large and mid-cap securities exhibiting overall value style characteristics across 23 developed markets countries and 24 emerging markets countries. The MSCI ACWI ex USA Index captures large and mid-cap representation across 22 of 23 developed markets countries (excluding the United States) and 24 emerging markets countries. With approximately 2,000 constituents, the Index covers approximately 85% of the global equity opportunity set outside the United States. The MSCI Emerging Markets Index is a free float-adjusted market capitalization-weighted index that is designed to measure the equity market performance of emerging markets. The MSCI Emerging Markets Index consists of the following 24 emerging market country indexes: Brazil, Chile, China, Colombia, Czech Republic, Egypt, Greece, Hungary, India, Indonesia, Korea, Kuwait, Malaysia, Mexico, Peru, Philippines, Poland, Qatar, Saudi Arabia, South Africa, Taiwan, Thailand, Turkey and United Arab Emirates. The S&P 500® Index is the Standard & Poor’s Composite Index of 500 stocks and is a widely recognized, unmanaged index of common stock prices. The Brent Crude Oil Index is a major trading classification of sweet light crude oil that serves as a major benchmark price for purchases of oil worldwide. The MSCI Japan Index is designed to measure the performance of the large and mid-cap segments of the Japanese market. With approximately 200 constituents, the Index covers approximately 85% of the free float-adjusted market capitalization in Japan. The Bloomberg Global Aggregate Bond Index is a flagship measure of global investment grade debt from 27 local currency markets. This multi-currency benchmark includes treasury, government-related, corporate and securitized fixed-rate bonds from both developed and emerging markets issuers. The MSCI United Kingdom Index is designed to measure the performance of the large and mid-cap segments of the U.K. market. With nearly 100 constituents, the Index covers approximately 85% of the free float-adjusted market capitalization in the United Kingdom. The MSCI Europe Index captures large and mid-cap representation across 15 developed markets countries in Europe. With approximately 400 constituents, the Index covers approximately 85% of the free float-adjusted market capitalization across the European developed markets equity universe. These indexes have been selected as the benchmarks and are used for comparison purposes only. The U.S. Consumer Price Index is a measure of the average change over time in the prices paid by urban consumers for a market basket of consumer goods and services. The U.K. Consumer Price Index is a measure of inflation that is calculated by the Office for National Statistics (ONS). It measures the change in the price of a basket of goods and services consumed by households in the U.K. The Japanese core Consumer Price Index measures changes in the prices paid by consumers for a basket of goods and services, excluding fresh food costs. The volatility (beta) of the Composite may be greater or less than the respective benchmarks. It is not possible to invest directly in these indexes.
(All MSCI index returns are shown net and in U.S. dollars unless otherwise noted.)
Markets Review
Sources: CAPS CompositeHubTM, Bloomberg Past performance is not indicative of future results. Aristotle International Equity Composite returns are presented gross and net of investment advisory fees and include the reinvestment of all income. Gross returns will be reduced by fees and other expenses that may be incurred in the management of the account. Net returns are calculated by subtracting a model fee of 0.50% on an annual basis or 0.04167% on a monthly basis, which includes trading costs and the revinvestment of all income. Aristotle Capital Composite returns are preliminary pending final account reconciliation. Please see important disclosures at the end of this document.
Global equity markets rallied, with the MSCI ACWI Index advancing 11.53% in the second quarter. Global fixed income also performed well, as the Bloomberg Global Aggregate Bond Index returned 4.52%. Value stocks significantly lagged growth over the quarter, with the MSCI ACWI Value Index underperforming the MSCI ACWI Growth Index by 11.42%.
The MSCI EAFE Index rose 11.78% during the second quarter, while the MSCI ACWI ex USA Index climbed 12.03%. Within the MSCI EAFE Index, Europe & Middle East and Asia were the strongest performers, while the U.K. increased the least. On a sector basis, ten out of the eleven sectors within the MSCI EAFE Index posted positive returns, with Communication Services, Information Technology and Industrials generating the largest gains. Conversely, Energy was the only sector to finish in the red, and Health Care and Consumer Discretionary increased the least.
Trade policy remained a focal point. In early April, President Trump introduced a universal 10% import tariff, as well as reciprocal tariffs on dozens of countries, as part of “Liberation Day.” Roughly a week later, and to encourage the start of negotiations, a 90-day pause on reciprocal tariffs was enacted for almost all countries. Later in the quarter, the U.S. and U.K. finalized the Economic Prosperity Deal, which included expanding American access to British markets and lowering tariffs on the first 100,000 of U.K. autos entering the U.S. each year. Meanwhile, negotiations continued with the EU, Japan, Canada and India. After escalating, trade tensions with China eased somewhat; however, considerable tariffs and other trade policy disputes remain for both countries as negotiations continue.
While the full impact of trade policy changes is still uncertain, major economies—including the U.S., U.K., eurozone and Japan— experienced downward revisions to 2025 GDP growth projections. Additionally, inflation trends were notably mixed during the quarter. In the U.S., changes in the Consumer Price Index (CPI) remained stable at approximately 2.4% year-over-year, while annual inflation in the eurozone fell below the European Central Bank’s 2% target. In contrast, the U.K. saw its CPI rise 3.4% year-over-year, with policymakers warning that ongoing geopolitical tensions may continue to drive inflation higher by disrupting oil prices and global supply chains. Japan also experienced elevated inflation, with core CPI rising 3.7% year-over-year—its fastest pace since January of 2023.
Amid a backdrop of macroeconomic uncertainty and mixed economic data, central bank policy decisions generally aligned with expectations. Monetary authorities in the U.S. and Japan held their key interest rates steady, while their counterparts in the U.K. and eurozone implemented rate cuts.
In geopolitics, tensions in the Middle East escalated sharply during the quarter, with Israel and Iran engaging in direct missile exchanges—their most overt confrontation in decades. A succession of precision strikes on key Iranian figures and military sites, as well as U.S. airstrikes on nuclear infrastructure, further fueled fears of a broader regional conflict. However, after 12 days of war, a ceasefire was reached late in the quarter, easing immediate tensions but leaving uncertainty over its durability. In Europe, Russian forces entered eastern Ukraine in the Dnipropetrovsk region for the first time in three years. While the two sides engaged in a second round of negotiations and completed prisoner exchanges, prospects of a material advancement toward a ceasefire remain unclear. Despite the heightened geopolitical events, Brent crude oil fell 9.5% during the quarter.
Performance and Attribution Summary
For the second quarter of 2025, Aristotle Capital’s International Equity ADR Composite posted a total return of 10.18% gross of fees (10.05% net of fees), underperforming the MSCI EAFE Index, which returned 11.78%, and the MSCI ACWI ex USA Index, which returned 12.03%. Please refer to the table below for detailed performance.
Performance (%)
2Q25
YTD
1 Years
3 Years
5 Years
10 Years
Since Inception*
International Equity ADR Composite (gross)
10.18
14.64
19.20
15.62
11.93
7.51
7.22
International Equity ADR Composite (net)
10.05
14.36
18.61
15.06
11.38
6.98
6.69
MSCI EAFE Index (net)
11.78
19.45
17.73
15.97
11.16
6.51
6.52
MSCI ACWI ex USA Index (net)
12.03
17.89
17.72
13.99
10.13
6.12
5.90
*The inception date for the International Equity ADR Composite is June 1, 2013. Past performance is not indicative of future results. Aristotle International Equity ADR Composite returns are presented gross and net of model fees and include the reinvestment of all income. Gross returns will be reduced by fees and other expenses that may be incurred in the management of the account. Net returns are presented net of model fees. Net returns are calculated by subtracting a model fee of .50% on an annual basis or .04167% on a monthly basis, which includes trading costs and the reinvestment of all income. Aristotle Capital Composite returns are preliminary pending final account reconciliation. Please see important disclosures at the end of this document.
Source: FactSet Past performance is not indicative of future results. Sector attribution shows how much of a portfolio’s overall return is directly attributable to stock selection and asset allocation decisions within the portfolio, highlighting which sectors contributed or detracted to the total return. Attribution includes the reinvestment of income. Attribution is presented gross of fees and does not include the deduction of all fees and expenses that a client or investor has paid or would have paid. Please refer to the gross and net composite returns included within to understand the overall impact of fees.
From a sector perspective, the portfolio’s underperformance relative to the MSCI EAFE Index can be primarily attributed to allocation effects. While there were both positive and negative contributions from security selection across sectors, these impacts largely offset one another over the period. Security selection in Industrials, Health Care and Information Technology detracted the most from the portfolio’s relative performance. Conversely, security selection in Energy, Financials and Consumer Discretionary contributed to relative returns.
Regionally, security selection was responsible for the portfolio’s underperformance. Security selection in Europe & Middle East and Asia detracted the most from relative performance, while exposure to Canada and Emerging Markets contributed.
Contributors and Detractors for 2Q 2025
Relative Contributors
Relative Detractors
Cameco
Alcon
Safran
Accenture
Pan Pacific International
Otsuka Holdings
Estate Group Bank
Sony
Credicorp
Kubota
Alcon, a global leader in eye care, was the largest detractor during the quarter. Aside from its earnings report, there was little material news, and we did not view anything in the report as affecting the company’s long-term fundamentals. While quarterly updates can influence sentiment, our focus remains on the strength and quality of the business. Alcon operates in a resilient, oligopolistic industry with high barriers to entry and recurring revenue streams tied to its large installed base of cataract surgery systems. It also continues to innovate across product categories, including its premium intraocular lens portfolio (e.g., PanOptix, Vivity), ultra-premium daily contact lenses (e.g., Dailies Total1) and over-the-counter products, such as Systane for dry eyes. Since its spinoff from Novartis in 2019, the company has also demonstrated greater agility in R&D, commercial execution and capital allocation—catalysts we previously identified. More broadly, we believe Alcon’s ability to strengthen its partnerships with eye care professionals and broaden access to underutilized premium technologies makes the company uniquely positioned to benefit from an aging population, increased access to eye care in emerging markets, and rising awareness and diagnosis of chronic dry eye conditions.
Kubota, the Japanese maker of tractors and construction equipment, was a top detractor during the quarter. Despite rising revenue, results were pressured by a stronger yen, elevated fixed costs, and slowing North American tractor demand. Investor concerns were further heightened by the potential for new U.S. tariffs, which could impact profitability. However, despite these near-term headwinds, we believe the fundamentals remain solid. Kubota continues to expand its footprint in Southeast Asia’s “wet field” rice markets as farming becomes increasingly mechanized, while gaining share in “dry field” agriculture globally through new market entry and a broader product lineup. In North America, the company has also reinforced its leadership in compact machinery, building on established strengths in mini-excavators and track loaders. Its long-standing reputation for quality, reliability, ease of use, and distribution support reinforces our view that Kubota remains well-positioned to benefit from long-term global demand for efficient agricultural and construction solutions.
Cameco, one of the world’s largest uranium producers, was the biggest contributor during the quarter. The company continued to demonstrate the hallmarks of a high-quality business: a long-duration contract portfolio, disciplined capital allocation and resilience in the face of operational disruption. Despite a nearly 30% decline in uranium spot prices year-over-year, Cameco reported higher average realized prices under its contracted sales—underscoring its pricing power and long-term customer relationships. The company maintained stable operations despite a temporary production pause at the Inkai joint venture and wildfires in northern Saskatchewan. Meanwhile, management continued to deepen its exposure to the nuclear fuel cycle through its Westinghouse unit, which expands its reach into reactor services and fuels. With rising global interest in nuclear energy for energy security and decarbonization, Cameco’s strong balance sheet, vertically integrated platform and ability to flex production volume (thereby controlling costs) remain important catalysts in our eyes.
Safran, the French aerospace propulsion and equipment manufacturer, was a top contributor during the quarter. The company continues to demonstrate high-quality characteristics—namely durable aftermarket revenue, strong pricing power and long-standing customer relationships across its propulsion, avionics and interiors franchises. Record 2024 results carried into 2025, supported by strong air traffic recovery, particularly in Asia, and increased aircraft utilization. As the dominant supplier of narrow-body aircraft engines (approximately 70% market share), Safran benefits from rising demand for required maintenance as airlines extend the lives of aging fleets. With roughly one-fifth of its revenues tied to defense, the company also stands to gain from rising European defense budgets, where policymakers are placing increased emphasis on sourcing from regional suppliers. We also continue to view the transition from the legacy CFM56 engine to the more fuel-efficient LEAP platform as a meaningful catalyst—especially given that a large portion of the installed LEAP fleet has yet to reach its first maintenance cycle, providing a long and visible runway (pardon the pun) of profit growth. Looking ahead, we believe Safran remains well-positioned to benefit from global fleet modernization and the industry’s pivot toward more efficient and sustainable aircraft platforms.
Recent Portfolio Activity
Buys
Sells
None
None
Consistent with our long-term horizon and low turnover, there were no new purchases or sales completed during the quarter.
Conclusion
As the world continues to navigate shifting trade dynamics, complex monetary and fiscal policy decisions, and heightened geopolitical uncertainty, the broader implications for the global economy remain unclear. While we are mindful of these macroeconomic forces, we do not attempt to predict their timing or short-term market impact. Instead, we anchor our investment approach in what we believe to be more reliable and enduring: the fundamentals of individual businesses and their long-term potential. By concentrating on high-quality companies with management teams we consider proven, we aim to build portfolios capable of withstanding a wide range of economic environments and delivering attractive returns over full market cycles.
Disclosures
The opinions expressed herein are those of Aristotle Capital Management, LLC (Aristotle Capital) and are subject to change without notice. Past performance is not a guarantee or indicator of future results. This material is not financial advice or an offer to buy or sell any product. You should not assume that any of the securities transactions, sectors or holdings discussed in this report were or will be profitable, or that recommendations Aristotle Capital makes in the future will be profitable or equal the performance of the securities listed in this report. The portfolio characteristics shown relate to the Aristotle International Equity strategy. Not every client’s account will have these characteristics. Aristotle Capital reserves the right to modify its current investment strategies and techniques based on changing market dynamics or client needs. There is no assurance that any securities discussed herein will remain in an account’s portfolio at the time you receive this report or that securities sold have not been repurchased. The securities discussed may not represent an account’s entire portfolio and, in the aggregate, may represent only a small percentage of an account’s portfolio holdings. The performance attribution presented is of a representative account from Aristotle Capital’s International Equity Composite. The representative account is a discretionary client account which was chosen to most closely reflect the investment style of the strategy. The criteria used for representative account selection is based on the account’s period of time under management and its similarity of holdings in relation to the strategy. Recommendations made in the last 12 months are available upon request.
Returns are presented gross and net of model fees and include the reinvestment of all income. Gross returns will be reduced by fees and other expenses that may be incurred in the management of the account. Net returns are presented net of model fees. Net returns are calculated by subtracting a model fee of .50% on an annual basis or .04167% on a monthly basis, which includes trading costs and the reinvestment of all income.
All investments carry a certain degree of risk, including the possible loss of principal. Investments are also subject to political, market, currency and regulatory risks or economic developments. International investments involve special risks that may in particular cause a loss in principal, including currency fluctuation, lower liquidity, different accounting methods and economic and political systems, and higher transaction costs. These risks typically are greater in emerging markets. Securities of small‐ and medium‐sized companies tend to have a shorter history of operations, be more volatile and less liquid. Value stocks can perform differently from the market as a whole and other types of stocks.
The material is provided for informational and/or educational purposes only and is not intended to be and should not be construed as investment, legal or tax advice and/or a legal opinion. Investors should consult their financial and tax adviser before making investments. The opinions referenced are as of the date of publication, may be modified due to changes in the market or economic conditions, and may not necessarily come to pass. Information and data presented has been developed internally and/or obtained from sources believed to be reliable. Aristotle Capital does not guarantee the accuracy, adequacy or completeness of such information.
Aristotle Capital Management, LLC is an independent registered investment adviser under the Advisers Act of 1940, as amended. Registration does not imply a certain level of skill or training. More information about Aristotle Capital, including our investment strategies, fees and objectives, can be found in our Form ADV Part 2, which is available upon request. ACM-2507-89
Performance Disclosures
Composite returns for all periods ended June 30, 2025 are preliminary pending final account reconciliation.
Past performance is not indicative of future results. The information provided should not be considered financial advice or a recommendation to purchase or sell any particular security or product. Performance results for periods greater than one year have been annualized. Returns are presented gross and net of model fees and include the reinvestment of all income. Gross returns will be reduced by fees and other expenses that may be incurred in the management of the account. Net returns are presented net of model fees. Net returns are calculated by subtracting a model fee of .50% on an annual basis or .04167% on a monthly basis, which includes trading costs and the reinvestment of all income.
Index Disclosures
The MSCI EAFE Index (Europe, Australasia, Far East) is a free float-adjusted market capitalization-weighted index that is designed to measure the equity market performance of developed markets, excluding the United States and Canada. The MSCI EAFE Index consists of the following 21 developed market country indexes: Australia, Austria, Belgium, Denmark, Finland, France, Germany, Hong Kong, Ireland, Israel, Italy, Japan, the Netherlands, New Zealand, Norway, Portugal, Singapore, Spain, Sweden, Switzerland and the United Kingdom. The MSCI ACWI captures large and mid-cap representation across 23 developed market countries and 24 emerging markets countries. With approximately 2,600 constituents, the Index covers approximately 85% of the global investable equity opportunity set. The MSCI ACWI Growth Index captures large and mid-cap securities exhibiting overall growth style characteristics across 23 developed markets countries and 24 emerging markets countries. The MSCI ACWI Value Index captures large and mid-cap securities exhibiting overall value style characteristics across 23 developed markets countries and 24 emerging markets countries. The MSCI ACWI ex USA Index captures large and mid-cap representation across 22 of 23 developed markets countries (excluding the United States) and 24 emerging markets countries. With approximately 2,000 constituents, the Index covers approximately 85% of the global equity opportunity set outside the United States. The MSCI Emerging Markets Index is a free float-adjusted market capitalization-weighted index that is designed to measure the equity market performance of emerging markets. The MSCI Emerging Markets Index consists of the following 24 emerging market country indexes: Brazil, Chile, China, Colombia, Czech Republic, Egypt, Greece, Hungary, India, Indonesia, Korea, Kuwait, Malaysia, Mexico, Peru, Philippines, Poland, Qatar, Saudi Arabia, South Africa, Taiwan, Thailand, Turkey and United Arab Emirates. The S&P 500® Index is the Standard & Poor’s Composite Index of 500 stocks and is a widely recognized, unmanaged index of common stock prices. The Brent Crude Oil Index is a major trading classification of sweet light crude oil that serves as a major benchmark price for purchases of oil worldwide. The MSCI Japan Index is designed to measure the performance of the large and mid-cap segments of the Japanese market. With approximately 200 constituents, the Index covers approximately 85% of the free float-adjusted market capitalization in Japan. The Bloomberg Global Aggregate Bond Index is a flagship measure of global investment grade debt from 27 local currency markets. This multi-currency benchmark includes treasury, government-related, corporate and securitized fixed-rate bonds from both developed and emerging markets issuers. The MSCI United Kingdom Index is designed to measure the performance of the large and mid-cap segments of the U.K. market. With nearly 100 constituents, the Index covers approximately 85% of the free float-adjusted market capitalization in the United Kingdom. The MSCI Europe Index captures large and mid-cap representation across 15 developed markets countries in Europe. With approximately 400 constituents, the Index covers approximately 85% of the free float-adjusted market capitalization across the European developed markets equity universe. These indexes have been selected as the benchmarks and are used for comparison purposes only. The U.S. Consumer Price Index is a measure of the average change over time in the prices paid by urban consumers for a market basket of consumer goods and services. The U.K. Consumer Price Index is a measure of inflation that is calculated by the Office for National Statistics (ONS). It measures the change in the price of a basket of goods and services consumed by households in the U.K. The Japanese core Consumer Price Index measures changes in the prices paid by consumers for a basket of goods and services, excluding fresh food costs. The volatility (beta) of the Composite may be greater or less than the respective benchmarks. It is not possible to invest directly in these indexes.
Despite some early volatility in the second quarter, the U.S. equity market rebounded with strength, with the S&P 500 Index rising 10.94% during the period. Bonds also delivered positive returns, as the Bloomberg U.S. Aggregate Bond Index rose 1.21%.
Sources: CAPS CompositeHubTM, Bloomberg
Past performance is not indicative of future results. Aristotle Atlantic Focus Growth Composite returns are presented gross and net of investment advisory fees and include the reinvestment of all income. Gross returns will be reduced by fees and other expenses that may be incurred in the management of the account. Net returns are presented net of actual investment advisory fees and after the deduction of all trading expenses. Aristotle Atlantic Composite returns are preliminary pending final account reconciliation. Please see important disclosures at the end of this document
On a sector basis, positive returns were led by nine of the eleven sectors within the Russell 1000 Growth Index in the second quarter of 2025. The strongest sectors were Utilities and Information Technology. The weakest sectors were Energy and Health Care.
Trade policy remained a focal point. In early April, President Trump introduced a universal 10% import tariff, as well as reciprocal tariffs on dozens of countries, as part of “Liberation Day.” Roughly a week later, and to encourage the start of negotiations, a 90-day pause on reciprocal tariffs was enacted for almost all countries. Later in the quarter, the U.S. and U.K. finalized the Economic Prosperity Deal, which included expanding American access to British markets and lowering tariffs on the first 100,000 of U.K. autos entering the U.S. each year. Meanwhile, negotiations continued with the EU, Japan, Canada and India. After escalating, trade tensions with China eased somewhat; however, considerable tariffs and other trade policy disputes remain for both countries as negotiations continue. Shortly after quarter end, Congress also passed the Trump administration’s sweeping fiscal legislation, which included major tax incentives, infrastructure funding and manufacturing subsidies. Concurrently, the U.S. Dollar Index (DXY) fell 10.7% in the first six months of the year—the fastest decline since 1973.
Economic data released during the quarter painted a mixed picture. U.S. real GDP for the first quarter contracted at an annual rate of 0.5%, primarily due to reduced government spending and a rise in imports. Meanwhile, the Consumer Price Index (CPI) rose 2.4% year-over-year in May, and the unemployment rate remained close to 4%. Notably, a key gauge of consumer confidence rebounded in June, increasing for the first time in six months. However, given the ongoing uncertainty around the macroeconomic outlook, the Federal Reserve opted to hold its policy rate steady at a range of 4.25% to 4.50%, signaling a cautious, data-dependent stance.
Corporate fundamentals continued to serve as a relative bright spot, as S&P 500 companies reported 12.9% year-over-year earnings growth, with 78% of companies exceeding EPS expectations. Still, concerns around global trade and input costs were evident, with more than 425 companies referencing tariffs in earnings calls and nearly 12% issuing negative EPS guidance for the quarter ahead. Management teams broadly emphasized cost discipline and capital flexibility in the face of persistent macro headwinds.
In geopolitics, tensions in the Middle East escalated sharply during the quarter, with Israel and Iran engaging in direct missile exchanges—their most overt confrontation in decades. A succession of precision strikes on key Iranian figures and military sites, as well as U.S. airstrikes on nuclear infrastructure, further fueled fears of a broader regional conflict. However, after 12 days of war, a ceasefire was reached late in the quarter, easing immediate tensions but leaving uncertainty over its durability. In Europe, Russian forces entered eastern Ukraine in the Dnipropetrovsk region for the first time in three years. While the two sides engaged in a second round of negotiations and completed prisoner exchanges, prospects of a material advancement toward a ceasefire remain unclear. Despite the heightened geopolitical risks, WTI crude oil fell 8.9% during the quarter.
Performance and Attribution Summary
For the second quarter of 2025, Aristotle Atlantic’s Focus Growth Composite posted a total return of 17.70% gross of fees (17.67% net of fees), underperforming the 17.84% total return of the Russell 1000 Growth Index.
Performance (%)
2Q25
1 Year
3 Years
5 Years
Since Inception*
Focus Growth Composite (gross)
17.70
16.39
23.12
13.59
14.97
Focus Growth Composite (net)
17.67
16.28
23.01
13.49
14.74
Russell 1000 Growth Index
17.84
17.22
25.76
18.15
17.47
*The Focus Growth Composite has an inception date of March 1, 2018. Past performance is not indicative of future results. Aristotle Atlantic Focus Growth Composite returns are presented gross and net of investment advisory fees and include the reinvestment of all income. Gross returns will be reduced by fees and other expenses that may be incurred in the management of the account. Net returns are presented net of actual investment advisory fees and after the deduction of all trading expenses. Aristotle Atlantic Composite returns are preliminary pending final account reconciliation. Please see important disclosures at the end of this document.
Sources: FactSet Past performance is not indicative of future results. Sector attribution shows how much of a portfolio’s overall return is directly attributable to stock selection and asset allocation decisions within the portfolio, highlighting which sectors contributed or detracted to the total return. Attribution includes the reinvestment of income. Attribution is presented gross of fees and does not include the deduction of all fees and expenses that a client or investor has paid or would have paid. Please refer to the gross and net composite returns included within to understand the overall impact of fees. Please see important disclosures at the end of this document.
During the second quarter, the portfolio’s underperformance relative to the Russell 1000 Growth Index was due to allocation effects. Security selection in Consumer Discretionary and Financials detracted the most from relative returns. Conversely, security selection in Information Technology and Industrials contributed the most.
Contributors and Detractors for 2Q 2025
Relative Contributors
Relative Detractors
Adaptive Biotechnologies
UnitedHealth Group
Netflix
Visa
Trane Technologies
Bio-Techne
Broadcom
S&P Global
Crowdstrike Holdings
Costco Wholesale
Detractors
UnitedHealth Group
UnitedHealth Group detracted from relative performance in the second quarter following a surprisingly soft first quarter earnings report and a sizable guidance reduction. The issues were two-fold, including higher utilization inside its group Medicare Advantage offering, which drove a higher medical care ratio. The second issue was a negative new member mix, as several competitors exited the market, and many of the patients who switched to UnitedHealth’s offerings had not been actively engaged in their care, resulting in higher acuity levels throughout the quarter. The company believes both issues are fixable in its next rate cycle.
Visa
Visa detracted from relative performance in the second quarter due to growing concerns that stablecoins could pose a long-term threat to the company’s payments business. While consumer adoption of stablecoins remains limited at present, pending U.S. legislation viewed as favorable to the cryptocurrency ecosystem, along with interest from large merchants exploring the issuance of proprietary stablecoins, has highlighted potential disruption risks to parts of Visa’s core network.
Contributors
Adaptive Biotechnologies
Adaptive Biotechnologies contributed to relative performance in the second quarter following a better-than-expected first quarter earnings report, which showed solid across-the-board momentum in both clinical testing and biopharma testing volumes. Adaptive continues to make progress on growing average selling prices (ASPs) and reducing cash burn. Adaptive is also rolling out its test on electronic medical record platforms, which will simplify the workflow and increase test ordering, processing and reporting efficiency.
Netflix
Netflix contributed to relative performance in the second quarter, primarily due to first quarter earnings results that supported investor confidence in continued growth. In particular, additional price increases in select markets, healthy subscriber momentum and progress in the nascent ad-supported subscription tier also helped drive performance. The company reiterated its full-year targets, with no signs of weakness in domestic or international markets.
Recent Portfolio Activity
The table below shows all buys and sells completed during the quarter, followed by a brief rationale.
Buys
Sells
HubSpot
Expedia Group
Buys
HubSpot
HubSpot provides a cloud-based customer relationship management (CRM) platform that integrates marketing, sales, service, content management and operations hubs into a unified system. Its platform features applications and tools for tasks such as website creation, business blogging, search engine optimization, web analytics, lead generation and more, while also offering a native payment solution. Designed to create adaptable and cohesive customer experiences, HubSpot’s Smart CRM and engagement hubs facilitate unified customer profiles and seamless interaction across the customer lifecycle. The hubs, available in free and paid tiers, can function independently, integrate with HubSpot’s Smart platform or third-party CRMs, and scale alongside growing businesses.
We invested in HubSpot for its strategic positioning in a large, underserved SMB market, its effective freemium-to-enterprise conversion funnel and its rapidly growing AI suite “Breeze,” which enhances automation and personalization across customer interactions. With strong adoption across product tiers, momentum in enterprise expansion, and scalable financials driving margin expansion and free cash flow growth, we believe the company is well-positioned to deliver durable, long-term value. We believe the current valuation is fair based on the combination of durable revenue growth, expanding margins and the early signs of traction in AI monetization.
Sells
Expedia Group
We sold Expedia Group due to a higher risk of a recession following the significant increase in global tariffs, which can be expected to reduce overall levels of economic activity. In addition, the negative impact on the wealth effect due to potentially declining equity markets will likely impact demand for retail travel. Travel is among the most discretionary spend categories within the consumer discretionary sector.
Outlook
The equity markets in the second quarter rose sharply on hopes of a reasonable resolution to tariffs and a resilient economy. Interest rates were largely unchanged for the quarter, with the 10-year Treasury yield at 4.2%. With the looming tariff deadline of July 9th, the markets reacted positively to reported progress. The July 4th deadline for Congress to pass the extension to tax cuts also seems to be progressing. The economic data was mostly in line with expectations, with employment steady and inflation data just above the Fed’s 2% target. With the strong rebound in equity markets, valuation levels are once again above historical averages. Our focus will continue to be at the company level, with an emphasis on seeking to invest in companies with secular tailwinds or strong product-driven cycles.
Disclosures
The opinions expressed herein are those of Aristotle Atlantic Partners, LLC (Aristotle Atlantic) and are subject to change without notice. Past performance is not a guarantee or indicator of future results. This material is not financial advice or an offer to purchase or sell any product. You should not assume that any of the securities transactions, sectors or holdings discussed in this report were or will be profitable, or that recommendations Aristotle Atlantic makes in the future will be profitable or equal the performance of the listed in this report. The portfolio characteristics shown relate to the Aristotle Atlantic Focus Growth strategy. Not every client’s account will have these characteristics. Aristotle Atlantic reserves the right to modify its current investment strategies and techniques based on changing market dynamics or client needs. There is no assurance that any securities discussed herein will remain in an account’s portfolio at the time you receive this report or that securities sold have not been repurchased. The securities discussed may not represent an account’s entire portfolio and, in the aggregate, may represent only a small percentage of an account’s portfolio holdings. The performance attribution presented is of a representative account from Aristotle Atlantic’s Focus Growth Composite. The representative account is a discretionary client account which was chosen to most closely reflect the investment style of the strategy. The criteria used for representative account selection is based on the account’s period of time under management and its similarity of holdings in relation to the strategy. Recommendations made in the last 12 months are available upon request. Returns are presented gross and net of investment advisory fees and include the reinvestment of all income. Gross returns will be reduced by fees and other expenses that may be incurred in the management of the account. Net returns are presented net of actual investment advisory fees and after the deduction of all trading expenses.
All investments carry a certain degree of risk, including the possible loss of principal. Investments are also subject to political, market, currency and regulatory risks or economic developments. International investments involve special risks that may in particular cause a loss in principal, including currency fluctuation, lower liquidity, different accounting methods and economic and political systems, and higher transaction costs. These risks typically are greater in emerging markets. While Large-capitalization companies may have more stable prices than smaller, less established companies, they are still subject to equity securities risk. In addition, large-capitalization equity security prices may not rise as much as prices of equity securities of small-capitalization companies. Securities of small- and medium-sized companies tend to have a shorter history of operations, be more volatile and less liquid. Value stocks can perform differently from the market as a whole and other types of stocks. The material is provided for informational and/or educational purposes only and is not intended to be and should not be construed as investment, legal or tax advice and/or a legal opinion. Investors should consult their financial and tax adviser before making investments. The opinions referenced are as of the date of publication, may be modified due to changes in the market or economic conditions, and may not necessarily come to pass. Information and data presented has been developed internally and/or obtained from sources believed to be reliable. Aristotle Capital does not guarantee the accuracy, adequacy or completeness of such information.
Aristotle Atlantic Partners, LLC is an independent registered investment adviser under the Advisers Act of 1940, as amended. Registration does not imply a certain level of skill or training. More information about Aristotle Atlantic, including our investment strategies, fees and objectives, can be found in our Form ADV Part 2, which is available upon request. AAP-2507-16
Performance Disclosures
Sources: CAPS CompositeHubTM
Composite returns for all periods ended June 30, 2025 are preliminary pending final account reconciliation.
Past performance is not indicative of future results. Performance results for periods greater than one year have been annualized. Returns are presented gross and net of investment advisory fees and include the reinvestment of all income. Gross returns will be reduced by fees and other expenses that may be incurred in the management of the account. Net returns are presented net of actual investment advisory fees and after the deduction of all trading expenses.
Index Disclosures
The Russell 1000® Growth Index measures the performance of the large cap growth segment of the U.S. equity universe. It includes those Russell 1000 companies with higher price-to-book ratios and higher forecasted growth values. This index has been selected as the benchmark and is used for comparison purposes only. The Russell 1000® Value Index measures the performance of the large cap value segment of the U.S. equity universe. It includes those Russell 1000 companies with lower price-to-book ratios and lower expected growth values. The S&P 500® Index is the Standard & Poor’s Composite Index of 500 stocks and is a widely recognized, unmanaged index of common stock prices. The Russell 2000® Index measures the performance of the small cap segment of the U.S. equity universe. The Russell 2000 Index is a subset of the Russell 3000® Index representing approximately 10% of the total market capitalization of that index. It includes approximately 2,000 of the smallest securities based on a combination of their market cap and current index membership. The Dow Jones Industrial Average® is a price-weighted measure of 30 U.S. blue-chip companies. The Index covers all industries except transportation and utilities. The NASDAQ Composite Index measures all NASDAQ domestic and international based common type stocks listed on The NASDAQ Stock Market. The NASDAQ Composite includes over 3,000 companies, more than most other stock market indices. The Bloomberg U.S. Aggregate Bond Index is an unmanaged index of domestic investment grade bonds, including corporate, government and mortgage-backed securities. The WTI Crude Oil Index is a major trading classification of sweet light crude oil that serves as a major benchmark price for oil consumed in the United States. The 3-Month U.S. Treasury Bill is a short-term debt obligation backed by the U.S. Treasury Department with a maturity of three months. The U.S. Dollar Index (DXY) is a measure of the value of the U.S. dollar relative to the value of a basket of currencies of the majority of the United States’ most significant trading partners. The Consumer Price Index (CPI) is a measure of the average change over time in the prices paid by urban consumers for a market basket of consumer goods and services. While stock selection is not governed by quantitative rules, a stock typically is added only if the company has an excellent reputation, demonstrates sustained growth and is of interest to a large number of investors. The volatility (beta) of the Composite may be greater or less than its respective benchmarks. It is not possible to invest directly in these indices.
Despite some early volatility in the second quarter, the U.S. equity market rebounded with strength, with the S&P 500 Index rising 10.94% during the period. Bonds also delivered positive returns, as the Bloomberg U.S. Aggregate Bond Index rose 1.21%.
On a sector basis, positive performance was led by eight of the eleven sectors within the S&P 500 Index in the second quarter of 2025. The best-performing sectors were Information Technology and Communication Services. The weakest sectors were Energy and Health Care.
Sources: CAPS CompositeHubTM, Bloomberg Past performance is not indicative of future results. Aristotle Atlantic Core Equity Composite returns are presented gross and net of investment advisory fees and include the reinvestment of all income. Gross returns will be reduced by fees and other expenses that may be incurred in the management of the account. Net returns are presented net of actual investment advisory fees and after the deduction of all trading expenses. Aristotle Atlantic Composite returns are preliminary pending final account reconciliation. Please see important disclosures at the end of this document.
Trade policy remained a focal point. In early April, President Trump introduced a universal 10% import tariff, as well as reciprocal tariffs on dozens of countries, as part of “Liberation Day.” Roughly a week later, and to encourage the start of negotiations, a 90-day pause on reciprocal tariffs was enacted for almost all countries. Later in the quarter, the U.S. and U.K. finalized the Economic Prosperity Deal, which included expanding American access to British markets and lowering tariffs on the first 100,000 of U.K. autos entering the U.S. each year. Meanwhile, negotiations continued with the EU, Japan, Canada and India. After escalating, trade tensions with China eased somewhat; however, considerable tariffs and other trade policy disputes remain for both countries as negotiations continue. Shortly after quarter end, Congress also passed the Trump administration’s sweeping fiscal legislation, which included major tax incentives, infrastructure funding and manufacturing subsidies. Concurrently, the U.S. Dollar Index (DXY) fell 10.7% in the first six months of the year—the fastest decline since 1973.
Economic data released during the quarter painted a mixed picture. U.S. real GDP for the first quarter contracted at an annual rate of 0.5%, primarily due to reduced government spending and a rise in imports. Meanwhile, the Consumer Price Index (CPI) rose 2.4% year-over-year in May, and the unemployment rate remained close to 4%. Notably, a key gauge of consumer confidence rebounded in June, increasing for the first time in six months. However, given the ongoing uncertainty around the macroeconomic outlook, the Federal Reserve opted to hold its policy rate steady at a range of 4.25% to 4.50%, signaling a cautious, data-dependent stance.
Corporate fundamentals continued to serve as a relative bright spot, as S&P 500 companies reported 12.9% year-over-year earnings growth, with 78% of companies exceeding EPS expectations. Still, concerns around global trade and input costs were evident, with more than 425 companies referencing tariffs in earnings calls and nearly 12% issuing negative EPS guidance for the quarter ahead. Management teams broadly emphasized cost discipline and capital flexibility in the face of persistent macro headwinds.
In geopolitics, tensions in the Middle East escalated sharply during the quarter, with Israel and Iran engaging in direct missile exchanges—their most overt confrontation in decades. A succession of precision strikes on key Iranian figures and military sites, as well as U.S. airstrikes on nuclear infrastructure, further fueled fears of a broader regional conflict. However, after 12 days of war, a ceasefire was reached late in the quarter, easing immediate tensions but leaving uncertainty over its durability. In Europe, Russian forces entered eastern Ukraine in the Dnipropetrovsk region for the first time in three years. While the two sides engaged in a second round of negotiations and completed prisoner exchanges, prospects of a material advancement toward a ceasefire remain unclear. Despite the heightened geopolitical risks, WTI crude oil fell 8.9% during the quarter.
Performance and Attribution Summary
For the second quarter of 2025, Aristotle Atlantic’s Core Equity Composite posted a total return of 14.43% gross of fees (14.30% net of fees), outperforming the S&P 500 Index, which recorded a total return of 10.94%.
Performance (%)
2Q25
1 Year
3 Years
5 Years
10 Years
Since Inception*
Core Equity Composite (gross)
14.43
15.67
19.92
15.57
13.91
14.40
Core Equity Composite (net)
14.30
15.20
19.44
15.09
13.42
13.88
S&P 500 Index
10.94
15.16
19.71
16.64
13.65
13.62
*The Core Equity Composite has an inception date of August 1, 2013. Past performance is not indicative of future results. Aristotle Atlantic Core Equity Composite returns are presented gross and net of investment advisory fees and include the reinvestment of all income. Gross returns will be reduced by fees and other expenses that may be incurred in the management of the account. Net returns are presented net of actual investment advisory fees and after the deduction of all trading expenses. Aristotle Atlantic Composite returns are preliminary pending final account reconciliation. Please see important disclosures at the end of this document.
Source: FactSet Past performance is not indicative of future results. Sector attribution shows how much of a portfolio’s overall return is directly attributable to stock selection and asset allocation decisions within the portfolio, highlighting which sectors contributed or detracted to the total return. Attribution includes the reinvestment of income. Attribution is presented gross of fees and does not include the deduction of all fees and expenses that a client or investor has paid or would have paid. Please refer to the gross and net composite returns included within to understand the overall impact of fees. Please see important disclosures at the end of this document.
During the second quarter, the portfolio’s outperformance relative to the S&P 500 Index was due to security selection. Security selection in Information Technology and Health Care contributed the most to relative performance; conversely, security selection in Consumer Discretionary and Utilities detracted from relative performance.
Contributors and Detractors for 2Q 2025
Relative Contributors
Relative Detractors
Oracle
Becton, Dickinson and Company
Broadcom
Chubb
Trade Technologies
Halliburton
Adaptive Biotechnologies
Bio-Techne
Apple
American Water Works
Contributors
Oracle
Oracle contributed to performance in the second quarter, as the company reported strong quarterly results that highlighted continued strong demand for the company’s OCI infrastructure, sustained growth in the company’s SaaS apps business, and accelerating growth trends in the cloud database segment. Management highlighted RPO growth of over 100%, which speaks to continuing demand for Oracle’s infrastructure and software products over a multi-year period.
Broadcom
Broadcom contributed to performance in the second quarter, as the company reported strong quarterly results for its AI compute and networking business, as well as its VMware segment. The company also provided positive commentary on the setup for the AI-related silicon business units for the rest of 2025, and also for 2026, as strong customer demand for AI silicon for training and inference continues.
Detractors
Becton, Dickinson and Company
Becton Dickinson detracted from relative performance in the second quarter following a worse-than-expected fiscal quarter earnings report in which the company felt the impact of cuts to the National Institutes of Health (NIH) budget and uncertainty around future cuts. Furthermore, forward earnings and revenue guidance were reduced to reflect the continued weakness in funding for biosciences R&D and the expected impact of tariffs.
Chubb
Chubb detracted from performance in the second quarter, primarily due to a market rotation out of defensive names amid a broader market rally led by technology and other cyclical sectors. The company’s first quarter earnings report showed slowing growth in P&C net written premiums, raising concerns about potentially softening pricing trends in its commercial insurance business following several years of strong performance.
Recent Portfolio Activity
The table below shows all buys and sells completed during the quarter, followed by a brief rationale.
Buys
Sells
Expedia Group
Zoetis
Buys
There were no buys in the second quarter of 2025.
Sells
Expedia Group
We sold Expedia Group due to a higher risk of a recession following the significant increase in global tariffs, which can be expected to reduce overall levels of economic activity. In addition, the negative impact on the wealth effect due to potentially declining equity markets will likely impact demand for retail travel. Travel is among the most discretionary spend categories within the consumer discretionary sector.
Zoetis
We sold Zoetis, as concerns continue to grow about competitive entrants in the dermatology and parasiticides animal health marketplace. While the company has continued to execute well in the face of new entrants, we believe that this will continue to be an overhang on the stock in the near to medium term. Given the premium valuation versus other areas in health care, we believe there is more upside elsewhere and are exiting our position in the stock.
Outlook
The equity markets in the second quarter rose sharply on hopes of a reasonable resolution to tariffs and a resilient economy. Interest rates were largely unchanged for the quarter, with the 10-year Treasury yield at 4.2%. With the looming tariff deadline of July 9th, the markets reacted positively to reported progress. The July 4th deadline for Congress to pass the extension to tax cuts also seems to be progressing. The economic data was mostly in line with expectations, with employment steady and inflation data just above the Fed’s 2% target. With the strong rebound in equity markets, valuation levels are once again above historical averages. Our focus will continue to be at the company level, with an emphasis on seeking to invest in companies with secular tailwinds or strong product-driven cycles.
Disclosures
The opinions expressed herein are those of Aristotle Atlantic Partners, LLC (Aristotle Atlantic) and are subject to change without notice. Past performance is not a guarantee or indicator of future results. This material is not financial advice or an offer to purchase or sell any product. You should not assume that any of the securities transactions, sectors or holdings discussed in this report were or will be profitable, or that recommendations Aristotle Atlantic makes in the future will be profitable or equal the performance of the securities listed in this report. The portfolio characteristics shown relate to the Aristotle Atlantic Core Equity strategy. Not every client’s account will have these characteristics. Aristotle Atlantic reserves the right to modify its current investment strategies and techniques based on changing market dynamics or client needs. There is no assurance that any securities discussed herein will remain in an account’s portfolio at the time you receive this report or that securities sold have not been repurchased. The securities discussed may not represent an account’s entire portfolio and, in the aggregate, may represent only a small percentage of an account’s portfolio holdings. The performance attribution presented is of a representative account from Aristotle Atlantic’s Core Equity Composite. The representative account is a discretionary client account which was chosen to most closely reflect the investment style of the strategy. The criteria used for representative account selection is based on the account’s period of time under management and its similarity of holdings in relation to the strategy. Recommendations made in the last 12 months are available upon request.
Returns are presented gross and net of investment advisory fees and include the reinvestment of all income. Gross returns will be reduced by fees and other expenses that may be incurred in the management of the account. Net returns are presented net of actual investment advisory fees and after the deduction of all trading expenses.
All investments carry a certain degree of risk, including the possible loss of principal. Investments are also subject to political, market, currency and regulatory risks or economic developments. International investments involve special risks that may in particular cause a loss in principal, including currency fluctuation, lower liquidity, different accounting methods and economic and political systems, and higher transaction costs. These risks typically are greater in emerging markets. While Large-capitalization companies may have more stable prices than smaller, less established companies, they are still subject to equity securities risk. In addition, large-capitalization equity security prices may not rise as much as prices of equity securities of small-capitalization companies. Securities of small- and medium-sized companies tend to have a shorter history of operations, be more volatile and less liquid. Value stocks can perform differently from the market as a whole and other types of stocks. The material is provided for informational and/or educational purposes only and is not intended to be and should not be construed as investment, legal or tax advice and/or a legal opinion. Investors should consult their financial and tax adviser before making investments. The opinions referenced are as of the date of publication, may be modified due to changes in the market or economic conditions, and may not necessarily come to pass. Information and data presented has been developed internally and/or obtained from sources believed to be reliable. Aristotle Capital does not guarantee the accuracy, adequacy or completeness of such information.
Aristotle Atlantic Partners, LLC is an independent registered investment adviser under the Advisers Act of 1940, as amended. Registration does not imply a certain level of skill or training. More information about Aristotle Atlantic, including our investment strategies, fees and objectives, can be found in our Form ADV Part 2, which is available upon request. AAP-2507-10
Performance Disclosures
Sources: CAPS CompositeHubTM
Composite returns for all periods ended June 30, 2025 are preliminary pending final account reconciliation.
The Aristotle Core Equity Composite has an inception date of August 1, 2013 at a predecessor firm. During this time, Mr. Fitzpatrick had primary responsibility for managing the strategy. Performance starting November 1, 2016 was achieved at Aristotle Atlantic.
Past performance is not indicative of future results. Performance results for periods greater than one year have been annualized. Returns are presented gross and net of investment advisory fees and include the reinvestment of all income. Gross returns will be reduced by fees and other expenses that may be incurred in the management of the account. Net returns are presented net of actual investment advisory fees and after the deduction of all trading expenses.
Index Disclosures
The Russell 1000® Growth Index measures the performance of the large cap growth segment of the U.S. equity universe. It includes those Russell 1000 companies with higher price-to-book ratios and higher forecasted growth values. This index has been selected as the benchmark and is used for comparison purposes only. The Russell 1000® Value Index measures the performance of the large cap value segment of the U.S. equity universe. It includes those Russell 1000 companies with lower price-to-book ratios and lower expected growth values. The S&P 500® Index is the Standard & Poor’s Composite Index of 500 stocks and is a widely recognized, unmanaged index of common stock prices. The Dow Jones Industrial Average® is a price-weighted measure of 30 U.S. blue-chip companies. The Index covers all industries except transportation and utilities. The NASDAQ Composite Index measures all NASDAQ domestic and international based common type stocks listed on The NASDAQ Stock Market. The NASDAQ Composite includes over 3,000 companies, more than most other stock market indices. The Bloomberg U.S. Aggregate Bond Index is an unmanaged index of domestic investment grade bonds, including corporate, government and mortgage-backed securities. The WTI Crude Oil Index is a major trading classification of sweet light crude oil that serves as a major benchmark price for oil consumed in the United States. The Russell 2000® Index measures the performance of the small cap segment of the U.S. equity universe. The Russell 2000 Index is a subset of the Russell 3000® Index representing approximately 10% of the total market capitalization of that index. It includes approximately 2000 of the smallest securities based on a combination of their market cap and current index membership. The 3-Month U.S. Treasury Bill is a short-term debt obligation backed by the U.S. Treasury Department with a maturity of three months. The U.S. Dollar Index (DXY) is a measure of the value of the U.S. dollar relative to the value of a basket of currencies of the majority of the United States’ most significant trading partners. The Consumer Price Index (CPI) is a measure of the average change over time in the prices paid by urban consumers for a market basket of consumer goods and services. While stock selection is not governed by quantitative rules, a stock typically is added only if the company has an excellent reputation, demonstrates sustained growth and is of interest to a large number of investors. The volatility (beta) of the Composite may be greater or less than its respective benchmarks. It is not possible to invest directly in these indices.
The second quarter began with a continuation of the risk-off environment from the first quarter. Markets troughed on April 8th (Liberation Day), before staging a high beta, low quality rally for the remainder of the quarter. Elements that sustained the rally were administration delays in the tariff implementation date, hyperscale commitment to outsized AI capex plans among growth-oriented SaaS technology companies, and the resilience of broader consumer spending trends as both individuals and companies front-loaded imports ahead of tariffs. Solid labor market readings and stable-to-lower than expected inflation data kept the Federal Reserve (Fed) on the more hawkish course they took in December. Chairman Powell held rates steady at the June FOMC meeting and is not bowing to political pressure to cut rates sooner than the committee’s analysis indicates. The Fed will continue to maintain a measured approach going forward, updating their economic projections and forecasts to two rate cuts in 2025. Deficit scrutiny increased as the One Big Beautiful Bill Act proceeded through Congress. This was highlighted by Moody’s downgrading the U.S. credit rating from Aaa to Aa1 – the last of the major rating agencies to downgrade the U.S. over the past 14 years.
Stylistically, growth stocks outperformed their value counterparts during the quarter as the Russell 2000 Growth Index returned 11.97% compared to the 4.97% return of the Russell 2000 Value index. This continues the 2024 trend where growth significantly outperformed value.
From a factor perspective, lower quality companies outperformed higher quality companies. Factors that had the highest payoff were high beta, non-earners, high sales growth, momentum and cyclical stocks.
At the sector level, cyclical stocks outperformed defensive stocks. The best performing sectors were Information Technology (+21.32%), Industrials (+15.67%), and Materials (+13.01%) while the worst performing sectors were Real Estate (-1.87%), Utilities (-1.28%), and Consumer Staples (-0.98%).
Sources: CAPS Composite Hub, Russell Investments Past performance is not indicative of future results. Returns are presented gross and net of investment advisory fees and include the reinvestment of all income. Gross returns will be reduced by fees and other expenses that may be incurred in the management of the account. Net returns are presented net of actual investment advisory fees and after the deduction of all trading expenses. Aristotle Small Cap Equity Composite returns are preliminary pending final account reconciliation. Please see important disclosures at the end of this document.
Performance Review
For the second quarter of 2025, the Aristotle Small Cap Equity Composite posted a total return of 3.25% net of fees (3.41% gross of fees), underperforming the 8.50% total return of the Russell 2000 Index. The largest detractor from relative performance was security selection in Consumer Discretionary, Health Care and Information Technology. This was partially offset by strong security selection in Communication Services coupled with an overweight allocation to Information Technology and Industrials.
Relative Contributors
Relative Detractors
Dycom Industries
Chemed
MACOM Technology Solutions
ACI Worldwide
Advanced Energy Industries
Merit Medical System
Itron
Liquidity Services
TKO Group Holdings
Huron Consulting Group
CONTRIBUTORS
Dycom Industries (DY), a provider of engineering and construction services to the telecommunications and cable television industries, benefitted from continued growth in its core business, funding tailwinds, and expanding margins as demand for wireline services continues to grow. We maintain our position as we believe the company remains well positioned for longer-term growth alongside secular trends for expanding fiber deployments to support faster broadband connectivity speeds and opportunities to deploy fiber to rural or underserved areas across the country.
MACOM Technology Solutions (MTSI), a designer and manufacturer of high-performance semiconductor products, surpassed analyst expectations and raised forward guidance bolstering the stock. We maintain our position, as we believe the company’s meaningful exposure to growing demand from Data Center and 5G end market applications along with the integration of recent acquisitions and domestic manufacturing footprint should drive additional shareholder value in periods to come.
DETRACTORS
Chemed (CHE), engages in the provision of healthcare and maintenance services operating through two segments: VITAS and Roto-Rooter. The VITAS segment offers hospice and palliative care services to patients through a network of health care providers, social workers, clergy, and volunteers. The Roto-Rooter segment includes plumbing, drain cleaning, water restoration, and other related services to residential and commercial customers. The stock declined due to concerns surrounding the potential Medicare cap limits proposed in current legislation for its VITAS segment alongside weaker residential demand for its plumbing services segment. We continue to maintain our position, as we believe the slowing demand in the Roto-Rooter segment is transitory and the secular demand for hospice care remains strong.
ACI Worldwide (ACIW), is a provider of software solutions to facilitate payment transactions for financial institutions, retailers, and payment processors around the world. The company reported strong Q1 earnings and reaffirmed FY 2025 guidance, yet the stock price declined due to investor sentiment around macroeconomic concerns. We maintain our investment as we believe the company has a strong market position in the payments software niche segment. New revenues with higher incremental margins and effective cost controls should allow management to delever the balance sheet while continuing to deliver value to shareholders.
Recent Portfolio Activity
Buys/Acquisitions
Sells/Liquidations
Alight
Berkshire Hills Bancorp
Flowserve
Columbus McKinnon
Guardian Pharmacy Services
JBG SMITH Properties
Interparfums
Monro
ScottsMiracle-Gro
Tronox
Verra Mobility
BUYS/ACQUISITIONS
Alight (ALIT), operates a cloud-based platform that provides human capital management and benefits administration solutions to mostly Fortune 500 companies. We believe the company has the opportunity to grow its business through the expansion of existing client relationships along with attracting new clients to their platform. Self-help initiatives implemented by the new CEO coupled with technological enhancements to the platform are expected to streamline operational costs and improve margins on a go-forward basis.
Flowserve (FLS), manufactures and provides aftermarket services for comprehensive flow control systems critical to a diverse range of end markets. We view the company as having an established track record of strong operating and financial fundamentals and the stock was trading at an attractive valuation. Subsequent to initiating the position, the company announced a merger with Chart Industries (GTLS) that is expected to enhance the combined companies’ ability to provide more products and services to their global customers’ projects.
Guardian Pharmacy Services (GRDN), is a leading provider of pharmacy services to long-term care assisted living and behavioral health facilities in the U.S. The company has built a market leading position as a result of a differentiated technology-driven service offering that benefits patients, facility operators and payors. We believe the company is well positioned to continue to capitalize on the secular trend of the aging U.S. population and grow faster than the overall market because of their specific service offering.
Interparfums (IPAR), is a global manufacturer, marketer and distributor of fragrance products in the United States and Europe. The company focuses on the prestige fragrance market and has licensing deals with brands such as Jimmy Choo, Coach, Lacoste, Guess and DKNY, to name a few. We believe the company is well positioned to capitalize on the increased demand for fragrances in the US, China and amongst younger consumers. This secular trend coupled with continued new product innovation and the potential for additional licensing partnerships are expected to enhance shareholder value over the next several years.
ScottsMiracle-Gro (SMG), is a leading manufacturer of branded consumer lawn and garden products in North America. After benefitting from increased demand during the COVID lockdown years, the company experienced several years of below normal growth. As demand has begun to normalize to pre-COVID levels and the company unwinds a poorly executed diversification strategy, shareholder value is expected to be enhanced through margin expansion, balance sheet deleveraging.
Verra Mobility (VRRM), is a provider of automated enforcement, tolling, and parking technologies and solutions. We believe the company is well positioned to benefit from accelerating automated enforcement tailwinds as legislative support and expanding use cases drive adoption by municipalities seeking safer more efficient roadways. We also view the combination of highly recurring long-term contracted revenues, high margins, and high renewal rates as attractive qualities of the company’s business model.
SELLS/LIQUIDATIONS
Berkshire Hills Bancorp (BHLB), is a regional bank primarily serving the NY and New England area. The company announced a merger of equals with Brookline Bancorp. After re-underwriting the combined organization, we chose to exit our position as we were not comfortable with the new management team, nor with the significantly increased loan to deposit ratio.
Columbus McKinnon (CMCO), engages in the design, manufacture, and marketing of material handling products and systems. After carefully assessing the company’s announced acquisition of Kito-Crosby, and choice of convertible preferred equity to finance the deal, we felt the dramatic shift away from a long-standing strategy of smaller, technology forward acquisitions combined in a meaningfully increased financial leverage profile justified selling the position.
JBG SMITH Properties (JBGS), a Washington, DC-focused real estate investment trust that develops, owns and operates a portfolio of mixed-use properties (multifamily, commercial, development and land assets). Concerns related to the company’s capital allocation plans along with deteriorating fundamentals in their core operating market prompted our decision to exit the position.
Monro (MNRO), operates a chain of approximately 1,200 automotive repair and tire retail stores. Ongoing weak demand had weighed on the company’s profitability for longer than anticipated and with expectations for continued economic pressures for their core low-income customers, we decided to exit the position.
Tronox (TROX), a leading global manufacturer of titanium dioxide (TiO2) pigment, a key ingredient in paint, plastics and a variety of other industrial applications. We believe the company is well positioned to benefit from increased production volumes and product pricing driven by improving global economic conditions. However, an increasingly uncertain economic outlook as a result of the threat of increased global tariffs pushed out the expected demand recovery combined with a cyclically driven stressed balance sheet caused us to exit the position.
Outlook
We continue to remain optimistic about the long-term potential for the small-cap segment of the U.S. market. Valuations remain compelling relative to large caps, with the Russell 2000 Index trading near multi-decade lows on a relative basis. Potential tailwinds, including deregulation, lower corporate tax rate, increased M&A activity, continued reshoring of U.S. manufacturing, and infrastructure-related spending, could provide additional support for small-cap stocks. We have experienced some short-term volatility related to the current administration’s policies and legislation. We also remain mindful of risks such as inflation reaccelerating, increased geopolitical tensions, andpotential U.S. economic weakness.
Positioning
Our current positioning is a function of our bottom-up security selection process and our ability to identify what we view as attractive investment candidates, regardless of economic sector definitions. Overweight allocations in Information Technology and Industrials are mostly a function of our underlying company specific views rather than any top-down predictions for each sector. Conversely, we continue to be underweight in Consumer Discretionary, as we have been unable to identify what we consider to be compelling long-term opportunities that fit our discipline given the rising risk profiles of many retail businesses and a potential deceleration in goods spending following a period of strength. We are also underweight in Financials as the sector has experienced strong returns, leading us to harvest gains and redeploy the proceeds to what we consider to be more attractive reward to risk opportunities. Given our focus on long-term business fundamentals, our patient investment approach and low portfolio turnover, the strategy’s sector positioning generally does not change significantly from quarter to quarter. However, we may take advantage of periods of volatility by adding selectively to certain companies when appropriate.
Disclosures
The opinions expressed herein are those of Aristotle Capital Boston, LLC (Aristotle Boston) and are subject to change without notice.
Past performance is not indicative of future results. The information provided in this report should not be considered financial advice or a recommendation to purchase or sell any particular security. There is no assurance that any securities discussed herein will remain in an account’s portfolio at the time you receive this report or that securities sold have not been repurchased. The securities discussed may not represent an account’s entire portfolio and, in the aggregate, may represent only a small percentage of an account’s portfolio holdings. The performance attribution presented is of a representative account from Aristotle Boston’s Small Cap Equity Composite. The representative account is a discretionary client account which was chosen to most closely reflect the investment style of the strategy. The criteria used for representative account selection is based on the account’s period of time under management and its similarity of holdings in relation to the strategy. It should not be assumed that any of the securities transactions, holdings or sectors discussed were or will be profitable, or that the investment recommendations or decisions Aristotle Boston makes in the future will be profitable or equal the performance of the securities discussed herein. Aristotle Boston reserves the right to modify its current investment strategies and techniques based on changing market dynamics or client needs. Recommendations made in the last 12 months are available upon request.
Returns are presented gross and net of investment advisory fees and include the reinvestment of all income. Gross returns will be reduced by fees and other expenses that may be incurred in the management of the account. Net returns are presented net of actual investment advisory fees and after the deduction of all trading expenses.
Effective January 1, 2022, the Aristotle Small Cap Equity Composite has been redefined to exclude accounts with meaningful industry-specific restrictions or substantial values-based screens hampering implementation of the small cap strategy.
All investments carry a certain degree of risk, including the possible loss of principal. Investments are also subject to political, market, currency and regulatory risks or economic developments. International investments involve special risks that may in particular cause a loss in principal, including currency fluctuation, lower liquidity, different accounting methods and economic and political systems, and higher transaction costs. These risks typically are greater in emerging markets. While Large-capitalization companies may have more stable prices than smaller, less established companies, they are still subject to equity securities risk. In addition, large-capitalization equity security prices may not rise as much as prices of equity securities of small-capitalization companies. Securities of small- and medium-sized companies tend to have a shorter history of operations, be more volatile and less liquid. Value stocks can perform differently from the market as a whole and other types of stocks. The material is provided for informational and/or educational purposes only and is not intended to be and should not be construed as investment, legal or tax advice and/or a legal opinion. Investors should consult their financial and tax adviser before making investments. The opinions referenced are as of the date of publication, may be modified due to changes in the market or economic conditions, and may not necessarily come to pass. Information and data presented has been developed internally and/or obtained from sources believed to be reliable. Aristotle Boston does not guarantee the accuracy, adequacy or completeness of such information.
Aristotle Capital Boston, LLC is an independent investment adviser registered under the Investment Advisers Act of 1940, as amended. Registration does not imply a certain level of skill or training. More information about Aristotle Boston, including our investment strategies, fees and objectives, can be found in our Form ADV Part 2, which is available upon request. ACB-2507-12
Performance Disclosures
Sources: CAPS Composite Hub, Russell Investments
Composite returns for periods ended June 30, 2025, are preliminary pending final account reconciliation.
*The Aristotle Small Cap Equity Composite has an inception date of November 1, 2006, at a predecessor firm. During this time, Jack McPherson and Dave Adams had primary responsibility for managing the strategy. Performance starting January 1, 2015, was achieved at Aristotle Boston.
**For the period November 2006 through December 2006.
Past performance is not indicative of future results. Performance results for periods greater than one year have been annualized.
Effective January 1, 2022, the Aristotle Small Cap Equity Composite has been redefined to exclude accounts with meaningful industry-specific restrictions or substantial values-based screens hampering implementation of the small cap strategy.
Returns are presented gross and net of investment advisory fees and include the reinvestment of all income. Gross returns will be reduced by fees and other expenses that may be incurred in the management of the account. Net returns are presented net of actual investment advisory fees and after the deduction of all trading expenses. Please see important disclosures enclosed within this document.
Index Disclosures
The Russell 2000® Index measures the performance of the small cap segment of the U.S. equity universe. The Russell 2000 Index is a subset of the Russell 3000® Index representing approximately 10% of the total market capitalization of that index. It includes approximately 2000 of the smallest securities based on a combination of their market cap and current index membership. The Russell 2000 Growth® Index measures the performance of the small cap companies located in the United States that also exhibit a growth probability. The Russell 2000 Value® Index measures the performance of the small cap companies located in the United States that also exhibit a value probability. The volatility (beta) of the composite may be greater or less than the benchmarks. It is not possible to invest directly in these indices.


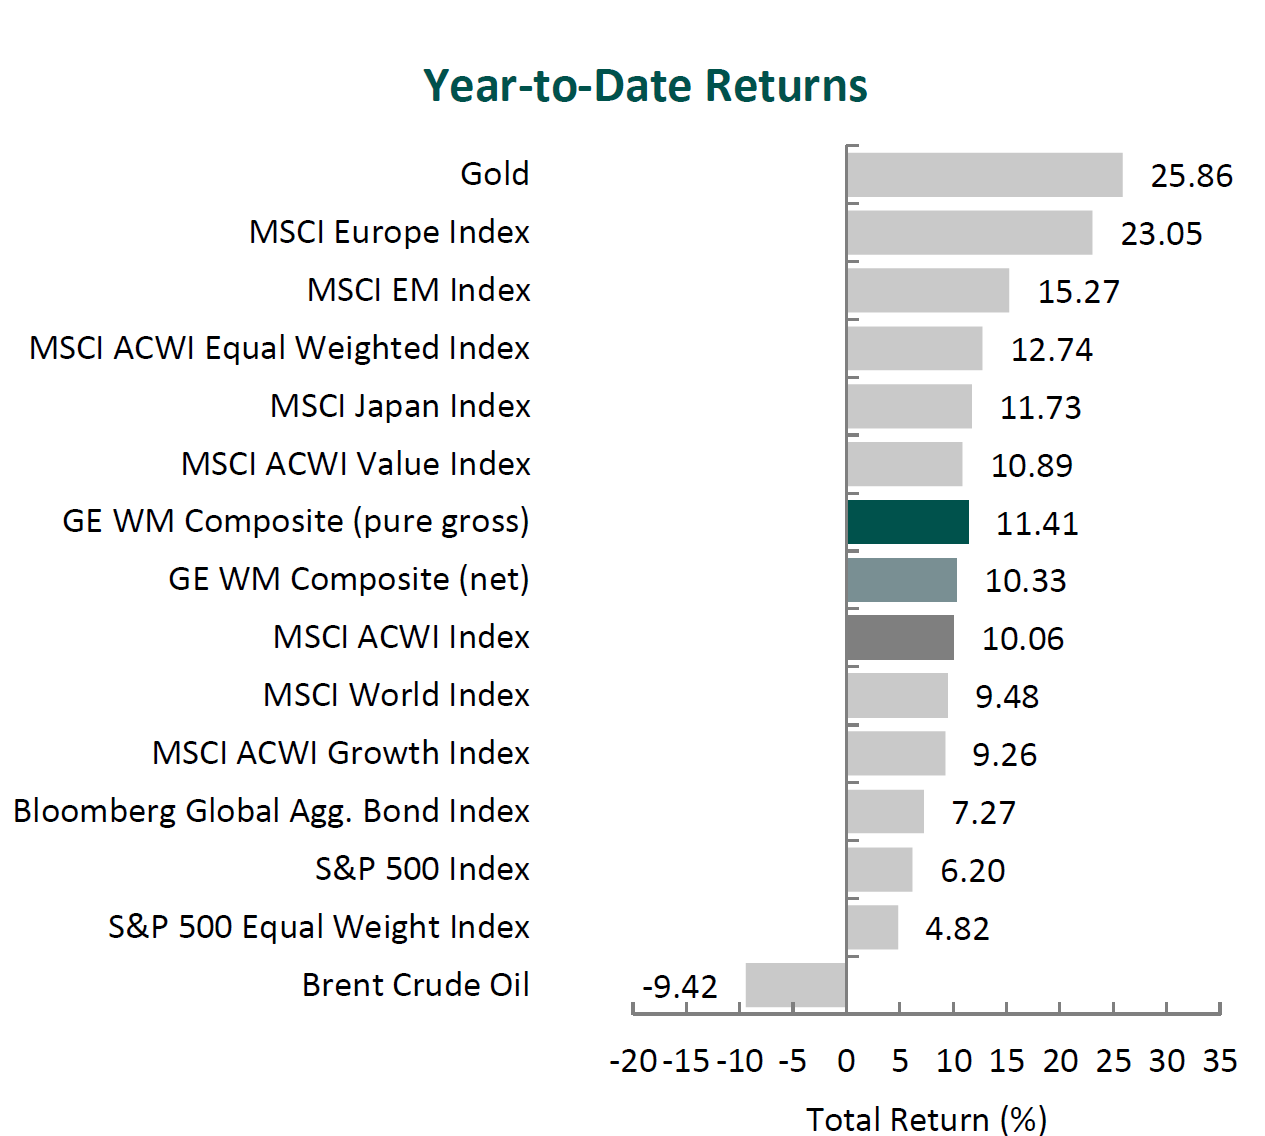
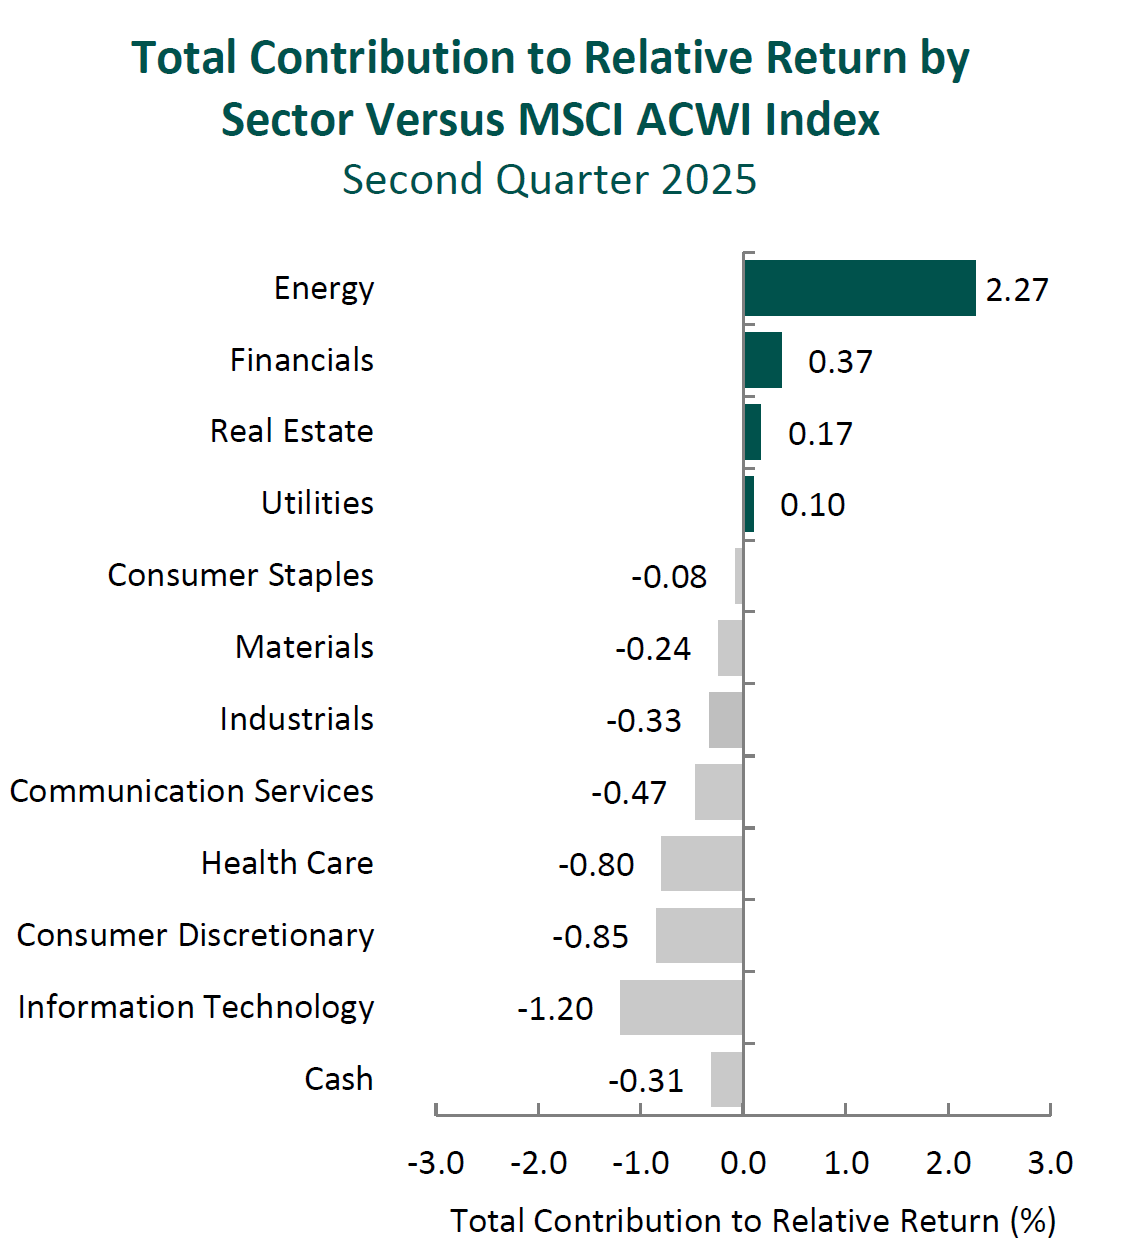
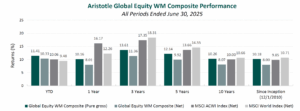
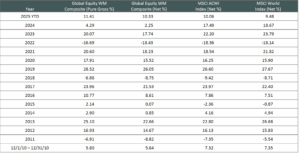

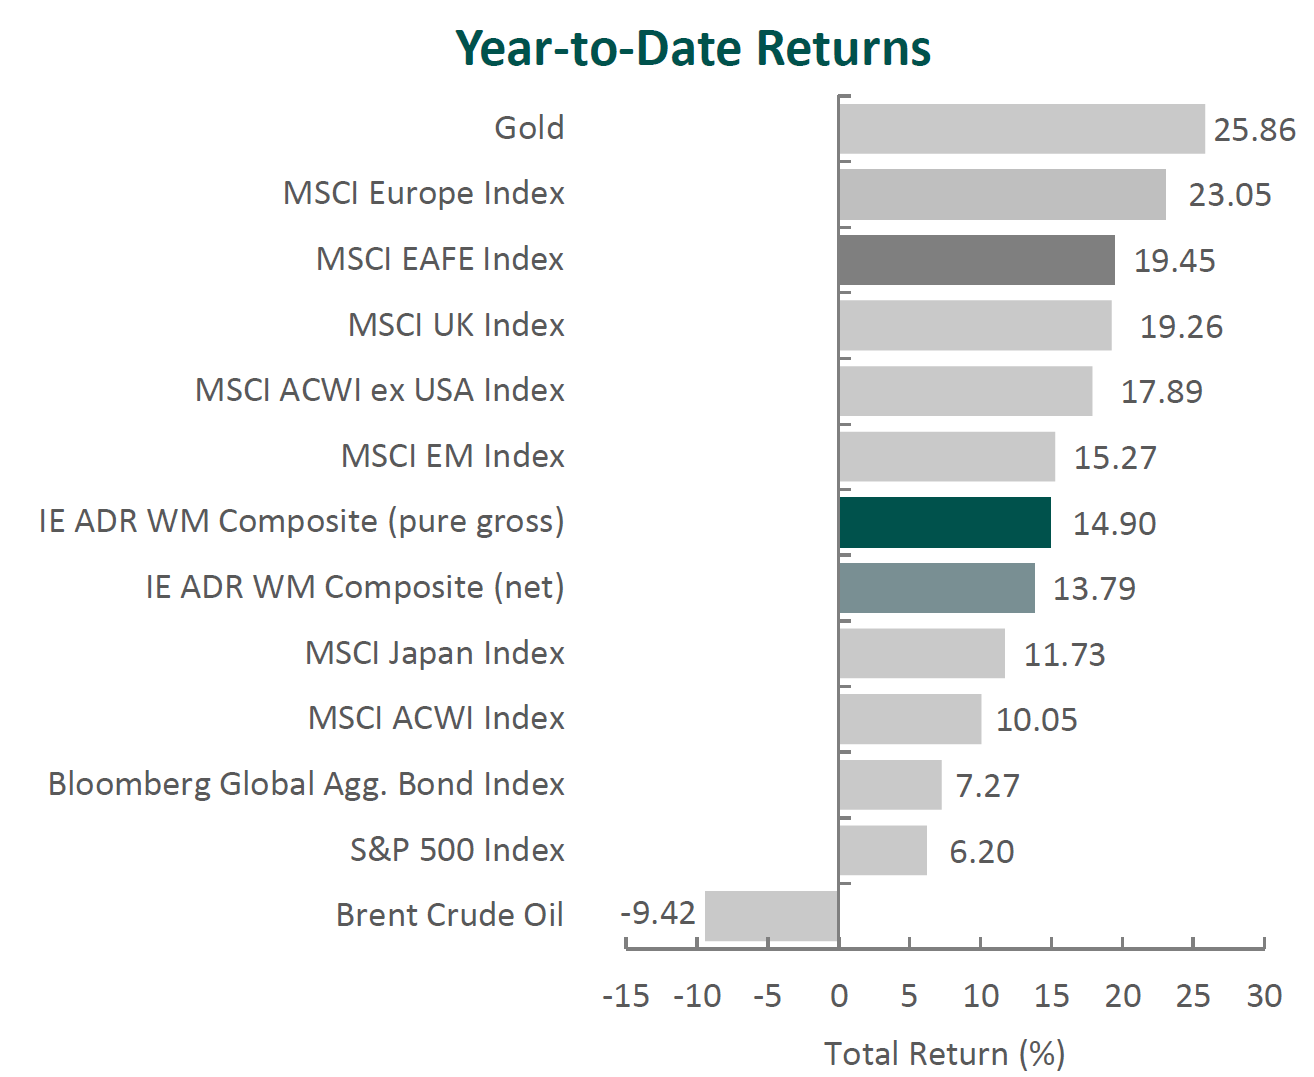
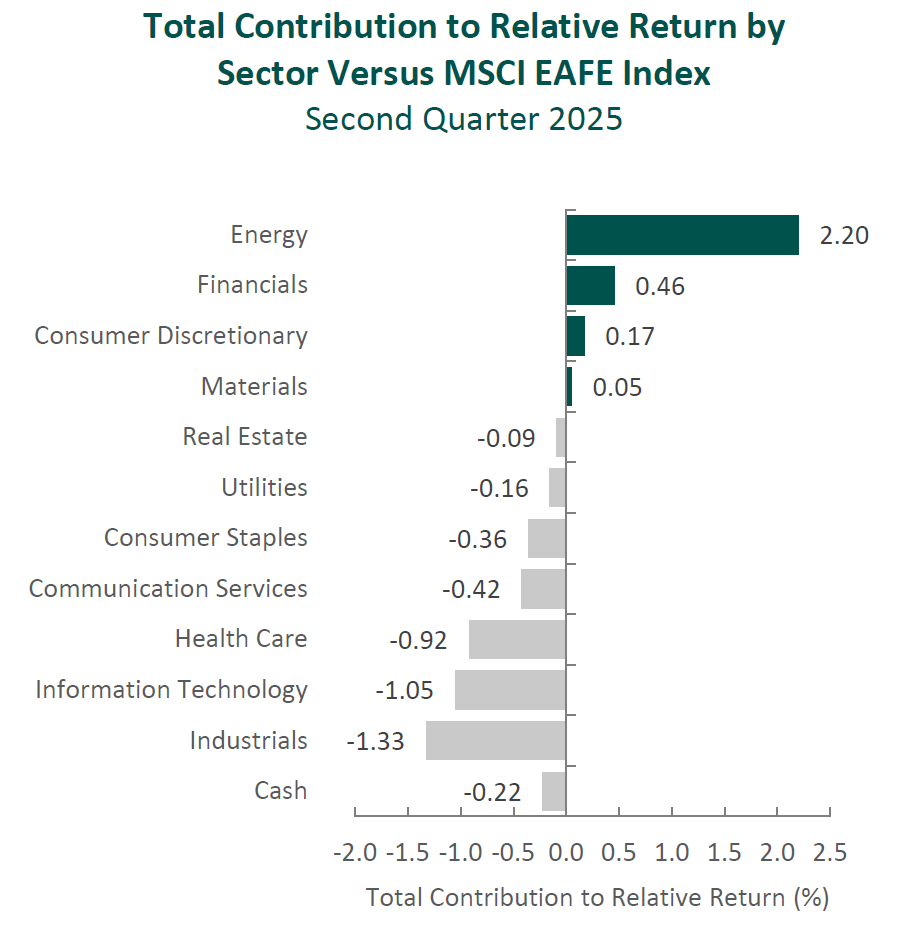
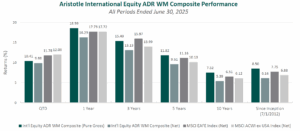
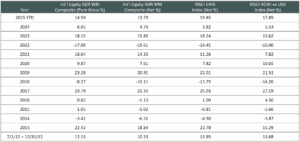

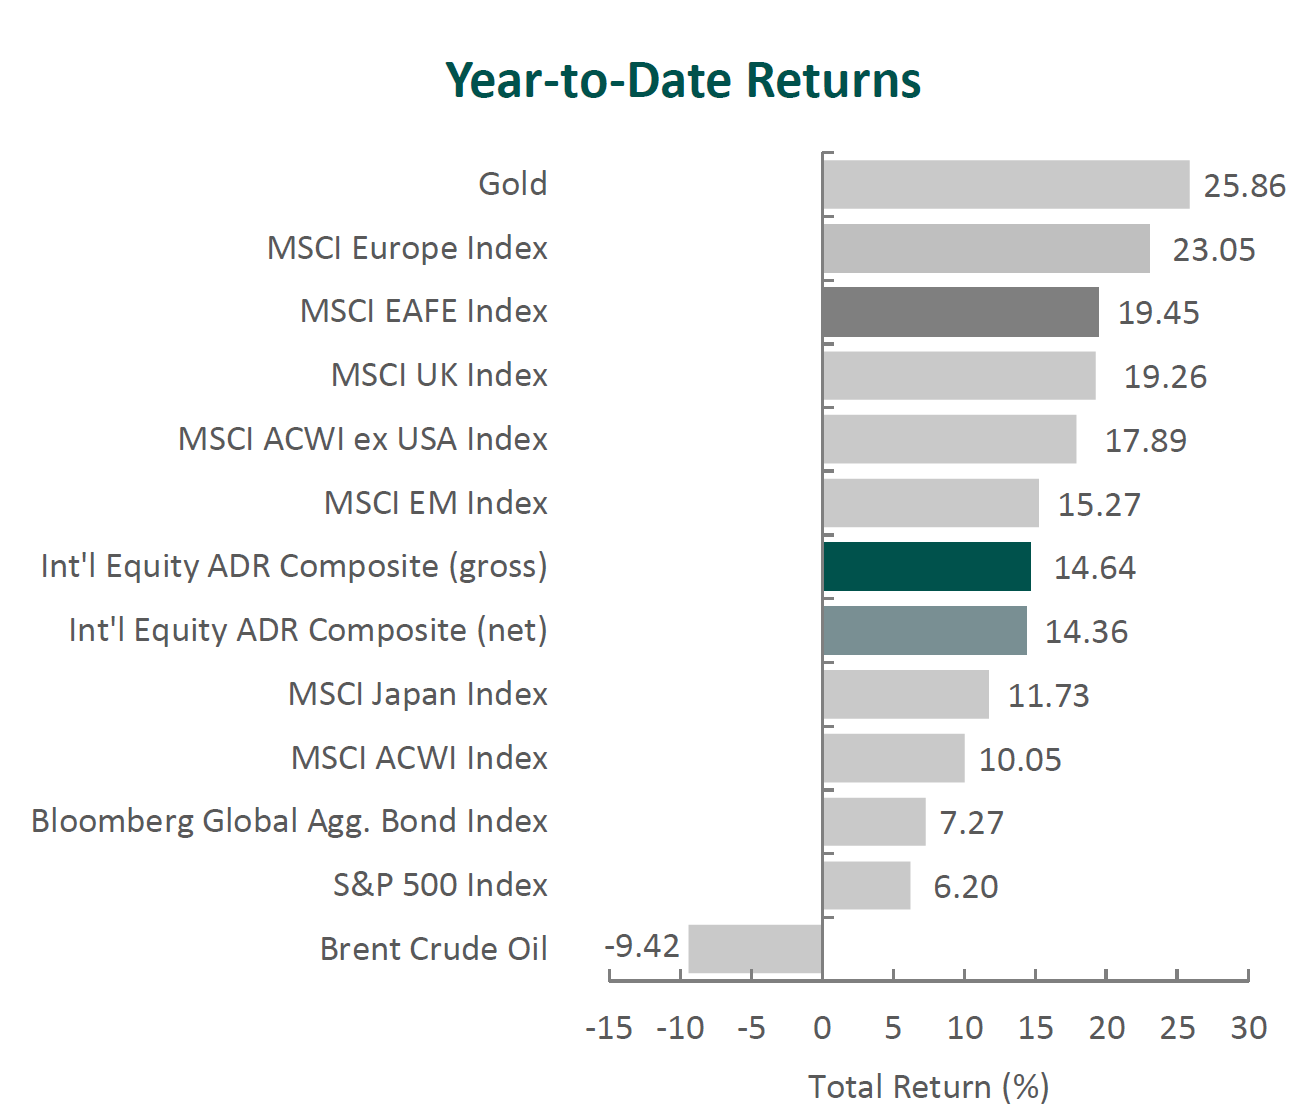

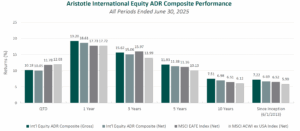
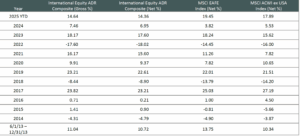


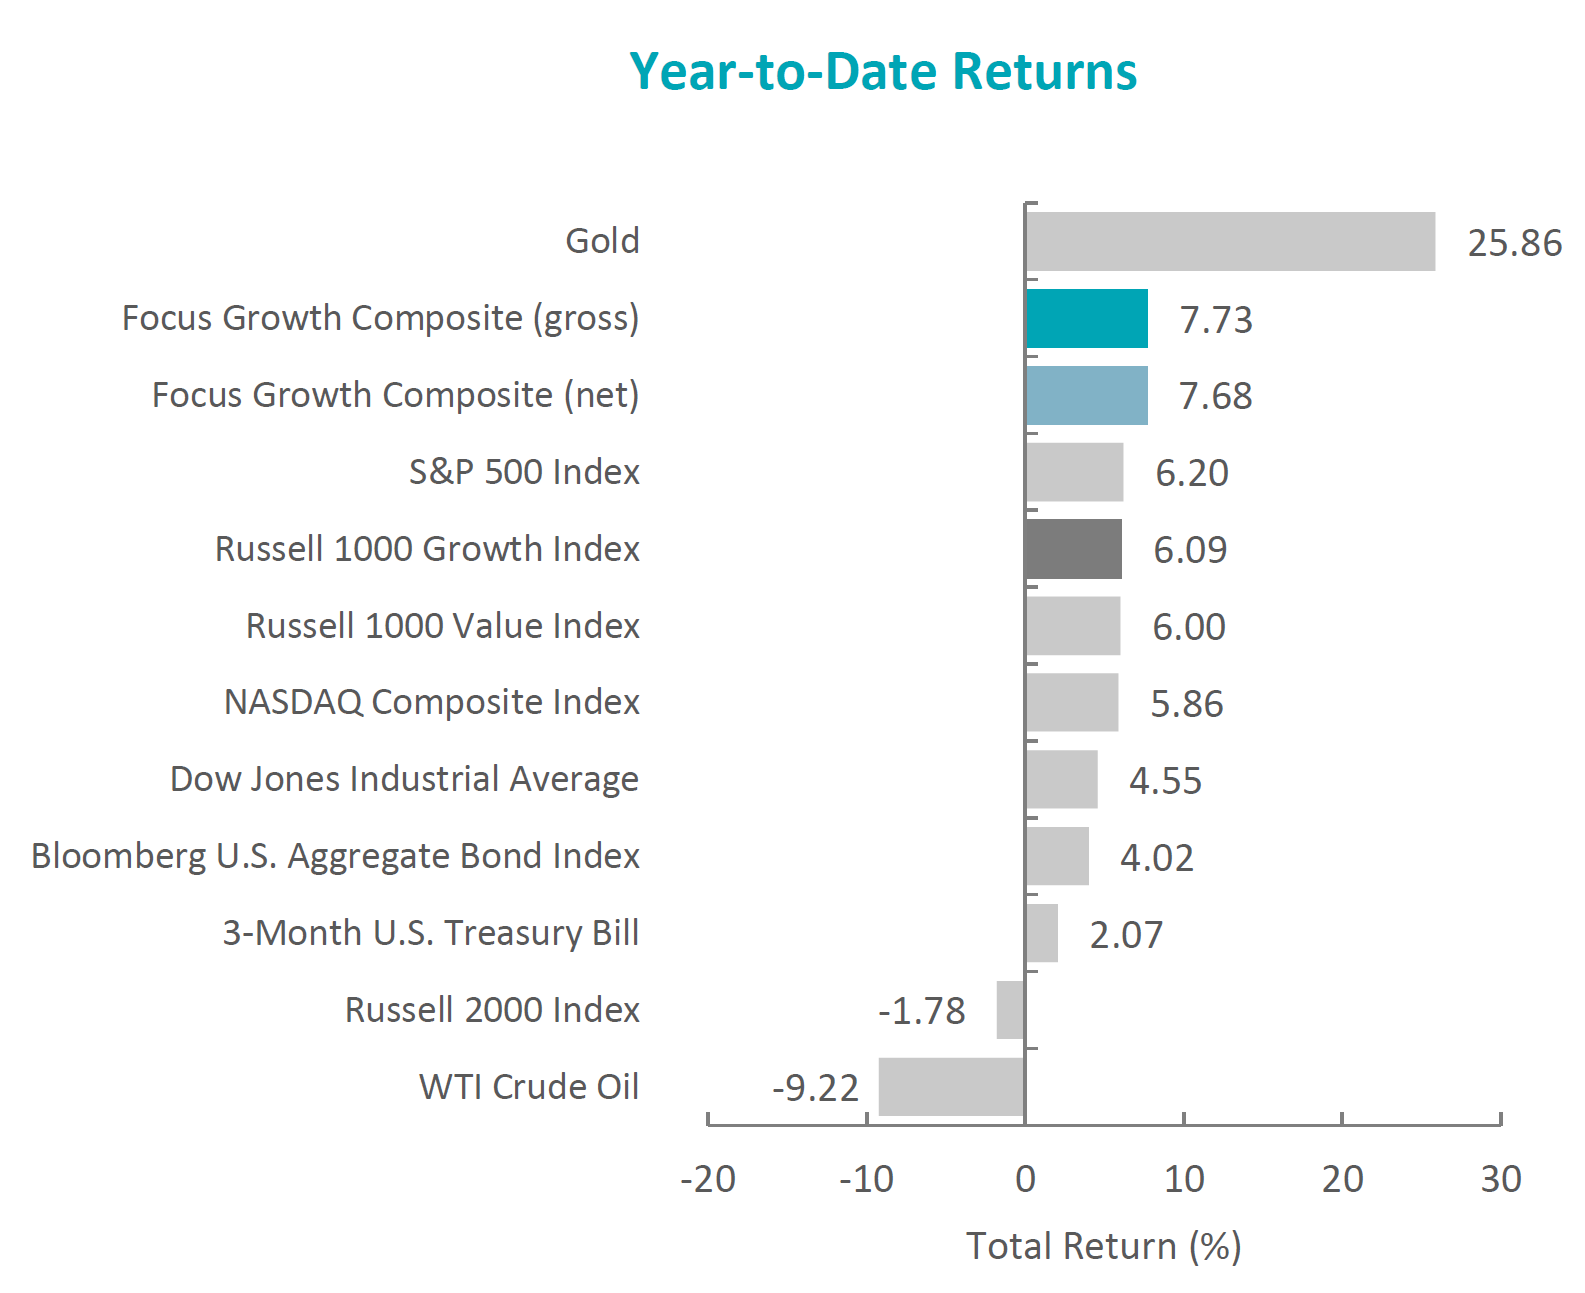
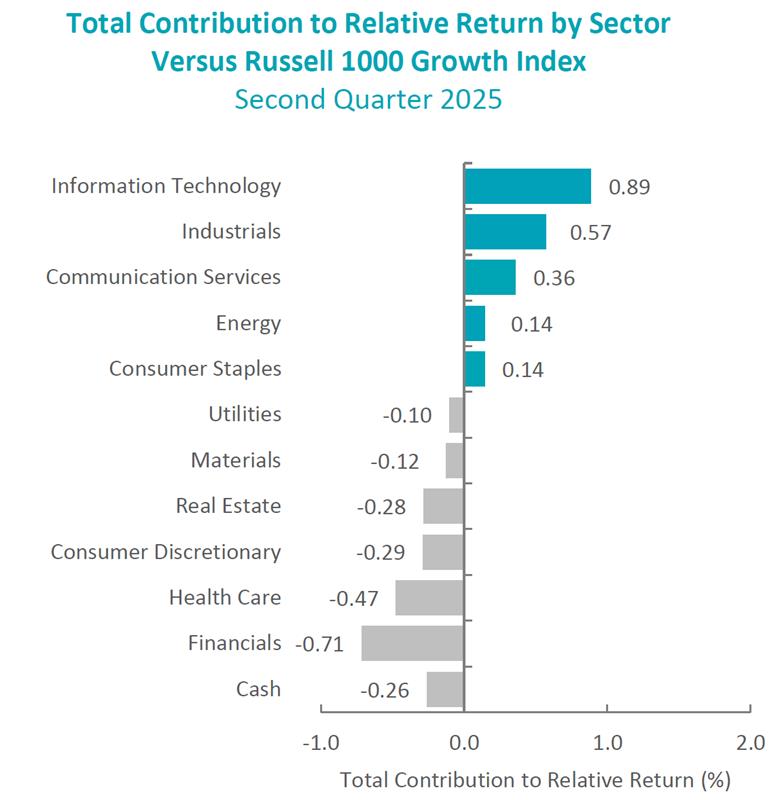
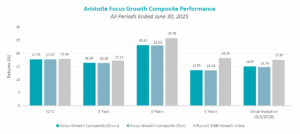
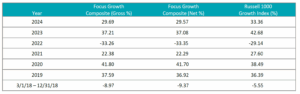 Sources: CAPS CompositeHubTM