Commentary
Global Equity Advisory 3Q 2025
(All MSCI index returns are shown net and in U.S. dollars unless otherwise noted.)
Markets Review
Sources: CAPS CompositeHubTM, Bloomberg
Past performance is not indicative of future results. Aristotle Global Equity WM Composite returns are presented pure gross and net of maximum wrap fee and include the reinvestment of all income. Pure gross returns do not reflect the deduction of any trading costs or other fees and are supplemental to the net returns. Net returns are calculated by subtracting the highest applicable wrap/SMA fee, which includes trading costs and custodial fees, from the pure gross composite return. The highest applicable wrap/SMA fee is 2.00% on an annual basis, or 0.50% quarterly from inception to 12/31/2023 and 0.17% monthly from 1/1/2024 to present. Aristotle Capital Composite returns are preliminary pending final account reconciliation. Please see important disclosures at the end of this document.
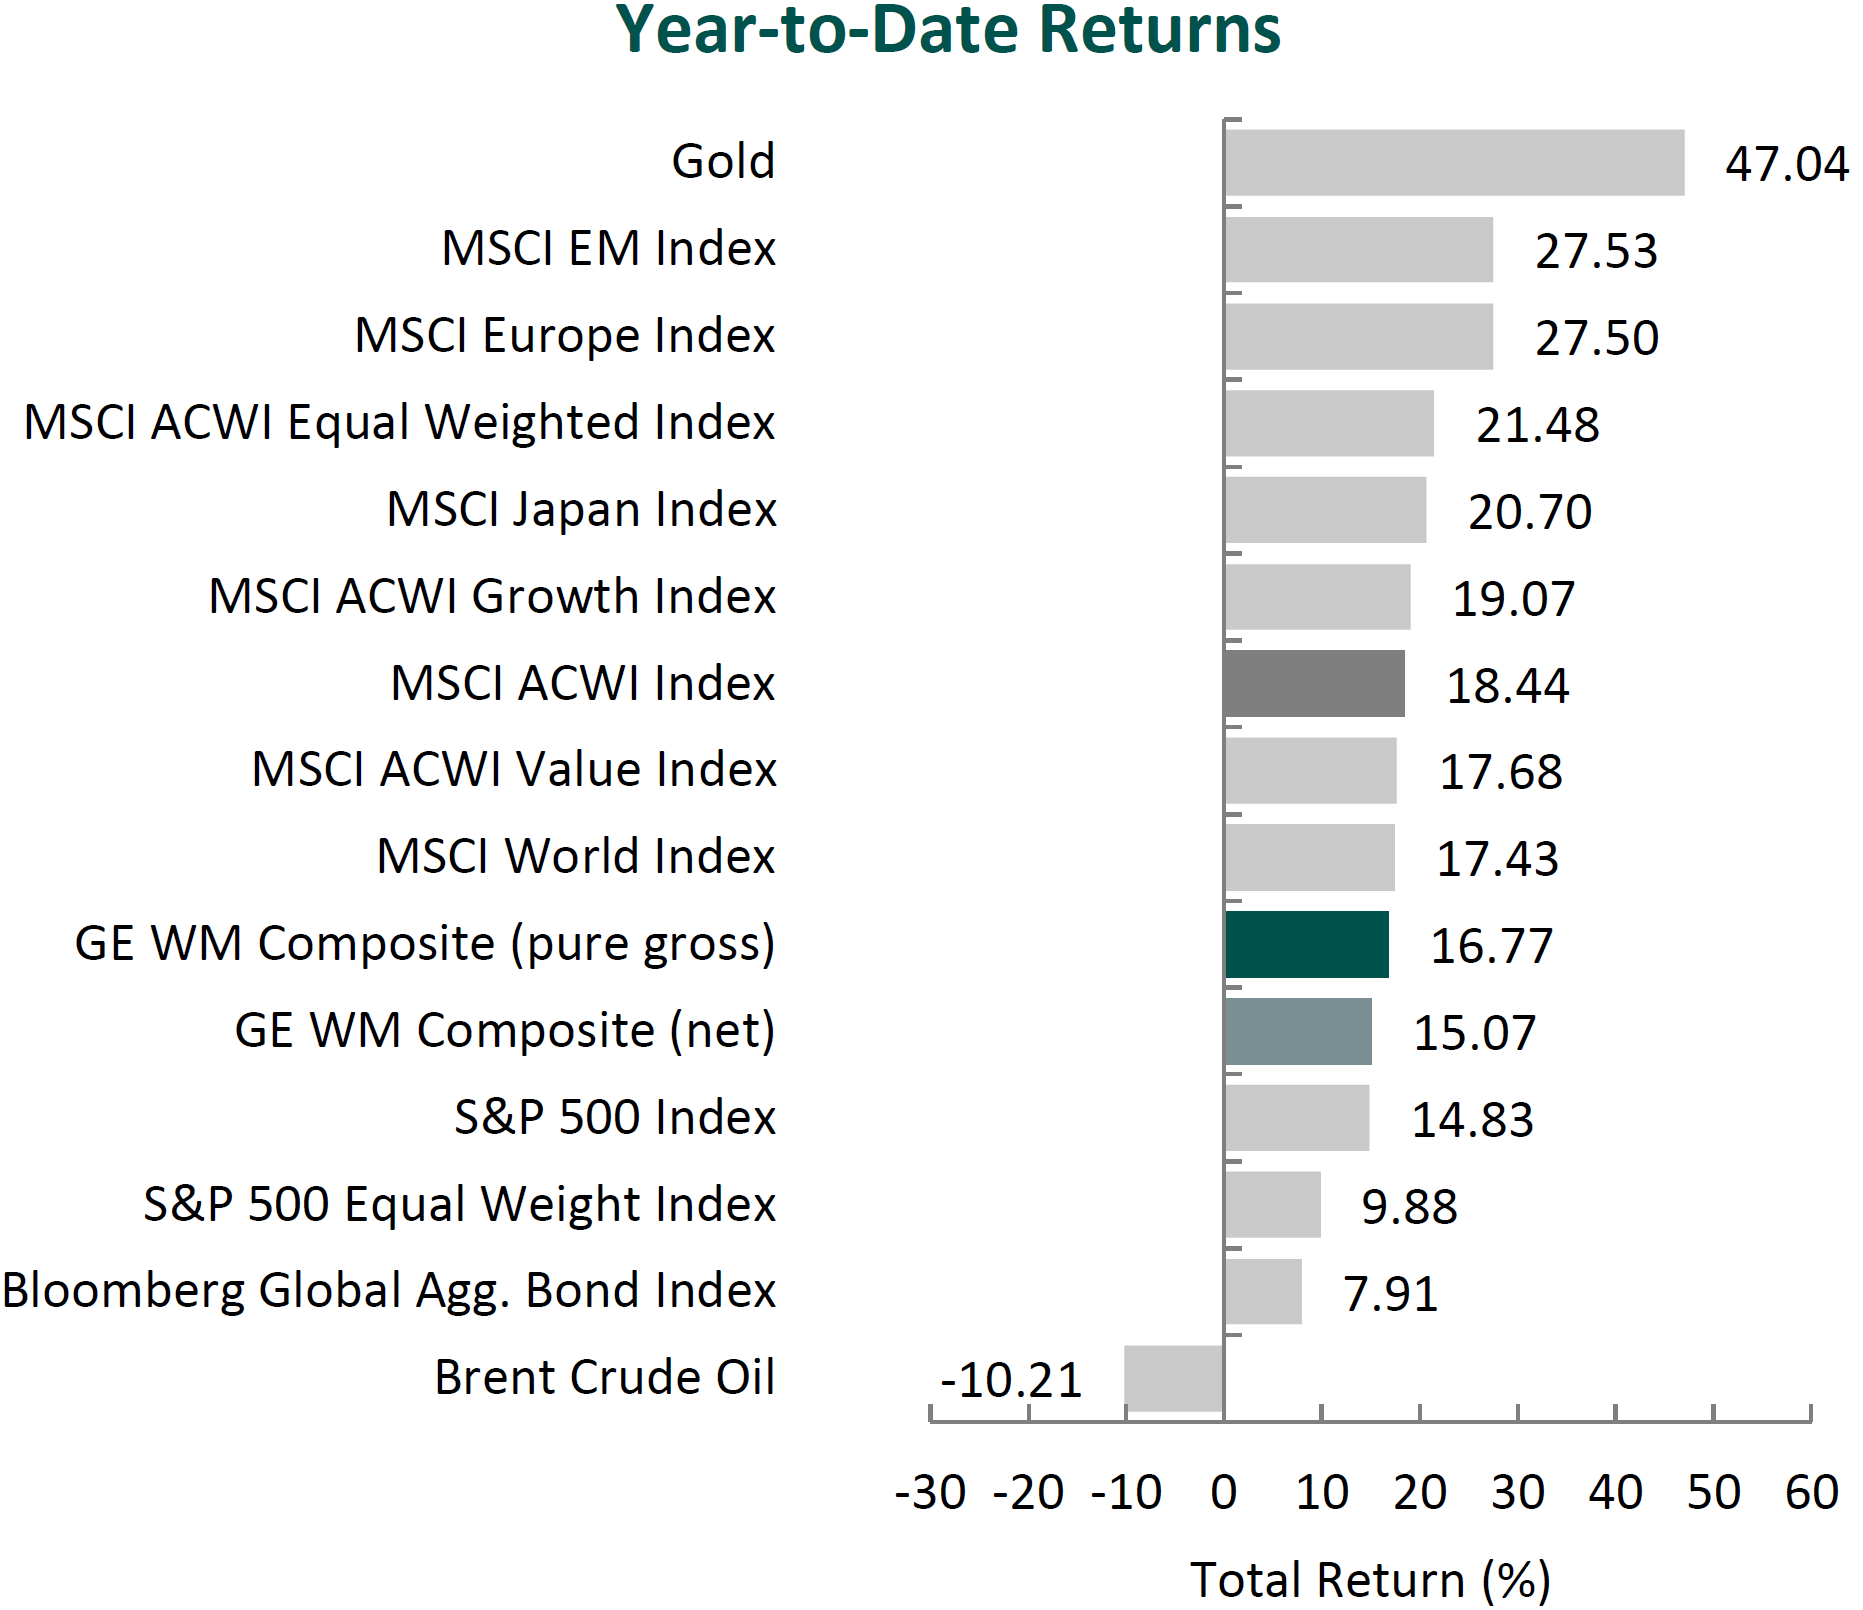
Global equity markets continued to surge, with the MSCI ACWI Index returning 7.62% for the third quarter. Concurrently, global fixed income markets also advanced, as the Bloomberg Global Aggregate Bond Index increased 0.60%. Value stocks underperformed growth stocks over the quarter, with the MSCI ACWI Value Index trailing the MSCI ACWI Growth Index by 2.85%.
Gains in the global equity markets were broad-based during the period, with Emerging Markets performing especially well. Among Developed Markets, North America and Japan were top performers, while gains in Europe were more subdued. On a sector basis, ten out of the eleven sectors within the MSCI ACWI Index advanced, led by Information Technology, Communication Services and Materials. Consumer Staples, Real Estate and Health Care were the worst-performing sectors.
The U.S. economy rebounded, as real GDP increased by an annual rate of 3.8% in the second quarter, reversing the contraction in the prior quarter—the first in three years. While the headline growth was encouraging, economists caution that the underlying picture may be less robust than it appears. Much of the rebound stemmed from a decline in imports, which the U.S. Bureau of Economic Analysis attributes to the unwinding of a tariff-driven import surge earlier in the year. In effect, lower imports mechanically boosted net exports, temporarily inflating growth figures.
Beyond trade distortions, domestic demand remained steady, supported by consumer spending. However, the labor market showed signs of cooling: job gains slowed in August, and the unemployment rate—while remaining historically low—increased slightly to 4.3%. Consumer confidence weakened sequentially and year-over-year, yet spending resilience suggests households continue to lean on wage growth and accumulated savings.
Inflation data added to the complexity. The Consumer Price Index (CPI) edged higher, keeping inflation above the Federal Reserve’s 2% target. With a combination of still-elevated inflation, softer employment data and rising macroeconomic uncertainty, the FOMC reduced the federal funds rate by 0.25%, bringing the range to 4.00%-4.25%. Policymakers emphasized flexibility, underscoring their “data-dependent” approach amid competing signals.
While uncertainty remained a theme in the Fed’s recent statements, trade-related concerns eased somewhat as the White House announced progress on multiple agreements. In Europe, the U.S. and EU reached a deal under which the EU agreed to pay the U.S. a 15% tariff rate, committed to purchase $750 billion in U.S. energy and pledged $600 billion in new U.S. investments by 2028. Japan also agreed to a baseline 15% tariff on nearly all Japanese imports and committed to purchasing $8 billion annually in U.S. agricultural goods. Even relations with China steadied as President Trump extended the suspension of higher tariffs until November, while U.S. lawmakers visited the country for the first time since 2019.
However, some trade tensions persisted. The Trump Administration announced an additional 25% tariff on Indian imports in response to continued Russian oil purchases, a move that brought Russia, China and India into closer alignment. President Trump also imposed an additional 40% tariff on Brazil as he accused the country of coercing U.S companies to censor speech and turn over sensitive U.S. user data. Meanwhile, in a divided ruling, a U.S. appeals court raised questions about the legal basis for certain tariffs but stayed its order, keeping the measures in effect through mid-October while appeals proceed. The Supreme Court will hear the case on November 5, with the outcome potentially clarifying the scope of executive authority on trade policy.
Corporate America, however, showed resilience. S&P 500 companies reported earnings growth of 11.7% year-over-year, marking the third straight quarter of double-digit expansion. Importantly, over 80% of companies exceeded EPS estimates, despite more than 340 firms citing tariff-related headwinds in their commentary. Earnings strength was broad-based, led by Communication Services, Information Technology and Financials, highlighting the adaptability of U.S. firms even in a volatile trade and policy environment.
Performance and Attribution Summary
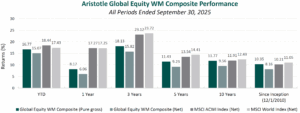
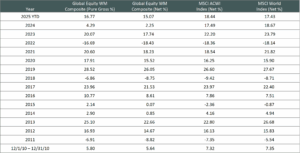
For the third quarter of 2025, Aristotle Capital’s Global Equity WM Composite posted a total return of 4.81% pure gross of fees (4.30% net of fees), underperforming the MSCI ACWI Index, which returned 7.62%, and the MSCI World Index, which returned 7.27%. Please refer to the table below for detailed performance.
| Performance (%) | 3Q25 | YTD | 1 Year | 3 Years | 5 Years | 10 Years | Since Inception* |
|---|---|---|---|---|---|---|---|
| Global Equity WM Composite (pure gross) | 4.81 | 16.77 | 8.17 | 18.13 | 11.43 | 11.77 | 10.35 |
| Global Equity WM Composite (net) | 4.30 | 15.07 | 6.06 | 15.82 | 9.23 | 9.56 | 8.16 |
| MSCI ACWI Index (net) | 7.62 | 18.44 | 17.27 | 23.12 | 13.54 | 11.91 | 10.21 |
| MSCI World Index (net) | 7.21 | 17.43 | 17.25 | 23.72 | 14.41 | 12.43 | 11.05 |

Source: FactSet
Past performance is not indicative of future results. Sector attribution shows how much of a portfolio’s overall return is directly attributable to stock selection and asset allocation decisions within the portfolio, highlighting which sectors contributed or detracted to the total return. Attribution includes the reinvestment of income. Attribution is presented gross of fees and does not include the deduction of all fees and expenses that a client or investor has paid or would have paid. Please refer to the gross and net composite returns included within to understand the overall impact of fees.
From a sector perspective, the portfolio’s underperformance relative to the MSCI ACWI Index can be attributed to both security selection and allocation effects. Security selection in Information Technology, Materials and Industrials detracted the most from the portfolio’s relative performance. Conversely, security selection in Financials, Communication Services and Consumer Discretionary contributed to relative return.
Regionally, both security selection and allocation effects were responsible for the portfolio’s underperformance relative to the MSCI ACWI Index. Security selection in Europe detracted the most from relative performance, while security selection in Asia/Pacific ex Japan was the largest contributor.
Contributors and Detractors for 3Q 2025
| Relative Contributors | Relative Detractors |
|---|---|
| FirstCash | MonotaRO |
| Cameco | Nemetschek |
| Martin Marietta | Alcon |
| Lennar | Microchip Technology |
| Jazz Pharmaceuticals | Munich Reinsurance |
MonotaRO, the Japanese business-to-business (B2B) e-commerce platform, was the largest detractor during the quarter. The company—which enables customers to source millions of maintenance, repair and operations (MRO) products through a centralized digital interface—reported a deceleration in sales growth, prompting downward revisions to full-year targets. Results were impacted by weaker-than-expected demand from industrial end markets, and we believe some of the share price weakness also reflected profit-taking following strong performance in prior periods. From our perspective, these short-term dynamics do not alter the structural advantages of MonotaRO’s business model. The company continues to gain traction with large enterprise customers, who now represent over 30% of sales. These clients typically have higher lifetime value and are more likely to adopt MonotaRO’s value-added services, such as purchase management systems, which enhance customer retention and deepen relationships. Importantly, we believe MonotaRO’s value proposition lies in convenience, execution and product curation—qualities that are difficult to replicate in Japan’s fragmented MRO market. With a high-margin, asset-light model, a scalable platform and a long runway to expand share across businesses of all sizes, we continue to view MonotaRO as a high-quality, competitively advantaged business.
Nemetschek, a leading global provider of software solutions for the architecture, engineering, construction (AEC) and building operations industry, was a detractor during the period. The company continues to span the entire project lifecycle, with about 66% recurring revenue and a dominant 50% market share in Europe. Its competitive advantage is underpinned by approximately 23% of sales reinvested in R&D and a loyal user base. Third quarter underperformance reflected what we view as temporary headwinds: an accounting-driven revenue pull-forward from multi-year contracts, soft demand in German-speaking markets for design software, and a one-off charge related to an insolvent payment provider. Encouragingly, underlying fundamentals and drivers remain strong. Second quarter revenue grew 30.5% year-over-year, with annual recurring revenue up 39% and subscription/Software as a Service (SaaS) sales jumping about 67%, while the Build segment (Bluebeam, GoCanvas) also delivered standout growth. We remain confident in long-term catalysts, including Nemetschek’s transition from perpetual licenses to subscription/SaaS, accelerating Building Information Modeling adoption in construction (i.e., creating a digital twin for architects, engineers, contractors and owners to collaborate in real time), expansion into the U.S. and Asia, and bundling of its 15 brands. These drivers, combined with strong execution and market leadership, support our conviction in Nemetschek’s long-term FREE cash flow trajectory.
Pawn shop operator FirstCash was the top contributor during the quarter. FirstCash holds a dominant position in the pawn lending industry (operating about 3,300 stores, about 2.5x the footprint of its nearest competitor) and benefits from a customer base where about 75% are recurring, which together underpin a high-quality, defensive business model. Pawn loans are small, fully collateralized and non-recourse, operating under stable regulations, resulting in low credit losses and minimal regulatory risk. This model has proven resilient through economic cycles—for example, U.S. pawn loan balances grew roughly 50% during the last cyclical downturn (2007-2012). Key catalysts are also playing out: FirstCash continues to expand in Latin America amid favorable demographic tailwinds, and in August it entered the U.K. by acquiring H&T Group (286 stores), adding significant scale and geographic diversification. These strategic moves contributed to strong results, with earnings up 31% year-over-year, adjusted EBITDA up 19% and same-store pawn receivables up 13% in local currency. The company remains highly cash generative with a conservative, underleveraged balance sheet and low regulatory headwinds, reinforcing its ability to grow through cycles while delivering steady shareholder returns.
Aggregates producer Martin Marietta Materials was a top contributor for the period. Strong results were driven by continued pricing strength in aggregates—reflected in a 7.4% year-over-year increase in average selling price—and management’s decision to raise full-year guidance. The company continued its transition toward a higher-margin, aggregate-led model, exemplified by its decision to exit Texas cement operations through a recent asset exchange with Quikrete Holdings. With operations concentrated in structurally advantaged markets such as Texas and the Carolinas—regions benefiting from population growth, data center expansion, energy projects and semiconductor investment—Martin Marietta remains well-positioned for long-term demand. As the largest shipper of crushed stone by rail, the company has a scale-driven cost and distribution advantage that is difficult to replicate. In our view, consistent price increases, conservative capital allocation and focus on critical infrastructure end markets make Martin Marietta a resilient, long-duration holding.
Recent Portfolio Activity
| Buys | Sells |
|---|---|
| None | None |
Consistent with our long-term horizon and low turnover, there were no new purchases or sales completed during the quarter.
Conclusion
A core tenet of our investment philosophy is the commitment to understanding businesses with a long-term perspective. This discipline is especially critical during periods of heightened uncertainty, when macroeconomic events can dominate headlines. At Aristotle Capital, we believe one of the distinguishing strengths of our investment process is that we do not reactively reposition portfolios based on near-term developments. Instead, we maintain our focus on business fundamentals. We are convinced that it is fundamentals that ultimately drive long-term shareholder value. As such, we continue to attentively study what we believe are high-quality companies with sustainable competitive advantages poised to unlock value over full market cycles.
The opinions expressed herein are those of Aristotle Capital Management, LLC (Aristotle Capital) and are subject to change without notice. Past performance is not a guarantee or indicator of future results. This material is not financial advice or an offer to buy or sell any product. You should not assume that any of the securities transactions, sectors or holdings discussed in this report were or will be profitable, or that recommendations Aristotle Capital makes in the future will be profitable or equal the performance of the securities listed in this report. The portfolio characteristics shown relate to the Aristotle Global Equity Advisory strategy. Not every client’s account will have these characteristics. Aristotle Capital reserves the right to modify its current investment strategies and techniques based on changing market dynamics or client needs. There is no assurance that any securities discussed herein will remain in an account’s portfolio at the time you receive this report or that securities sold have not been repurchased. The securities discussed may not represent an account’s entire portfolio and, in the aggregate, may represent only a small percentage of an account’s portfolio holdings. The performance attribution presented is of a representative account from Aristotle Capital’s Global Equity WM Composite. The representative account is a discretionary client account which was chosen to most closely reflect the investment style of the strategy. The criteria used for representative account selection is based on the account’s period of time under management and its similarity of holdings in relation to the strategy. Recommendations made in the last 12 months are available upon request.
Returns are presented gross and net of model fees and include the reinvestment of all income. Gross returns will be reduced by fees and other expenses that may be incurred in the management of the account. Net returns are presented net of model fees. Net returns are calculated by subtracting a model fee of .50% on an annual basis or .04167% on a monthly basis, which includes trading costs and the reinvestment of all income.
All investments carry a certain degree of risk, including the possible loss of principal. Investments are also subject to political, market, currency and regulatory risks or economic developments. International investments involve special risks that may in particular cause a loss in principal, including currency fluctuation, lower liquidity, different accounting methods and economic and political systems, and higher transaction costs. These risks typically are greater in emerging markets. While Large-capitalization companies may have more stable prices than smaller, less established companies, they are still subject to equity securities risk. In addition, large-capitalization equity security prices may not rise as much as prices of equity securities of small-capitalization companies. Securities of small- and medium-sized companies tend to have a shorter history of operations and be more volatile and less liquid. Value stocks can perform differently from the market as a whole and other types of stocks. The material is provided for informational and/or educational purposes only and is not intended to be and should not be construed as investment, legal or tax advice and/or a legal opinion. Investors should consult their financial and tax adviser before making investments. The opinions referenced are as of the date of publication, may be modified due to changes in the market or economic conditions, and may not necessarily come to pass. Information and data presented has been developed internally and/or obtained from sources believed to be reliable. Aristotle Capital does not guarantee the accuracy, adequacy or completeness of such information.
Aristotle Capital Management, LLC is an independent investment adviser registered under the Investment Advisers Act of 1940, as amended. Registration does not imply a certain level of skill or training. More information about Aristotle Capital, including our investment strategies, fees and objectives, can be found in our Form ADV Part 2, which is available upon request. ACM-2510-113
Sources: CAPS CompositeHubTM, MSCI
Composite returns for all periods ended September 30, 2025 are preliminary pending final account reconciliation. MSCI ACWI (Net) was stated as the primary benchmark on June 1, 2024 and MSCI World (Net) became the secondary benchmark.
The Aristotle Global Equity WM Composite has an inception date of December 1, 2010. As of 1/1/2024, the composite was renamed from the Global Equity Advisory Composite.Past performance is not indicative of future results. The information provided should not be considered financial advice or a recommendation to purchase or sell any particular security or product. Performance results for periods greater than one year have been annualized.
Composite returns are presented pure gross and net of the maximum wrap fee and include the reinvestment of all income. Pure gross returns do not reflect the deduction of any trading costs or other fees and are supplemental to the net returns. Net returns are calculated by subtracting the highest applicable wrap/SMA fee, which includes trading costs and custodial fees, from the pure gross composite return. The highest applicable wrap/SMA fee is 2.00% on an annual basis, or 0.50% quarterly from inception to 12/31/2023 and 0.17% monthly from 1/1/2024 to present.
MSCI ACWI (Net) was stated as the primary benchmark on June 1, 2024 and MSCI World (Net) became the secondary benchmark. The MSCI ACWI captures large and mid-cap representation across 23 developed markets and 24 emerging markets countries. With approximately 2,500 constituents, the Index covers approximately 85% of the global investable equity opportunity set. The MSCI ACWI Equal Weighted Index represents an alternative weighting scheme to its market cap weighted parent index, MSCI ACWI. The Index includes the same constituents as its parent (large and mid-cap securities from 23 developed markets and 24 emerging markets countries. However, at each quarterly rebalance date, all index constituents are weighted equally, effectively removing the influence of each constituent’s current price (high or low). Between rebalances, index constituent weightings will fluctuate due to price performance. The MSCI World Index is a free float-adjusted market capitalization weighted index that is designed to measure the equity market performance of developed markets. The MSCI World Index consists of the following 23 developed market country indexes: Australia, Austria, Belgium, Canada, Denmark, Finland, France, Germany, Hong Kong, Ireland, Israel, Italy, Japan, Netherlands, New Zealand, Norway, Portugal, Singapore, Spain, Sweden, Switzerland, the United Kingdom and the United States. The MSCI Emerging Markets Index is a free float-adjusted market capitalization-weighted index that is designed to measure equity market performance of emerging markets. The MSCI Emerging Markets Index consists of the following 24 emerging market country indexes: Brazil, Chile, China, Colombia, Czech Republic, Egypt, Greece, Hungary, India, Indonesia, Korea, Kuwait, Malaysia, Mexico, Peru, Philippines, Poland, Qatar, Saudi Arabia, South Africa, Taiwan, Thailand, Turkey and United Arab Emirates. The MSCI ACWI Growth Index captures large and mid-cap securities exhibiting overall growth style characteristics across 23 developed markets countries and 24 emerging markets countries. The MSCI ACWI Value Index captures large and mid-cap securities exhibiting overall value style characteristics across 23 developed markets countries and 24 emerging markets countries. The MSCI Europe Index captures large and mid-cap representation across 15 developed markets countries in Europe. With approximately 400 constituents, the Index covers approximately 85% of the free float-adjusted market capitalization across the European developed markets equity universe. The MSCI Japan Index is designed to measure the performance of the large and mid-cap segments of the Japanese market. With approximately 200 constituents, the Index covers approximately 85% of the free float-adjusted market capitalization in Japan. The S&P 500® Index is the Standard & Poor’s Composite Index of 500 stocks and is a widely recognized, unmanaged index of common stock prices. The S&P 500 Equal Weight Index is designed to be the size-neutral version of the S&P 500. It includes the same constituents as the cap-weighted S&P 500, but each company in the S&P 500 Equal Weight Index is allocated the same weight at each quarterly rebalance. The Bloomberg Global Aggregate Bond Index is a flagship measure of global investment grade debt from 27 local currency markets. This multi-currency benchmark includes Treasury, government-related, corporate and securitized fixed rate bonds from both developed and emerging markets issuers. The Brent Crude Oil Index is a major trading classification of sweet light crude oil that serves as a major benchmark price for purchases of oil worldwide. The U.S. Consumer Price Index is a measure of the average change over time in the prices paid by urban consumers for a market basket of consumer goods and services. The volatility (beta) of the Composite may be greater or less than the benchmarks. It is not possible to invest directly in these indexes.