This site has been created for institutional investors and RIAs. An institutional investor is an entity that invests capital on behalf of others such as pension funds, banks, insurance companies, mutual funds, foundations/endowments, trust companies or other large investors and their investment consultants. RIA is a registered investment advisor who is responsible for allocating their client funds. This site is not intended for individual investor access, as it does not consider individual risk tolerances or investment objectives of an individual investor. Click “Accept and Continue” to affirm you meet the description of an Institutional Investor.
This site has been designed for financial intermediaries such as financial advisors, wealth managers, broker/dealers and home office research teams. This site is not intended for individual investor access, as it does not consider individual risk tolerances or investment objectives of an individual investor. Click “Accept and Continue” to affirm you meet the description of a Financial Advisor.
This area of the website contains information that is general and/or educational in nature. Individual investors should consider their own investment objectives and risk tolerances or consult with a financial advisor before making any investment decision. Click “Accept and Continue” to continue.
(All MSCI index returns are shown net and in U.S. dollars unless otherwise noted.)
Markets Review
Sources: CAPS CompositeHubTM, Bloomberg Past performance is not indicative of future results. Aristotle International Equity Composite returns are presented gross and net of investment advisory fees and include the reinvestment of all income. Gross returns will be reduced by fees and other expenses that may be incurred in the management of the account. Net returns are presented net of actual investment advisory fees and after the deduction of all trading expenses. Aristotle Capital Composite returns are preliminary pending final account reconciliation. Please see important disclosures at the end of this document.
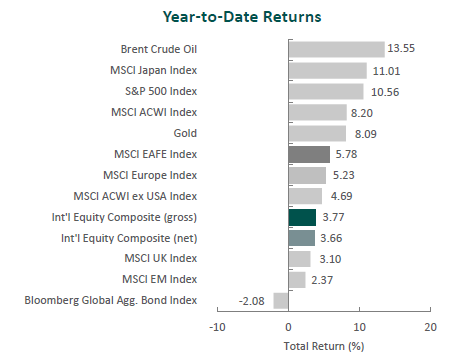
Global equity markets continued to climb during the first quarter. Overall, the MSCI ACWI Index rose 8.20% during the period. Concurrently, the Bloomberg Global Aggregate Bond Index fell 2.08%. In terms of style, value stocks underperformed their growth counterparts during the quarter, with the MSCI ACWI Value Index trailing the MSCI ACWI Growth Index by 2.65%.
The MSCI EAFE Index climbed 5.78% during the first quarter, while the MSCI ACWI ex USA Index increased 4.69%. Within the MSCI EAFE Index, Asia and Europe & Middle East were the strongest performers, while the U.K. gained the least. On a sector basis, eight of the eleven sectors within the MSCI EAFE Index posted positive returns, with Information Technology, Consumer Discretionary and Financials generating the largest gains. Conversely, Utilities, Consumer Staples and Materials declined.
Economic conditions varied by region, though most developed countries reported slowing inflation. For the month of February, both the U.K. and U.S. reported annual inflation descending toward the 3% mark, while the eurozone recorded an annual rate of 2.6%. As such, the respective central banks held monetary policy steady while signaling the possibility of rate cuts starting in June as the countries make progress toward the 2% target.
However, in Asia, Japan raised interest rates for the first time since 2007 to a range of 0.0% to 0.1%, as both inflation and wage growth have recently accelerated. This marked a historic shift and ended Japan’s period of negative rates, finally removing the world’s last remaining negative rates regime. Conversely, China lowered its five-year loan prime rate to bolster its faltering economy that is battling deflation and a troubled real estate sector.
In geopolitics, the conflict in the Middle East continued, with increased fighting in Lebanon and direct conflict in the Red Sea between the U.S. and Yemen’s Houthis, which have targeted more than two dozen ships traveling to and from the Suez Canal. The heightened activity in surrounding countries has sparked concerns of further regional escalation and the possibilty of a wider conflict. In Europe, Russia made small advances in Ukraine, including the capture of the city of Avdiivka, as Ukrainian troops struggle with supply shortages. The U.S. has recently partnered with countries such as South Korea and Turkey to provide additional ammunition and supplies to Ukraine.
Performance and Attribution Summary
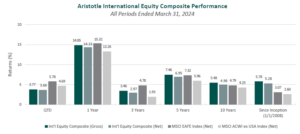
For the first quarter of 2024, Aristotle Capital’s International Equity Composite posted a total return of 3.77% gross of fees (3.66% net of fees), underperforming the MSCI EAFE Index, which returned 5.78%, and the MSCI ACWI ex USA Index, which returned 4.69%. Please refer to the table below for detailed performance.
Performance (%)
1Q24
1 Year
3 Years
5 Years
10 Years
Since Inception*
International Equity Composite (gross)
3.77
14.85
3.46
7.46
5.48
5.78
International Equity Composite (net)
3.66
14.33
2.97
6.95
4.98
5.28
MSCI EAFE Index (net)
5.78
15.32
4.78
7.32
4.79
3.07
MSCI ACWI ex USA Index (net)
4.69
13.26
1.93
5.96
4.25
2.60
*The inception date for the International Equity Composite is January 1, 2008. Past performance is not indicative of future results. Aristotle International Equity Composite returns are presented gross and net of investment advisory fees and include the reinvestment of all income. Gross returns will be reduced by fees and other expenses that may be incurred in the management of the account. Net returns are presented net of actual investment advisory fees and after the deduction of all trading expenses. Aristotle Capital Composite returns are preliminary pending final account reconciliation. Please see important disclosures at the end of this document.
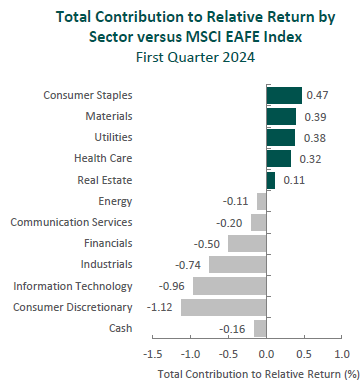
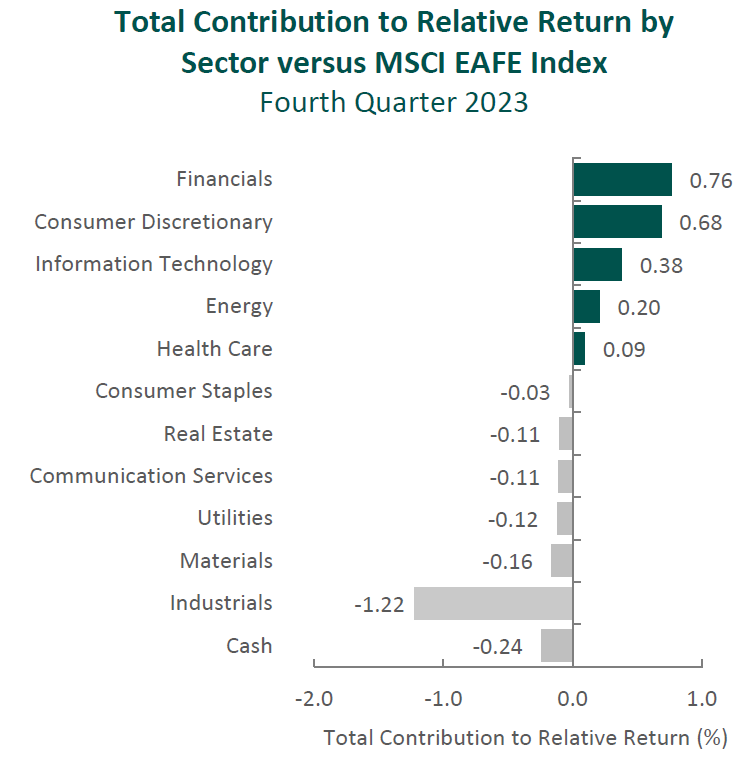
Source: FactSet Past performance is not indicative of future results. Attribution results are based on sector returns which are gross of investment advisory fees. Attribution is based on performance that is gross of investment advisory fees and includes the reinvestment of income.
From a sector perspective, the portfolio’s underperformance relative to the MSCI EAFE Index can be attributed to security selection, while allocation effects had a positive impact. Security selection in Consumer Discretionary, Information Technology and Industrials detracted the most from the portfolio’s relative performance. Conversely, security selection in Consumer Staples and Health Care and a lack of exposure to Utilities contributed to relative return.
Regionally, both security selection and allocation effects were responsible for the portfolio’s underperformance. Security selection in Asia and exposure to Canada detracted the most from relative performance, while security selection in the U.K. and Europe & Middle East contributed.
Contributors and Detractors for 1Q 2024
Relative Contributors
Relative Detractors
Safran
Daikin Industries
Munich Reinsurance
Sony
Nemetschek
AIA Group
Pan Pacific International
Accenture
GlaxoSmithKline
Magna International
Sony, the global provider of videogames and consoles, image sensors, music and movies, was one of the largest detractors for the period. Sony cut its guidance from 25 million PlayStation 5 (PS5) units sold to 21 million units for the fiscal year. Despite the underwhelming hardware results, management has emphasized the importance of balancing profitability and sales in the latter stage of the PS5’s life cycle which it expects to achieve through engagement, with monthly active users reaching a record high of 123 million accounts. Furthermore, we will continue to monitor management’s ability to improve game development, streamline project management and control costs, as Sony has already begun to implement structural reforms in its Game & Network Services segment. In its Pictures segment, Sony terminated its merger with Zee Entertainment, as closing conditions were not met within the set two-year window. Nevertheless, management believes India remains a promising market and will proactively explore opportunities to bolster its position in the country. We remain confident in Sony’s ability to build on its industry leadership, and we feel the company’s continued optimization of business operations, including its plan for a partial spinoff of its Financial Services business, positions the company to enhance long-term value.
AIA Group, a pan-Asian life insurance company headquartered in Hong Kong, was one of the largest detractors for the quarter.While macro concerns over the state of the Chinese economy may have placed pressure on AIA’s share price during the quarter, business fundamentals continue to improve. As evidence, the company’s VONB* increased 33% in 2023. This, in our opinion, reflects AIA’s resiliency and the progress it has made across Asia, with mainland China, Hong Kong and the ASEAN countries (excluding Vietnam) all reporting double-digit percentage increases. The company has also completed a multi-year digital transformation that has not only reduced costs per transaction by over 30% but has also improved customer experience. (85% of customer transactions are now completed in a day or less.) With these technological investments in place, the support of its highly productive agency sales force, and further partnerships with major banks, we remain confident in AIA’s ability to continue increasing its market share in mainland China and expanding across Asia.
*Value of New Business (VONB) is an insurance term for the present value of new business written during a period.
Safran, the French aerospace propulsion and equipment manufacturer, was the top contributor. As the leading supplier of narrow-body aircraft engines, Safran has benefited from the increase in narrow-body air traffic (above 2019 levels) and an aging fleet of aircraft that has spurred demand for required service. Part of our attraction to Safran is the nature of its product categories, which tend to exhibit pricing power, and the benefits of higher-margin aftermarket businesses, which we expect to expand in the years ahead. As an example, the company recently signed several multi-year equipment contracts with international airline customers. In addition, deliveries of Safran’s new-generation LEAP engines (which reduce fuel consumption and CO2 emissions) increased 38% in 2023, supporting the company’s proposed 63% year-over-year dividend increase. Longer term, we believe Safran will benefit from the continued transition to LEAP engines as airlines upgrade their fleets to be more efficient and environmentally friendly.
Munich Re, the world’s largest reinsurance company, was a leading contributor for the quarter. The company reported strong results as it continues to win market share, leverage its global scale and demonstrate underwriting discipline. Perhaps counterintuitively, recent global crises, such as war in both the Middle East and Ukraine and natural disaster losses that topped $100 billion, as well as the impact of inflation, showcase Munich Re’s strengths. Through these crises, the company has, we believe, displayed its prudent risk-taking and global diversification. Moreover, Munich Re (and its peers) have benefited from industry-wide price increases, which have contributed to increased return of capital to shareholders. The company raised its dividend by nearly 30% in 2023 and announced a new €1.5 billion share buyback program. We continue to believe Munich Re is attractively positioned to gain market share in a variety of areas, including cybersecurity, specialty insurance and in the fast-growing economies in Asia where the market is large, but insurance penetration remains relatively low.
Recent Portfolio Activity
Buys
Sells
None
None
Consistent with our long-term horizon and low turnover, there were no new purchases or sales completed during the quarter.
Conclusion
Despite the U.S. economy’s continued expansion, economic data points remain mixed. Additionally, investors face uncertainty the rest of the year, whether it be the path of central bank policy, the outcome of the 2024 U.S. presidential election, or the potential for new and/or escalating geopolitical conflicts.
However, while our analysis considers long-term developments in the macroeconomy, we focus most of our time and attention on individual companies that, in our opinion, possess a combination of qualities that are sustainable and difficult to reproduce. It is our belief that a diversified portfolio of investments in these companies will thrive over full market cycles.
Disclosures
The opinions expressed herein are those of Aristotle Capital Management, LLC (Aristotle Capital) and are subject to change without notice. Past performance is not a guarantee or indicator of future results. This material is not financial advice or an offer to buy or sell any product. You should not assume that any of the securities transactions, sectors or holdings discussed in this report were or will be profitable, or that recommendations Aristotle Capital makes in the future will be profitable or equal the performance of the securities listed in this report. The portfolio characteristics shown relate to the Aristotle International Equity strategy. Not every client’s account will have these characteristics. Aristotle Capital reserves the right to modify its current investment strategies and techniques based on changing market dynamics or client needs. There is no assurance that any securities discussed herein will remain in an account’s portfolio at the time you receive this report or that securities sold have not been repurchased. The securities discussed may not represent an account’s entire portfolio and, in the aggregate, may represent only a small percentage of an account’s portfolio holdings. The performance attribution presented is of a representative account from Aristotle Capital’s International Equity Composite. The representative account is a discretionary client account which was chosen to most closely reflect the investment style of the strategy. The criteria used for representative account selection is based on the account’s period of time under management and its similarity of holdings in relation to the strategy. Recommendations made in the last 12 months are available upon request.
Returns are presented gross and net of investment advisory fees and include the reinvestment of all income. Gross returns will be reduced by fees and other expenses that may be incurred in the management of the account. Net returns are presented net of actual investment advisory fees and after the deduction of all trading expenses.
All investments carry a certain degree of risk, including the possible loss of principal. Investments are also subject to political, market, currency and regulatory risks or economic developments. International investments involve special risks that may in particular cause a loss in principal, including currency fluctuation, lower liquidity, different accounting methods and economic and political systems, and higher transaction costs. These risks typically are greater in emerging markets. Securities of small‐ and medium‐sized companies tend to have a shorter history of operations, be more volatile and less liquid. Value stocks can perform differently from the market as a whole and other types of stocks.
The material is provided for informational and/or educational purposes only and is not intended to be and should not be construed as investment, legal or tax advice and/or a legal opinion. Investors should consult their financial and tax adviser before making investments. The opinions referenced are as of the date of publication, may be modified due to changes in the market or economic conditions, and may not necessarily come to pass. Information and data presented has been developed internally and/or obtained from sources believed to be reliable. Aristotle Capital does not guarantee the accuracy, adequacy or completeness of such information.
Aristotle Capital Management, LLC is an independent registered investment adviser under the Advisers Act of 1940, as amended. Registration does not imply a certain level of skill or training. More information about Aristotle Capital, including our investment strategies, fees and objectives, can be found in our Form ADV Part 2, which is available upon request. ACM-2404-37
Performance Disclosures
Sources: CAPS CompositeHubTM, MSCI
Composite returns for all periods ended March 31, 2024 are preliminary pending final account reconciliation.
Past performance is not indicative of future results. The information provided should not be considered financial advice or a recommendation to purchase or sell any particular security or product. Performance results for periods greater than one year have been annualized.
Returns are presented gross and net of investment advisory fees and include the reinvestment of all income. Gross returns will be reduced by fees and other expenses that may be incurred in the management of the account. Net returns are presented net of actual investment advisory fees and after the deduction of all trading expenses.
Index Disclosures
The MSCI EAFE Index (Europe, Australasia, Far East) is a free float-adjusted market capitalization-weighted index that is designed to measure the equity market performance of developed markets, excluding the United States and Canada. The MSCI EAFE Index consists of the following 21 developed market country indexes: Australia, Austria, Belgium, Denmark, Finland, France, Germany, Hong Kong, Ireland, Israel, Italy, Japan, the Netherlands, New Zealand, Norway, Portugal, Singapore, Spain, Sweden, Switzerland and the United Kingdom. The MSCI ACWI captures large and mid-cap representation across 23 developed market countries and 24 emerging markets countries. With approximately 3,000 constituents, the Index covers approximately 85% of the global investable equity opportunity set. The MSCI ACWI Growth Index captures large and mid-cap securities exhibiting overall growth style characteristics across 23 developed markets countries and 24 emerging markets countries. The MSCI ACWI Value Index captures large and mid-cap securities exhibiting overall value style characteristics across 23 developed markets countries and 24 emerging markets countries. The MSCI ACWI ex USA Index captures large and mid-cap representation across 22 of 23 developed markets countries (excluding the United States) and 24 emerging markets countries. With approximately 2,300 constituents, the Index covers approximately 85% of the global equity opportunity set outside the United States. The MSCI Emerging Markets Index is a free float-adjusted market capitalization-weighted index that is designed to measure the equity market performance of emerging markets. The MSCI Emerging Markets Index consists of the following 24 emerging market country indexes: Brazil, Chile, China, Colombia, Czech Republic, Egypt, Greece, Hungary, India, Indonesia, Korea, Kuwait, Malaysia, Mexico, Peru, Philippines, Poland, Qatar, Saudi Arabia, South Africa, Taiwan, Thailand, Turkey and United Arab Emirates. The S&P 500® Index is the Standard & Poor’s Composite Index of 500 stocks and is a widely recognized, unmanaged index of common stock prices. The Brent Crude Oil Index is a major trading classification of sweet light crude oil that serves as a major benchmark price for purchases of oil worldwide. The MSCI Japan Index is designed to measure the performance of the large and mid-cap segments of the Japanese market. With approximately 250 constituents, the Index covers approximately 85% of the free float-adjusted market capitalization in Japan. The Bloomberg Global Aggregate Bond Index is a flagship measure of global investment grade debt from 28 local currency markets. This multi-currency benchmark includes treasury, government-related, corporate and securitized fixed-rate bonds from both developed and emerging markets issuers. The MSCI United Kingdom Index is designed to measure the performance of the large and mid-cap segments of the U.K. market. With nearly 100 constituents, the Index covers approximately 85% of the free float-adjusted market capitalization in the United Kingdom. The MSCI Europe Index captures large and mid-cap representation across 15 developed markets countries in Europe. With approximately 430 constituents, the Index covers approximately 85% of the free float-adjusted market capitalization across the European developed markets equity universe. These indexes have been selected as the benchmarks and are used for comparison purposes only. The volatility (beta) of the Composite may be greater or less than the respective benchmarks. It is not possible to invest directly in these indexes.
The U.S. equity market rebounded, as the S&P 500 Index rose 11.69% during the period. Concurrently, the Bloomberg U.S. Aggregate Bond Index rallied, increasing 6.82% for the quarter. In terms of style, the Russell 1000 Value Index underperformed its growth counterpart by 4.66%.
Gains were broad-based, as ten out of the eleven sectors within the S&P 500 Index finished higher. Real Estate, Financials and Information Technology were the best-performing sectors. Meanwhile, Energy was the only sector to finish in the red, while Consumer Staples and Health Care gained the least.
Sources: CAPS CompositeHubTM, Bloomberg Past performance is not indicative of future results. Aristotle Atlantic Core Equity Composite returns are presented gross and net of investment advisory fees and include the reinvestment of all income. Gross returns will be reduced by fees and other expenses that may be incurred in the management of the account. Net returns are presented net of actual investment advisory fees and after the deduction of all trading expenses. Aristotle Atlantic Composite returns are preliminary pending final account reconciliation. Please see important disclosures at the end of this document.
Data released during the period showed that the U.S. economy had accelerated in the third quarter, with real GDP rising at an annual rate of 4.9%—the fastest pace of growth in nearly two years. The robust results were driven by increases in consumer spending and inventory investment. Additionally, single-family housing starts rose 18% month-over-month in November, and the labor market remained tight with 3.7% unemployment. Meanwhile, inflation continued its downward trend, as the annual CPI fell from 3.7% in September to 3.1% in November. The drop was primarily driven by softening energy prices, as both WTI and Brent fell below $80 a barrel. These developments combined to send longer-term interest rates lower, with the 10-year U.S. Treasury yield falling over 70 basis points during the quarter to finish at 3.88%.
As a result of easing inflation, combined with potentially slowing economic activity and a strong but moderating job market, the Federal Reserve (Fed) held the benchmark federal funds rate steady during the quarter. Chair Jerome Powell stated that the central bank’s policy rate is likely at or near its peak for the current tightening cycle, while the Federal Open Market Committee members’ median estimates indicate three quarter-point cuts in 2024.
On the corporate earnings front, results were strong, as 82% of S&P 500 companies exceeded EPS estimates, leading to 4.7% growth in earnings for the Index. Looking forward, analysts expect earnings to accelerate in 2024, with growth of 11.5% year-over-year.
Lastly, in U.S. politics, after backing a bipartisan stopgap funding bill to stave off a partial government shutdown, Congressman Kevin McCarthy was removed as speaker of the United States House of Representatives. This marked the first time in American history that a speaker of the House was ousted through a motion to vacate. Subsequently, Congressman Mike Johnson was elected as McCarthy’s replacement.
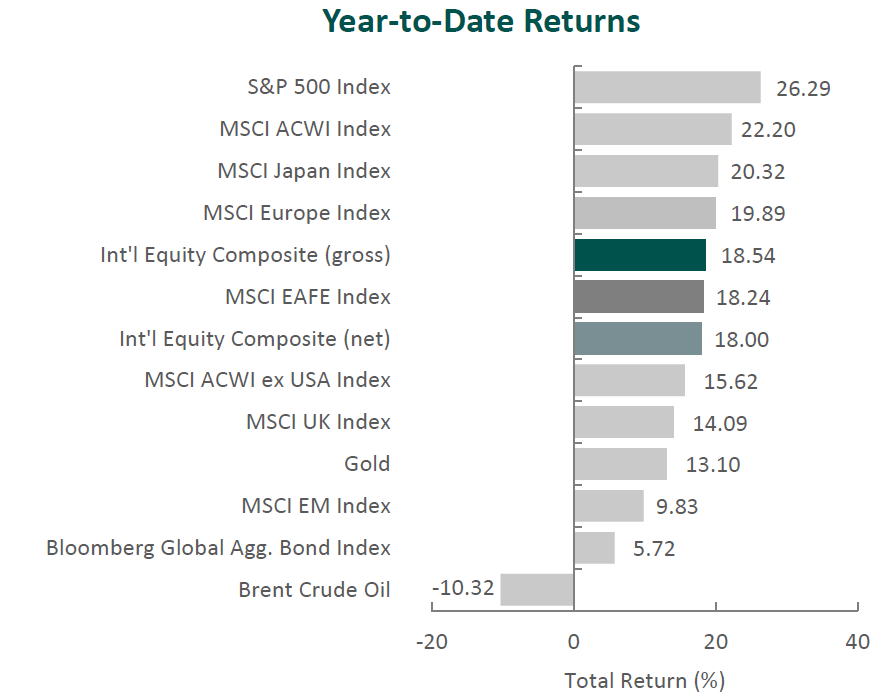
Annual Markets Review
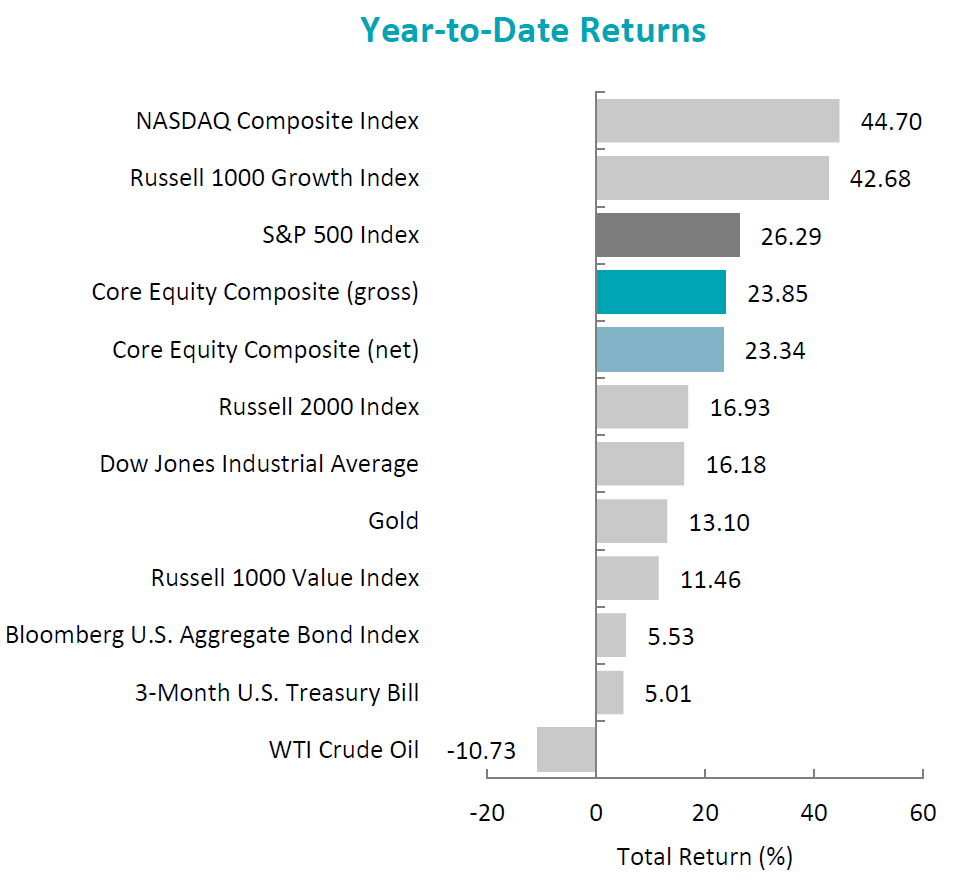
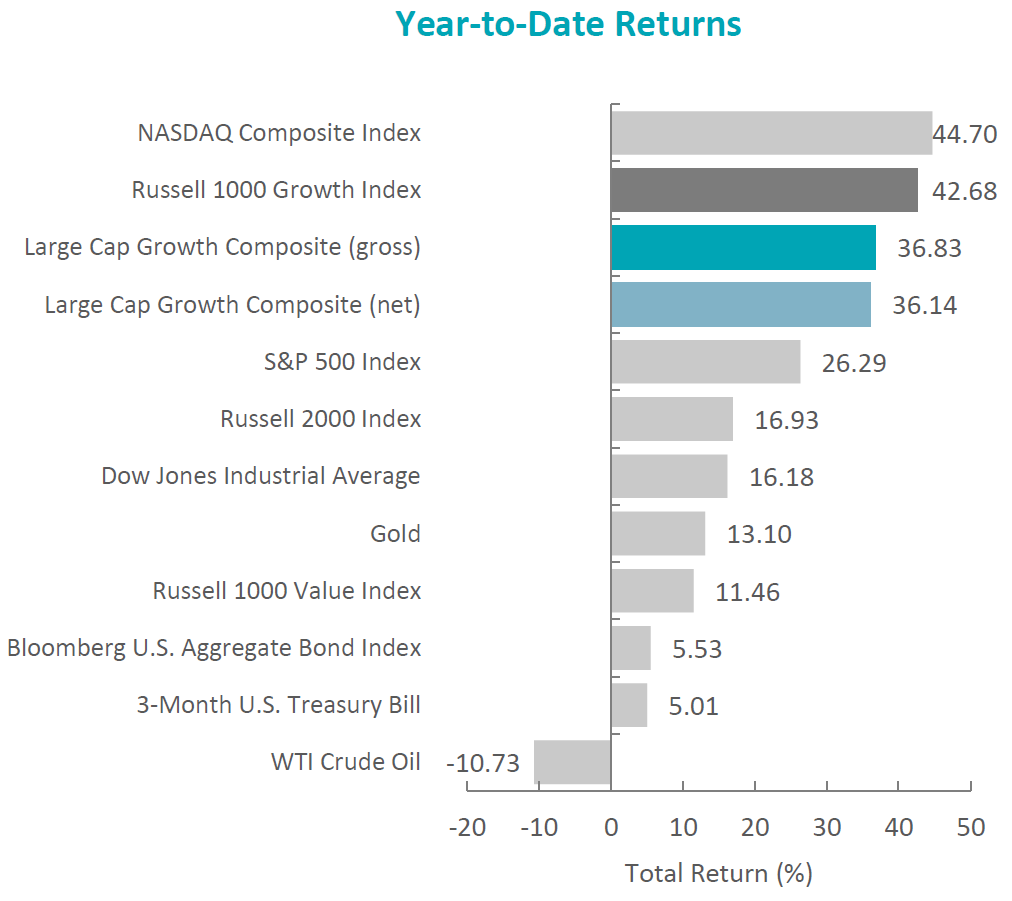
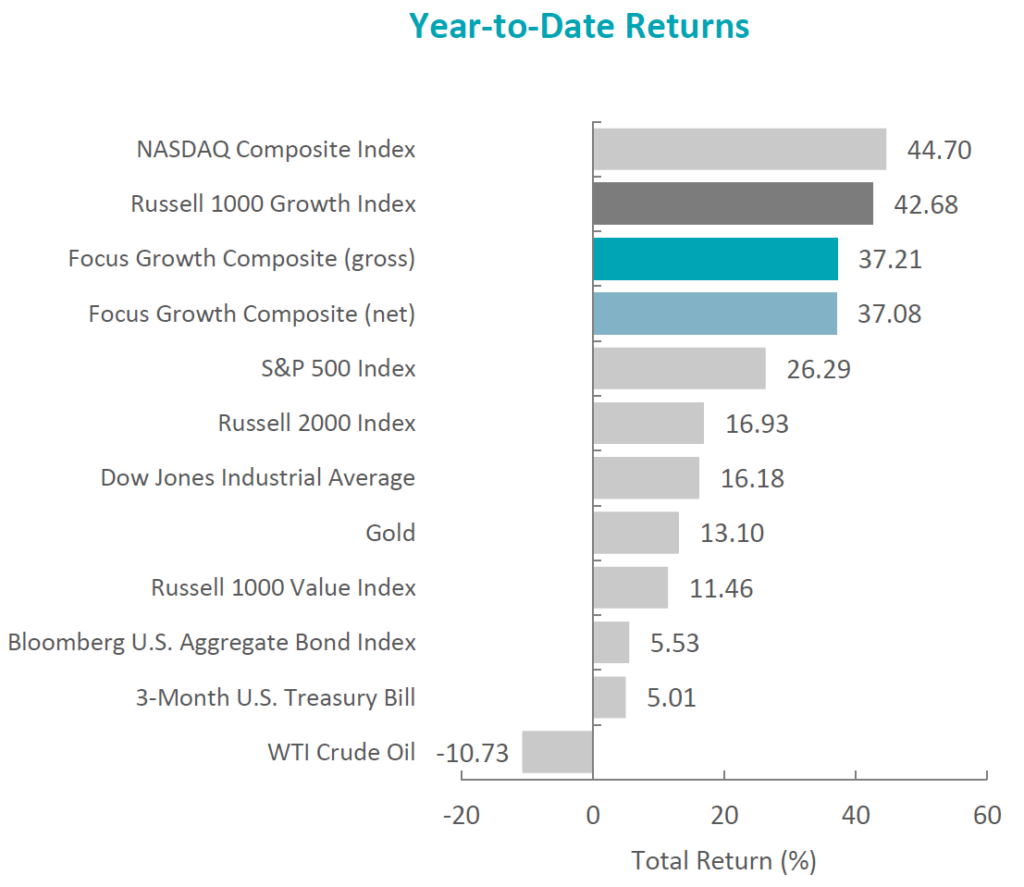
After a tumultuous year in 2022, the U.S. equity market rallied in 2023, as the S&P 500 Index posted a full-year return of 26.29%. The increase was primarily driven by the performance of the seven largest companies in the Index, which were responsible for 62% of the S&P 500’s gains. Additionally, after underperforming value last year by the largest amount since 2000, growth recovered, as the Russell 1000 Growth Index outperformed the Russell 1000 Value Index by 31.22% for the year. Meanwhile, the fixed income market also rebounded, as the Bloomberg U.S. Aggregate Bond Index rose 5.53% in 2023.
Macroeconomic news was dominated by inflation, central bank policies, regional bank failures and geopolitical conflicts, while other topics, such as artificial intelligence and congressional politics, made headlines as well. Economic data points were mixed throughout the year, and corporate earnings were just as unpredictable.
Performance and Attribution Summary
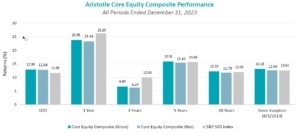
For the fourth quarter of 2023, Aristotle Atlantic’s Core Equity Composite posted a total return of 12.95% gross of fees (12.84% net of fees), outperforming the S&P 500 Index, which recorded a total return of 11.69%.
Performance (%)
4Q23
1 Year
3 Years
5 Years
10 Years
Since Inception*
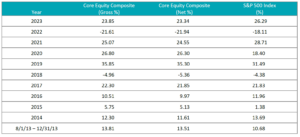
Core Equity Composite (gross)
12.95
23.85
6.69
15.91
12.30
13.18
Core Equity Composite (net)
12.84
23.34
6.24
15.43
11.79
12.66
S&P 500 Index
11.69
26.29
10.00
15.68
12.03
12.61
*The Core Equity Composite has an inception date of August 1, 2013. Past performance is not indicative of future results. Aristotle Atlantic Core Equity Composite returns are presented gross and net of investment advisory fees and include the reinvestment of all income. Gross returns will be reduced by fees and other expenses that may be incurred in the management of the account. Net returns are presented net of actual investment advisory fees and after the deduction of all trading expenses. Aristotle Atlantic Composite returns are preliminary pending final account reconciliation. Please see important disclosures at the end of this document.
Source: FactSet Past performance is not indicative of future results. Attribution results are based on sector returns which are gross of investment advisory fees. Attribution is based on performance that is gross of investment advisory fees and includes the reinvestment of income. Please see important disclosures at the end of this document.
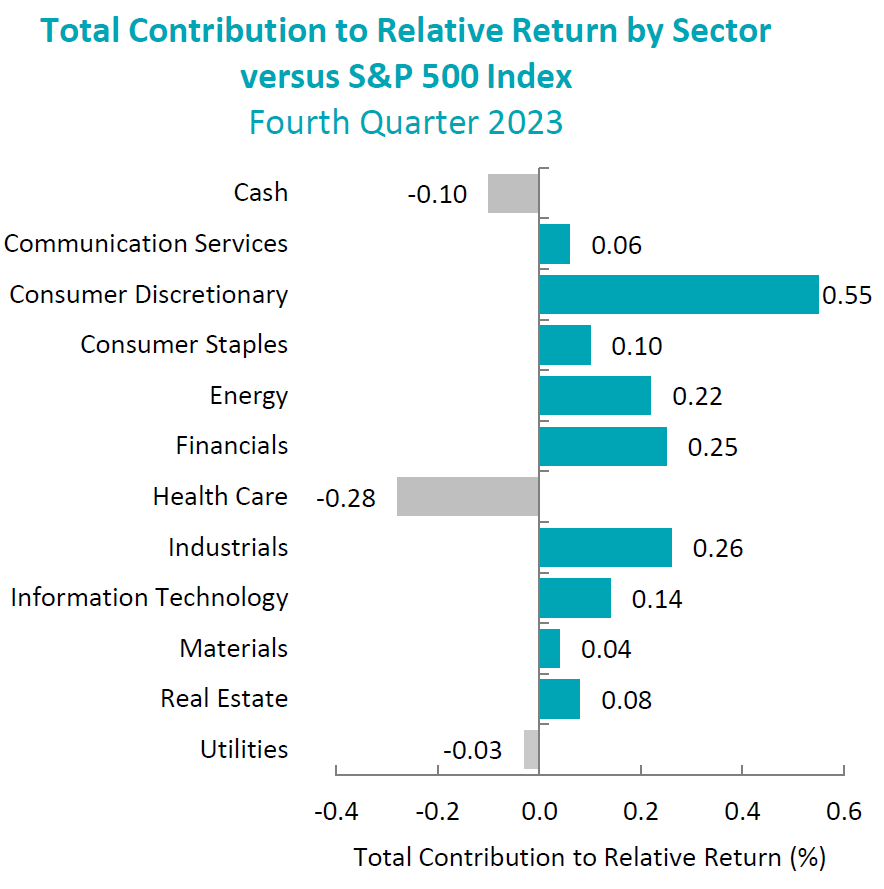
During the fourth quarter, the portfolio’s outperformance relative to the S&P 500 Index was due to both security selection and allocation effects. Security selection in Consumer Discretionary and Financials, as well as an underweight in Energy, contributed the most to relative performance. Conversely, security selection and an overweight in Health Care, as well as security selection in Energy, detracted from relative performance.
Contributors and Detractors for 4Q 2023
Relative Contributors
Relative Detractors
Broadcom
Halliburton
Spirit AeroSystems
Becton, Dickinson & Company
Expedia
Chart Industries
ServiceNow
Darling Ingredients
Teleflex
Antero Resources
Contributors
Broadcom
Broadcom contributed to portfolio outperformance during the quarter, as the company reported fourth quarter results which continued to show strength in its AI business segments. With the VMware acquisition having closed at the end of November, the company also provided positive fiscal year 2024 guidance on its earnings call that included synergy target goals ahead of schedule and a more positive revenue ramp for the combined businesses.
Spirit AeroSystems
Spirit AeroSystems contributed to portfolio outperformance in the fourth quarter. The company replaced the CEO, following a series of manufacturing incidents which resulted in delays in deliveries of fuselages. Additionally, Spirit also came to an agreement with Boeing regarding pricing for the troubled 787 program, which previously was unprofitable. The company also issued equity, which we believe will improve the company’s balance sheet.
Detractors
Haliburton
Halliburton detracted from portfolio performance, as shares were weak in the fourth quarter due to lower global commodity prices amid concerns about excess oil and natural gas supply levels resulting from slowing global economic activity.
Becton, Dickinson & Company
Becton Dickinson & Company detracted from portfolio performance in the quarter, as the company announced lower-than-expected guidance for fiscal year 2024. The weaker guidance was mainly driven by adverse moves in foreign exchange markets; however, the guidance seemed to surprise investors, even though we believe the underlying business trends remain solid.
Recent Portfolio Activity
The table below shows all buys and sells completed during the quarter, followed by a brief rationale.
Buys
Sells
Eli Lilly
Bristol-Myers
Vertex Pharmaceuticals
PepsiCo
Buys
Eli Lilly & Company
Eli Lilly & Company is a leading pharmaceutical company that develops diabetes, oncology, immunology and neuroscience medicines. The company generates over half of its revenue in the U.S. from its top-selling drugs Trulicity, Verzenio and Taltz. The company operates in a single business segment, Human pharmaceutical products.
Eli Lilly has a deep pipeline in treatment areas focused on metabolic disorders, oncology, immunology and central nervous system disorders. Currently, there are two phase three assets, Orforglipron, an oral GLP-1 and retatrutide, a triple incretin agonist, which have the potential to expand upon the potential success of Mounjaro. We believe that Mounjaro has the potential to commercialize beyond type 2 diabetes and obesity, potentially in the areas mentioned above of heart disease, sleep apnea, fatty liver disease and chronic kidney disease. We belief the premium valuation is supported by this outsized growth profile.
Vertex Pharmaceuticals
Vertex Pharmaceuticals develops drugs for treating cystic fibrosis, cancer, inflammatory bowel, autoimmune disease and neurological disorders. The biotechnology company has four commercial drugs used to treat cystic fibrosis. Vertex has other drugs in development, including additional cystic fibrosis treatments and medications addressing sickle cell disease, beta thalassemia, alpha-1 antitrypsin deficiency and pain.
Vertex is the global leader in treating cystic fibrosis and has additionally built a robust pipeline in several therapeutic areas. Late-stage studies in acute and neuropathic pain are expected to be another catalyst for the company. We believe Vertex’s valuation is attractive and at a discount relative to their 5-year historical average. Additionally, the company is well capitalized, with roughly $12.5 billion in net cash on its balance sheet.
Sells
Bristol-Myers
We sold our position in Bristol-Myers, following the third quarter earnings report where the company reduced the medium-term guidance on the new product portfolio and lowered its 2025 target. Given the large amount of revenue associated with drugs going off-patent, the new product portfolio was key to the company’s ability to change investor perception. Certain launches are not performing as expected, and others are taking longer to scale. Additionally, Bristol-Myers reduced medium-term operating margin guidance to invest in its commercial drugs and the research and development (R&D) pipeline. We do not believe that the company exhibited the level of defensiveness in the strategy we expected given the low valuation.
PepsiCo
We sold PepsiCo based on our belief that the inflation and interest rate cycle has peaked, and the company may have difficulty maintaining the recent organic growth trends which were driven mainly by price increases. Furthermore, the market appears to be shifting away from defensive names and into a more cyclical positioning which could cause PepsiCo to lag.
Outlook
Major equity markets in the fourth quarter were positively impacted by a sharp decline in interest rates. The move in interest rates reflects the view that the tightening cycle implemented by the Fed to curb inflation may have run its course. Expectations for 2024 include rate reductions by the Fed and a high single-digit increase in S&P 500 earnings. Along with this positive view, we also expect a broadening of performance relative to the AI-focused returns in 2023. The sizable move in equity markets in the fourth quarter has left equity valuations at the upper end of historical levels, which could limit the upside, absent positive earnings revisions. The increased geopolitical tensions and a pending U.S. Presidential election may also weigh on markets in 2024. Our focus will continue to be at the company level, with an emphasis on seeking to invest in companies with secular tailwinds or strong product-driven cycles.
Disclosures
The opinions expressed herein are those of Aristotle Atlantic Partners, LLC (Aristotle Atlantic) and are subject to change without notice. Past performance is not a guarantee or indicator of future results. This material is not financial advice or an offer to purchase or sell any product. You should not assume that any of the securities transactions, sectors or holdings discussed in this report were or will be profitable, or that recommendations Aristotle Atlantic makes in the future will be profitable or equal the performance of the securities listed in this report. The portfolio characteristics shown relate to the Aristotle Atlantic Core Equity strategy. Not every client’s account will have these characteristics. Aristotle Atlantic reserves the right to modify its current investment strategies and techniques based on changing market dynamics or client needs. There is no assurance that any securities discussed herein will remain in an account’s portfolio at the time you receive this report or that securities sold have not been repurchased. The securities discussed may not represent an account’s entire portfolio and, in the aggregate, may represent only a small percentage of an account’s portfolio holdings. The performance attribution presented is of a representative account from Aristotle Atlantic’s Core Equity Composite. The representative account is a discretionary client account which was chosen to most closely reflect the investment style of the strategy. The criteria used for representative account selection is based on the account’s period of time under management and its similarity of holdings in relation to the strategy. Recommendations made in the last 12 months are available upon request.
Returns are presented gross and net of investment advisory fees and include the reinvestment of all income. Gross returns will be reduced by fees and other expenses that may be incurred in the management of the account. Net returns are presented net of actual investment advisory fees and after the deduction of all trading expenses.
All investments carry a certain degree of risk, including the possible loss of principal. Investments are also subject to political, market, currency and regulatory risks or economic developments. International investments involve special risks that may in particular cause a loss in principal, including currency fluctuation, lower liquidity, different accounting methods and economic and political systems, and higher transaction costs. These risks typically are greater in emerging markets. Securities of small‐ and medium‐sized companies tend to have a shorter history of operations, be more volatile and less liquid. Value stocks can perform differently from the market as a whole and other types of stocks.
The material is provided for informational and/or educational purposes only and is not intended to be and should not be construed as investment, legal or tax advice and/or a legal opinion. Investors should consult their financial and tax adviser before making investments. The opinions referenced are as of the date of publication, may be modified due to changes in the market or economic conditions, and may not necessarily come to pass. Information and data presented has been developed internally and/or obtained from sources believed to be reliable. Aristotle Atlantic does not guarantee the accuracy, adequacy or completeness of such information.
Aristotle Atlantic Partners, LLC is an independent registered investment adviser under the Advisers Act of 1940, as amended. Registration does not imply a certain level of skill or training. More information about Aristotle Atlantic, including our investment strategies, fees and objectives, can be found in our Form ADV Part 2, which is available upon request. AAP-2401-30
Performance Disclosures
Sources: CAPS Composite Hub, Russell Investments
Composite returns for all periods ended December 31, 2023 are preliminary pending final account reconciliation.
The Aristotle Core Equity Composite has an inception date of August 1, 2013 at a predecessor firm. During this time, Mr. Fitzpatrick had primary responsibility for managing the strategy. Performance starting November 1, 2016 was achieved at Aristotle Atlantic.
Past performance is not indicative of future results. Performance results for periods greater than one year have been annualized. Returns are presented gross and net of investment advisory fees and include the reinvestment of all income. Gross returns will be reduced by fees and other expenses that may be incurred in the management of the account. Net returns are presented net of actual investment advisory fees and after the deduction of all trading expenses.
Index Disclosures
The Russell 1000® Growth Index measures the performance of the large cap growth segment of the U.S. equity universe. It includes those Russell 1000 companies with higher price-to-book ratios and higher forecasted growth values. This index has been selected as the benchmark and is used for comparison purposes only. The Russell 1000® Value Index measures the performance of the large cap value segment of the U.S. equity universe. It includes those Russell 1000 companies with lower price-to-book ratios and lower expected growth values. The S&P 500® Index is the Standard & Poor’s Composite Index of 500 stocks and is a widely recognized, unmanaged index of common stock prices. The Dow Jones Industrial Average® is a price-weighted measure of 30 U.S. blue-chip companies. The Index covers all industries except transportation and utilities. The NASDAQ Composite Index measures all NASDAQ domestic and international based common type stocks listed on The NASDAQ Stock Market. The NASDAQ Composite includes over 3,000 companies, more than most other stock market indices. The Bloomberg U.S. Aggregate Bond Index is an unmanaged index of domestic investment grade bonds, including corporate, government and mortgage-backed securities. The WTI Crude Oil Index is a major trading classification of sweet light crude oil that serves as a major benchmark price for oil consumed in the United States. The Brent Crude Oil Index is a major trading classification of sweet light crude oil that serves as a major benchmark price for purchases of oil worldwide. The 3-Month U.S. Treasury Bill is a short-term debt obligation backed by the U.S. Treasury Department with a maturity of three months. The Consumer Price Index (CPI) is a measure of the average change over time in the prices paid by urban consumers for a market basket of consumer goods and services. While stock selection is not governed by quantitative rules, a stock typically is added only if the company has an excellent reputation, demonstrates sustained growth and is of interest to a large number of investors. The volatility (beta) of the Composite may be greater or less than its respective benchmarks. It is not possible to invest directly in these indices.
The U.S. equity market rebounded, as the S&P 500 Index rose 11.69% during the period. Concurrently, the Bloomberg U.S. Aggregate Bond Index rallied, increasing 6.82% for the quarter. In terms of style, the Russell 1000 Value Index underperformed its growth counterpart by 4.66%.
Sources: CAPS CompositeHubTM, Bloomberg Past performance is not indicative of future results. Aristotle Atlantic Large Cap Growth Composite returns are presented gross and net of investment advisory fees and include the reinvestment of all income. Gross returns will be reduced by fees and other expenses that may be incurred in the management of the account. Net returns are presented net of actual investment advisory fees and after the deduction of all trading expenses. Aristotle Atlantic Composite returns are preliminary pending final account reconciliation. Please see important disclosures at the end of this document.
Gains were broad-based, as ten out of the eleven sectors within the Russell 1000 Growth Index finished higher. Real Estate, Utilities and Information Technology were the best-performing sectors. Meanwhile, Energy was the only sector to finish in the red, while Consumer Staples and Health Care gained the least.
Data released during the period showed that the U.S. economy had accelerated in the third quarter, with real GDP rising at an annual rate of 4.9%—the fastest pace of growth in nearly two years. The robust results were driven by increases in consumer spending and inventory investment. Additionally, single-family housing starts rose 18% month-over-month in November, and the labor market remained tight with 3.7% unemployment. Meanwhile, inflation continued its downward trend, as the annual CPI fell from 3.7% in September to 3.1% in November. The drop was primarily driven by softening energy prices, as both WTI and Brent fell below $80 a barrel. These developments combined to send longer-term interest rates lower, with the 10-year U.S. Treasury yield falling over 70 basis points during the quarter to finish at 3.88%.
As a result of easing inflation, combined with potentially slowing economic activity and a strong but moderating job market, the Federal Reserve (Fed) held the benchmark federal funds rate steady during the quarter. Chair Jerome Powell stated that the central bank’s policy rate is likely at or near its peak for the current tightening cycle, while the Federal Open Market Committee members’ median estimates indicate three quarter-point cuts in 2024.
On the corporate earnings front, results were strong, as 82% of S&P 500 companies exceeded EPS estimates, leading to 4.7% growth in earnings for the Index. Looking forward, analysts expect earnings to accelerate in 2024, with growth of 11.5% year-over-year.
Lastly, in U.S. politics, after backing a bipartisan stopgap funding bill to stave off a partial government shutdown, Congressman Kevin McCarthy was removed as speaker of the United States House of Representatives. This marked the first time in American history that a speaker of the House was ousted through a motion to vacate. Subsequently, Congressman Mike Johnson was elected as McCarthy’s replacement.
Annual Markets Review
After a tumultuous year in 2022, the U.S. equity market rallied in 2023, as the S&P 500 Index posted a full-year return of 26.29%. The increase was primarily driven by the performance of the seven largest companies in the Index, which were responsible for 62% of the S&P 500’s gains. Additionally, after underperforming value last year by the largest amount since 2000, growth recovered, as the Russell 1000 Growth Index outperformed the Russell 1000 Value Index by 31.22% for the year. Meanwhile, the fixed income market also rebounded, as the Bloomberg U.S. Aggregate Bond Index rose 5.53% in 2023.
Macroeconomic news was dominated by inflation, central bank policies, regional bank failures and geopolitical conflicts, while other topics, such as artificial intelligence and congressional politics, made headlines as well. Economic data points were mixed throughout the year, and corporate earnings were just as unpredictable.
Performance and Attribution Summary
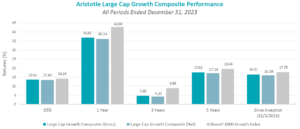
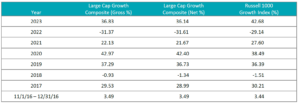
For the fourth quarter of 2023, Aristotle Atlantic’s Large Cap Growth Composite posted a total return of 13.61% gross of fees (13.43% net of fees), underperforming the 14.16% return of the Russell 1000 Growth Index.
Performance (%)
4Q23
1 Year
3 Years
5 Years
Since Inception*
Large Cap Growth Composite (gross)
13.61
36.83
4.68
17.62
16.51
Large Cap Growth Composite (net)
13.43
36.14
4.24
17.14
16.04
Russell 1000 Growth Index
14.16
42.68
8.86
19.49
17.78
*The Large Cap Growth Composite has an inception date of November 1, 2016. Past performance is not indicative of future results. Aristotle Atlantic Large Cap Growth Equity Composite returns are presented gross and net of investment advisory fees and include the reinvestment of all income. Gross returns will be reduced by fees and other expenses that may be incurred in the management of the account. Net returns are presented net of actual investment advisory fees and after the deduction of all trading expenses. Aristotle Atlantic Composite returns are preliminary pending final account reconciliation. Please see important disclosures at the end of this document.
Sources: FactSet Past performance is not indicative of future results. Attribution results are based on sector returns which are gross of investment advisory fees. Attribution is based on performance that is gross of investment advisory fees and includes the reinvestment of income. Please see important disclosures at the end of this document.
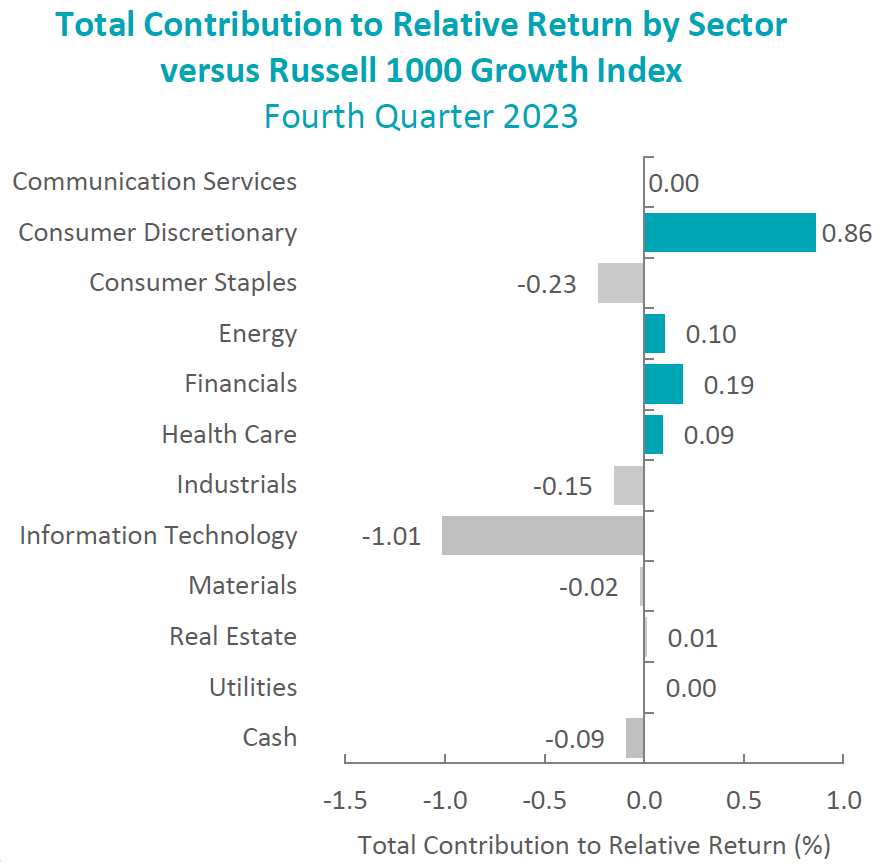
During the fourth quarter, the portfolio’s underperformance relative to the Russell 1000 Growth Index was due to both security selection and allocation effects. Security selection in Information Technology, Consumer Staples and Industrials detracted the most from relative performance. Conversely, security selection in Consumer Discretionary, Financials and Health Care contributed to relative returns.
Contributors and Detractors for 4Q 2023
Relative Contributors
Relative Detractors
Expedia
Chart Industries
Tesla
Darling Ingredients
DexCom
ON Semiconductors
ServiceNow
Adaptive Biotechnologies
KLA
Tenable Holdings
Contributors
Expedia
Expedia contributed to portfolio performance in the fourth quarter. The company reported strong third quarter earnings in early November. The company has also completed its multi-year technology platform migrations, which have been a drag on growth and profit margin. The company also announced a $5 billion share buyback program.
Tesla
Tesla contributed to portfolio performance in the fourth quarter due to our underweight position relative to the growth index. Tesla reported disappointing third quarter earnings in mid-October in part, due to downtime at some factories that were being upgraded. The CEO expressed concern that higher interest rates were impacting demand for automobiles and would not comment on growth expectations for 2024. However, the expected scale production of the Cybertruck is 12 to 18 months in the future which we believe will negatively impact short-term growth.
Detractors
Chart Industries
Chart Industries detracted from portfolio performance in the fourth quarter. The company reported disappointing third quarter earnings and revenue in late October. According to company management, the shortfall was due to the timing of the deliveries of some projects that were delayed into the fourth quarter of 2023 and into 2024. On a positive note, initial earnings and revenue guidance for 2024 EPS were disclosed on the October earnings call, which was significantly above analyst consensus. This guidance was reaffirmed at the company’s investor day in December.
Darling Ingredients
Darling Ingredients detracted from portfolio performance in the quarter, as shares were weak following a lower-than-expected earnings report and a reduction in annual guidance. The reduction was largely driven by lower margins in their Diamond Green Diesel renewable diesel joint venture due to lower renewable identification numbers (RINs) and lower soybean oil prices. We believe these issues should prove to be short-term headwinds, as margins normalize in the coming quarters.
Recent Portfolio Activity
The table below shows all buys and sells completed during the quarter, followed by a brief rationale.
Buys
Sells
Datadog
Enphase Energy
Tenable Holdings
Buys
Datadog
Datadog is the observability and security platform for cloud applications. The company’s SaaS platform integrates and automates infrastructure monitoring, application performance monitoring, log management, real-user monitoring, and many other capabilities to provide unified, real-time observability and security for its customers’ entire technology stack. The platform is used by organizations of all sizes and across a wide range of industries to enable digital transformation and cloud migration, drive collaboration among development, operations, security and business teams, accelerate time to market for applications, reduce time to problem resolution, secure applications and infrastructure, understand user behavior, and track key business metrics.
We believe headwinds from cloud spend optimizations are moderating, and the company should benefit from improved cloud spend dynamics in 2024-2025. We consider Datadog to be a key part of the Information Technology stack, as businesses expand on their digital transformation initiatives and continue to transition operations to the cloud. The company has been successful in customer acquisition growth and a strong financial profile with increased free cash flow margins.
Sells
Enphase Energy
We sold our position in Enphase due to slowing demand for residential solar energy, primarily driven by rising interest rates and potentially increasing competition. During the second quarter earnings report in July, the company lowered its guidance for the third quarter microinverter, and we believed there was a heightened risk that Enphase would lower guidance again. We remain optimistic about Enphase’s competitive advantages over the long term in the residential solar energy market, but we prefer to wait for more apparent evidence of a rebound before considering a reinvestment in the company.
Tenable Holdings
We sold Tenable, as we believe the company could see increasing pressure from larger cybersecurity providers with more extensive product platforms and more competitive pricing dynamics.
Outlook
Major equity markets in the fourth quarter were positively impacted by a sharp decline in interest rates. The move in interest rates reflects the view that the tightening cycle implemented by the Fed to curb inflation may have run its course. Expectations for 2024 include rate reductions by the Fed and a high single-digit increase in S&P 500 earnings. Along with this positive view, we also expect a broadening of performance relative to the AI-focused returns in 2023. The sizable move in equity markets in the fourth quarter has left equity valuations at the upper end of historical levels, which could limit the upside, absent positive earnings revisions. The increased geopolitical tensions and a pending U.S. Presidential election may also weigh on markets in 2024. Our focus will continue to be at the company level, with an emphasis on seeking to invest in companies with secular tailwinds or strong product-driven cycles.
Disclosures
The opinions expressed herein are those of Aristotle Atlantic Partners, LLC (Aristotle Atlantic) and are subject to change without notice. Past performance is not a guarantee or indicator of future results. This material is not financial advice or an offer to purchase or sell any product. You should not assume that any of the securities transactions, sectors or holdings discussed in this report were or will be profitable, or that recommendations Aristotle Atlantic makes in the future will be profitable or equal the performance of the securities listed in this report. The portfolio characteristics shown relate to the Aristotle Atlantic Large Cap Growth strategy. Not every client’s account will have these characteristics. Aristotle Atlantic reserves the right to modify its current investment strategies and techniques based on changing market dynamics or client needs. There is no assurance that any securities discussed herein will remain in an account’s portfolio at the time you receive this report or that securities sold have not been repurchased. The securities discussed may not represent an account’s entire portfolio and, in the aggregate, may represent only a small percentage of an account’s portfolio holdings. The performance attribution presented is of a representative account from Aristotle Atlantic’s Large Cap Growth Composite. The representative account is a discretionary client account which was chosen to most closely reflect the investment style of the strategy. The criteria used for representative account selection is based on the account’s period of time under management and its similarity of holdings in relation to the strategy. Recommendations made in the last 12 months are available upon request. Returns are presented gross and net of investment advisory fees and include the reinvestment of all income. Gross returns will be reduced by fees and other expenses that may be incurred in the management of the account. Net returns are presented net of actual investment advisory fees and after the deduction of all trading expenses.
All investments carry a certain degree of risk, including the possible loss of principal. Investments are also subject to political, market, currency and regulatory risks or economic developments. International investments involve special risks that may in particular cause a loss in principal, including currency fluctuation, lower liquidity, different accounting methods and economic and political systems, and higher transaction costs. These risks typically are greater in emerging markets. Securities of small‐ and medium‐sized companies tend to have a shorter history of operations, be more volatile and less liquid. Value stocks can perform differently from the market as a whole and other types of stocks.
The material is provided for informational and/or educational purposes only and is not intended to be and should not be construed as investment, legal or tax advice and/or a legal opinion. Investors should consult their financial and tax adviser before making investments. The opinions referenced are as of the date of publication, may be modified due to changes in the market or economic conditions, and may not necessarily come to pass. Information and data presented has been developed internally and/or obtained from sources believed to be reliable. Aristotle Atlantic does not guarantee the accuracy, adequacy or completeness of such information.
Aristotle Atlantic Partners, LLC is an independent registered investment adviser under the Advisers Act of 1940, as amended. Registration does not imply a certain level of skill or training. More information about Aristotle Atlantic, including our investment strategies, fees and objectives, can be found in our Form ADV Part 2, which is available upon request. AAP-2401-34
Performance Disclosure
Sources: CAPS CompositeHubTM, Russell Investments
Composite returns for all periods ended December 31, 2023 are preliminary pending final account reconciliation.
Past performance is not indicative of future results. Performance results for periods greater than one year have been annualized. Returns are presented gross and net of investment advisory fees and include the reinvestment of all income. Gross returns will be reduced by fees and other expenses that may be incurred in the management of the account. Net returns are presented net of actual investment advisory fees and after the deduction of all trading expenses.
Index Disclosure
The Russell 1000® Growth Index measures the performance of the large cap growth segment of the U.S. equity universe. It includes those Russell 1000 companies with higher price-to-book ratios and higher forecasted growth values. This index has been selected as the benchmark and is used for comparison purposes only. The Russell 1000® Value Index measures the performance of the large cap value segment of the U.S. equity universe. It includes those Russell 1000 companies with lower price-to-book ratios and lower expected growth values. The S&P 500® Index is the Standard & Poor’s Composite Index of 500 stocks and is a widely recognized, unmanaged index of common stock prices. The Dow Jones Industrial Average® is a price-weighted measure of 30 U.S. blue-chip companies. The Index covers all industries except transportation and utilities. The NASDAQ Composite Index measures all NASDAQ domestic and international based common type stocks listed on The NASDAQ Stock Market. The NASDAQ Composite includes over 3,000 companies, more than most other stock market indices. The Bloomberg U.S. Aggregate Bond Index is an unmanaged index of domestic investment grade bonds, including corporate, government and mortgage-backed securities. The WTI Crude Oil Index is a major trading classification of sweet light crude oil that serves as a major benchmark price for oil consumed in the United States. The Brent Crude Oil Index is a major trading classification of sweet light crude oil that serves as a major benchmark price for purchases of oil worldwide. The 3-Month U.S. Treasury Bill is a short-term debt obligation backed by the U.S. Treasury Department with a maturity of three months. The Consumer Price Index (CPI) is a measure of the average change over time in the prices paid by urban consumers for a market basket of consumer goods and services. While stock selection is not governed by quantitative rules, a stock typically is added only if the company has an excellent reputation, demonstrates sustained growth and is of interest to a large number of investors. The volatility (beta) of the Composite may be greater or less than its respective benchmarks. It is not possible to invest directly in these indices.
The U.S. equity market rebounded, as the S&P 500 Index rose 11.69% during the period. Concurrently, the Bloomberg U.S. Aggregate Bond Index rallied, increasing 6.82% for the quarter. In terms of style, the Russell 1000 Value Index underperformed its growth counterpart by 4.66%.
Sources: CAPS CompositeHubTM, Bloomberg Past performance is not indicative of future results. Aristotle Atlantic Focus Growth Composite returns are presented gross and net of investment advisory fees and include the reinvestment of all income. Gross returns will be reduced by fees and other expenses that may be incurred in the management of the account. Net returns are presented net of actual investment advisory fees and after the deduction of all trading expenses. Aristotle Atlantic Composite returns are preliminary pending final account reconciliation. Please see important disclosures at the end of this document.
Gains were broad-based, as ten out of the eleven sectors within the Russell 1000 Growth Index finished higher. Real Estate, Utilities and Information Technology were the best-performing sectors. Meanwhile, Energy was the only sector to finish in the red, while Consumer Staples and Health Care gained the least.
Data released during the period showed that the U.S. economy had accelerated in the third quarter, with real GDP rising at an annual rate of 4.9%—the fastest pace of growth in nearly two years. The robust results were driven by increases in consumer spending and inventory investment. Additionally, single-family housing starts rose 18% month-over-month in November, and the labor market remained tight with 3.7% unemployment. Meanwhile, inflation continued its downward trend, as the annual CPI fell from 3.7% in September to 3.1% in November. The drop was primarily driven by softening energy prices, as both WTI and Brent fell below $80 a barrel. These developments combined to send longer-term interest rates lower, with the 10-year U.S. Treasury yield falling over 70 basis points during the quarter to finish at 3.88%.
As a result of easing inflation, combined with potentially slowing economic activity and a strong but moderating job market, the Federal Reserve (Fed) held the benchmark federal funds rate steady during the quarter. Chair Jerome Powell stated that the central bank’s policy rate is likely at or near its peak for the current tightening cycle, while the Federal Open Market Committee members’ median estimates indicate three quarter-point cuts in 2024.
On the corporate earnings front, results were strong, as 82% of S&P 500 companies exceeded EPS estimates, leading to 4.7% growth in earnings for the Index. Looking forward, analysts expect earnings to accelerate in 2024, with growth of 11.5% year-over-year.
Lastly, in U.S. politics, after backing a bipartisan stopgap funding bill to stave off a partial government shutdown, Congressman Kevin McCarthy was removed as speaker of the United States House of Representatives. This marked the first time in American history that a speaker of the House was ousted through a motion to vacate. Subsequently, Congressman Mike Johnson was elected as McCarthy’s replacement.
Annual Markets Review
After a tumultuous year in 2022, the U.S. equity market rallied in 2023, as the S&P 500 Index posted a full-year return of 26.29%. The increase was primarily driven by the performance of the seven largest companies in the Index, which were responsible for 62% of the S&P 500’s gains. Additionally, after underperforming value last year by the largest amount since 2000, growth recovered, as the Russell 1000 Growth Index outperformed the Russell 1000 Value Index by 31.22% for the year. Meanwhile, the fixed income market also rebounded, as the Bloomberg U.S. Aggregate Bond Index rose 5.53% in 2023.
Macroeconomic news was dominated by inflation, central bank policies, regional bank failures and geopolitical conflicts, while other topics, such as artificial intelligence and congressional politics, made headlines as well. Economic data points were mixed throughout the year, and corporate earnings were just as unpredictable.
Performance and Attribution Summary
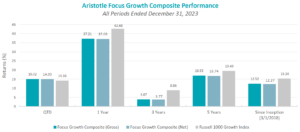
For the fourth quarter of 2023, Aristotle Atlantic’s Focus Growth Composite posted a total return of 15.02% gross of fees (14.99% net of fees), outperforming the 14.16% total return of the Russell 1000 Growth Index.
Performance (%)
4Q23
1 Year
3 Years
5 Years
Since Inception*
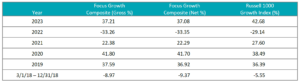
Focus Growth Composite (gross)
15.02
37.21
3.87
16.93
12.52
Focus Growth Composite (net)
14.99
37.08
3.77
16.74
12.27
Russell 1000 Growth Index
14.16
42.68
8.86
19.49
15.34
*The Focus Growth Composite has an inception date of March 1, 2018. Past performance is not indicative of future results. Aristotle Atlantic Focus Growth Composite returns are presented gross and net of investment advisory fees and include the reinvestment of all income. Gross returns will be reduced by fees and other expenses that may be incurred in the management of the account. Net returns are presented net of actual investment advisory fees and after the deduction of all trading expenses. Aristotle Atlantic Composite returns are preliminary pending final account reconciliation. Please see important disclosures at the end of this document.
Sources: FactSet Past performance is not indicative of future results. Attribution results are based on sector returns which are gross of investment advisory fees. Attribution is based on performance that is gross of investment advisory fees and includes the reinvestment of income. Please see important disclosures at the end of this document.
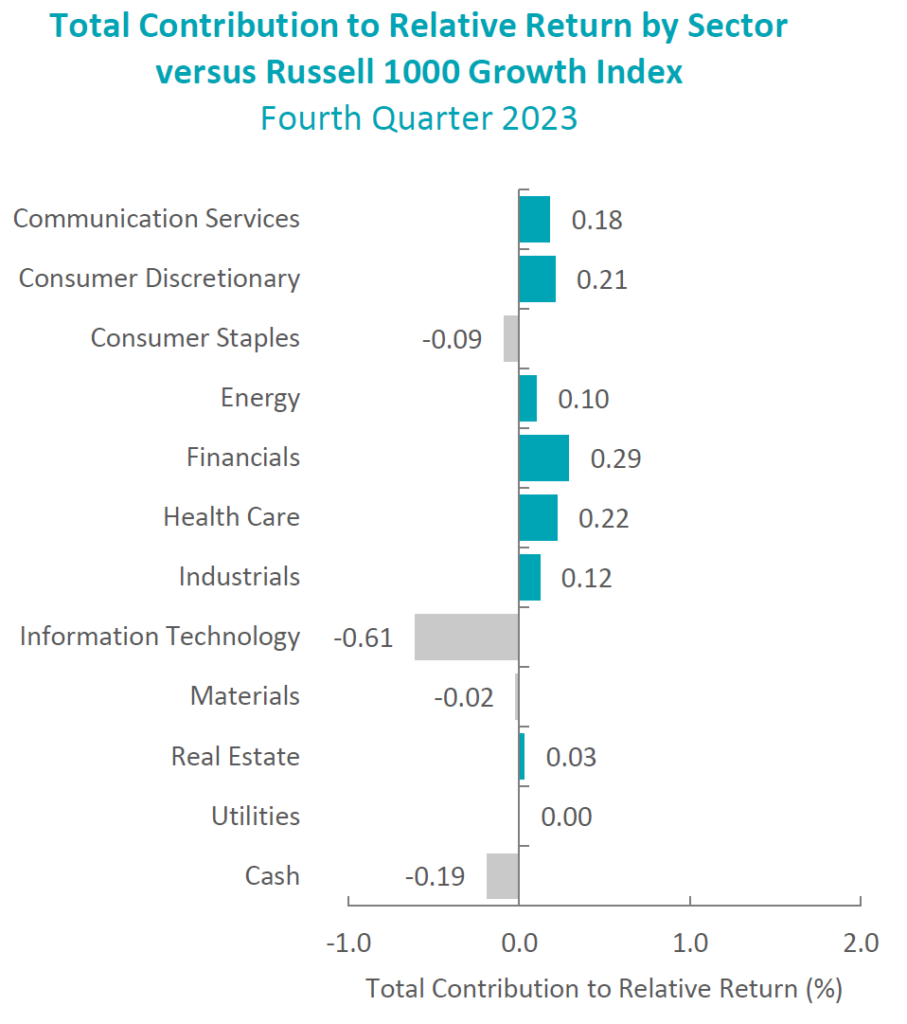
During the fourth quarter, the portfolio’s outperformance relative to the Russell 1000 Growth Index was due to both allocation effects and security selection. Security selection in Financials, Health Care and Consumer Discretionary contributed the most to performance. Conversely, security selection in Information Technology and Real Estate, as well as an overweight in Financials, detracted from relative results.
Contributors and Detractors for 4Q 2023
Relative Contributors
Relative Detractors
DexCom
Darling Ingredients
ServiceNow
Adaptive Biotechnologies
KLA
ON Semiconductor
S&P Global
Guardant Health
Netflix
Thermo Fisher Scientific
Contributors
DexCom
Dexcom contributed to portfolio performance during the quarter, following a better-than-expected earnings report and an increase in full-year guidance. The company is benefiting from a new product introduction with the G-7 series and new Medicare reimbursement for basal insulin users. Additionally, Dexcom has been under pressure most of 2023 on the success of GLP-1 companies and the fear that these novel weight loss therapies could hurt the prospects for companies operating in obesity-related comorbidities such as Diabetes. The shares had a broad reversal of this trend in the fourth quarter and many of the affected names rebounded, including Dexcom.
ServiceNow
ServiceNow contributed to portfolio performance during the fourth quarter, as investors focused on improving momentum across the NOW platform following strong third quarter results at the end of October. In addition, ServiceNow continues to announce new product enhancements to the platform to support artificial intelligence (AI) capabilities with early signs of customer adoption.
Detractors
Adaptive Biotechnologies
Adaptive Biotechnologies detracted from portfolio performance, following a lower-than-expected earnings report and a reduction in guidance. The company also announced the initiation of a strategic review to evaluate the separation of the diagnostics and drug-discovery parts of their business. Adaptive Biotechnologies clinical testing volume was strong in the fourth quarter, and average selling prices began to improve. We believe the strategic review has the potential to unlock value in the name.
Darling Ingredients
Darling Ingredients detracted from portfolio performance in the quarter, as shares were weak following a lower-than-expected earnings report and a reduction in annual guidance. The reduction was largely driven by lower margins in their Diamond Green Diesel renewable diesel joint venture due to lower renewable identification numbers (RINs) and lower soybean oil prices. We believe these issues should prove to be short-term headwinds, as margins normalize in the coming quarters.
Recent Portfolio Activity
There were no new buys or sells during the quarter.
Outlook
Major equity markets in the fourth quarter were positively impacted by a sharp decline in interest rates. The move in interest rates reflects the view that the tightening cycle implemented by the Fed to curb inflation may have run its course. Expectations for 2024 include rate reductions by the Fed and a high single-digit increase in S&P 500 earnings. Along with this positive view, we also expect a broadening of performance relative to the AI-focused returns in 2023. The sizable move in equity markets in the fourth quarter has left equity valuations at the upper end of historical levels, which could limit the upside, absent positive earnings revisions. The increased geopolitical tensions and a pending U.S. Presidential election may also weigh on markets in 2024. Our focus will continue to be at the company level, with an emphasis on seeking to invest in companies with secular tailwinds or strong product-driven cycles.
Disclosures
The opinions expressed herein are those of Aristotle Atlantic Partners, LLC (Aristotle Atlantic) and are subject to change without notice. Past performance is not a guarantee or indicator of future results. This material is not financial advice or an offer to purchase or sell any product. You should not assume that any of the securities transactions, sectors or holdings discussed in this report were or will be profitable, or that recommendations Aristotle Atlantic makes in the future will be profitable or equal the performance of the listed in this report. The portfolio characteristics shown relate to the Aristotle Atlantic Focus Growth strategy. Not every client’s account will have these characteristics. Aristotle Atlantic reserves the right to modify its current investment strategies and techniques based on changing market dynamics or client needs. There is no assurance that any securities discussed herein will remain in an account’s portfolio at the time you receive this report or that securities sold have not been repurchased. The securities discussed may not represent an account’s entire portfolio and, in the aggregate, may represent only a small percentage of an account’s portfolio holdings. The performance attribution presented is of a representative account from Aristotle Atlantic’s Focus Growth Composite. The representative account is a discretionary client account which was chosen to most closely reflect the investment style of the strategy. The criteria used for representative account selection is based on the account’s period of time under management and its similarity of holdings in relation to the strategy. Recommendations made in the last 12 months are available upon request. Returns are presented gross and net of investment advisory fees and include the reinvestment of all income. Gross returns will be reduced by fees and other expenses that may be incurred in the management of the account. Net returns are presented net of actual investment advisory fees and after the deduction of all trading expenses.
All investments carry a certain degree of risk, including the possible loss of principal. Investments are also subject to political, market, currency and regulatory risks or economic developments. International investments involve special risks that may in particular cause a loss in principal, including currency fluctuation, lower liquidity, different accounting methods and economic and political systems, and higher transaction costs. These risks typically are greater in emerging markets. Securities of small‐ and medium‐sized companies tend to have a shorter history of operations, be more volatile and less liquid. Value stocks can perform differently from the market as a whole and other types of stocks.
The material is provided for informational and/or educational purposes only and is not intended to be and should not be construed as investment, legal or tax advice and/or a legal opinion. Investors should consult their financial and tax adviser before making investments. The opinions referenced are as of the date of publication, may be modified due to changes in the market or economic conditions, and may not necessarily come to pass. Information and data presented has been developed internally and/or obtained from sources believed to be reliable. Aristotle Atlantic does not guarantee the accuracy, adequacy or completeness of such information.
Aristotle Atlantic Partners, LLC is an independent registered investment adviser under the Advisers Act of 1940, as amended. Registration does not imply a certain level of skill or training. More information about Aristotle Atlantic, including our investment strategies, fees and objectives, can be found in our Form ADV Part 2, which is available upon request. AAP-2401-37
Performance Disclosures
Sources: CAPS CompositeHubTM, Russell Investments
Composite returns for all periods ended December 31, 2023 are preliminary pending final account reconciliation.
Past performance is not indicative of future results. Performance results for periods greater than one year have been annualized. Returns are presented gross and net of investment advisory fees and include the reinvestment of all income. Gross returns will be reduced by fees and other expenses that may be incurred in the management of the account. Net returns are presented net of actual investment advisory fees and after the deduction of all trading expenses.
Index Disclosures
The Russell 1000® Growth Index measures the performance of the large cap growth segment of the U.S. equity universe. It includes those Russell 1000 companies with higher price-to-book ratios and higher forecasted growth values. This index has been selected as the benchmark and is used for comparison purposes only. The Russell 1000® Value Index measures the performance of the large cap value segment of the U.S. equity universe. It includes those Russell 1000 companies with lower price-to-book ratios and lower expected growth values. The S&P 500® Index is the Standard & Poor’s Composite Index of 500 stocks and is a widely recognized, unmanaged index of common stock prices. The Russell 2000® Index measures the performance of the small cap segment of the U.S. equity universe. The Russell 2000 Index is a subset of the Russell 3000® Index representing approximately 10% of the total market capitalization of that index. It includes approximately 2,000 of the smallest securities based on a combination of their market cap and current index membership. The Dow Jones Industrial Average® is a price-weighted measure of 30 U.S. blue-chip companies. The Index covers all industries except transportation and utilities. The NASDAQ Composite Index measures all NASDAQ domestic and international based common type stocks listed on The NASDAQ Stock Market. The NASDAQ Composite includes over 3,000 companies, more than most other stock market indices. The Bloomberg U.S. Aggregate Bond Index is an unmanaged index of domestic investment grade bonds, including corporate, government and mortgage-backed securities. The WTI Crude Oil Index is a major trading classification of sweet light crude oil that serves as a major benchmark price for oil consumed in the United States. The 3-Month U.S. Treasury Bill is a short-term debt obligation backed by the U.S. Treasury Department with a maturity of three months. The Consumer Price Index (CPI) is a measure of the average change over time in the prices paid by urban consumers for a market basket of consumer goods and services. While stock selection is not governed by quantitative rules, a stock typically is added only if the company has an excellent reputation, demonstrates sustained growth and is of interest to a large number of investors. The volatility (beta) of the Composite may be greater or less than its respective benchmarks. It is not possible to invest directly in these indices.
A young boy was holding two apples with both hands. His mother came in and softly asked with a smile:
“Sweetie, could you please give your mom one of your two apples?”
The boy looked up at his mom for some seconds, then he suddenly took a quick bite on one apple, and then quickly on the other.
The mom tried very hard not to show her disappointment. Then the boy handed one of the bitten apples to his mom and said:
“Mommy, here you are,this is the sweeter one.”
The moral being to delay judgement until one has all the facts. That’s how jury trials work. That’s why a baseball season has 162 games. That’s why one waits to see the literal paint dry before purchasing enough to finish the wall. And that’s why, in most cities, weathermen wait for the first raindrop before making their predictions.
It is no different in investing.
To read the full article, please use the link below.
(All MSCI index returns are shown net and in U.S. dollars unless otherwise noted.)
Markets Review
Sources: CAPS CompositeHubTM, Bloomberg Past performance is not indicative of future results. Aristotle International Equity Composite returns are presented gross and net of investment advisory fees and include the reinvestment of all income. Gross returns will be reduced by fees and other expenses that may be incurred in the management of the account. Net returns are presented net of actual investment advisory fees and after the deduction of all trading expenses. Aristotle Capital Composite returns are preliminary pending final account reconciliation. Please see important disclosures at the end of this document.
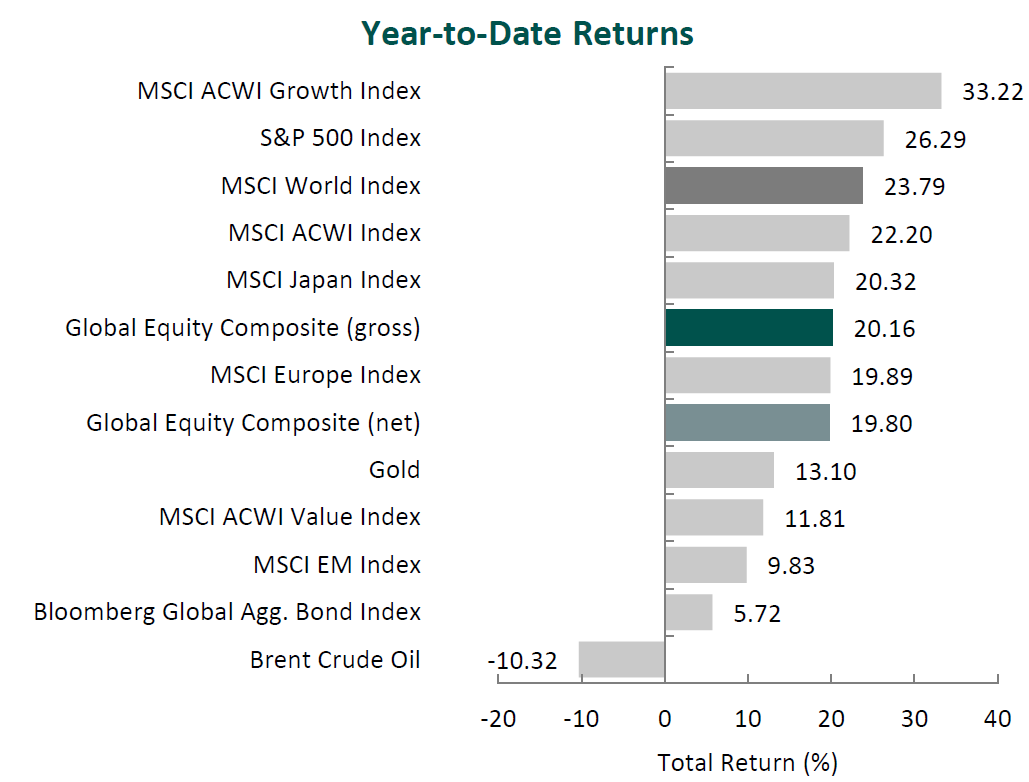
Global equity markets rallied in the fourth quarter. Overall, the MSCI ACWI Index rose 11.03% during the period. Concurrently, the Bloomberg Global Aggregate Bond Index increased 8.10%. In terms of style, value stocks underperformed their growth counterparts during the quarter, with the MSCI ACWI Value Index trailing the MSCI ACWI Growth Index by 3.57%.
Both regionally and on a sector basis, gains were broad-based. Latin America and North America posted the best results, while Emerging Markets and Japan, albeit strong performers, gained the least. On a sector basis, ten out of the eleven sectors within the MSCI ACWI Index finished in the green, with Information Technology, Real Estate and Industrials increasing the most. Meanwhile, Energy was the only sector to decline, while Consumer Staples and Health Care gained the least.
Despite posting overall gains, global equity markets were shocked with another war and humanitarian crisis as tensions between Israel and Hamas reached a watershed during the quarter. In response to the deadly terrorist attack on civilians by Hamas, Israel commenced a military campaign in the Gaza Strip. While concerns that the war might spread throughout the entire Middle East abated during the period, the complex religious, ethnic and political makeup of the region could complicate diplomatic relationships in the future.
Meanwhile, in Europe, Ukraine’s 2023 counteroffensive against Russia was confirmed as a failure, and Western support for the beleaguered nation seems to be waning. President Putin has stated that Russia’s war goals have not changed, but reports indicate that he may be open to a cease-fire. In Asia, President Xi Jinping claimed that reunification is inevitable, adding to the mounting Chinese pressure on Taiwan ahead of Taiwan’s 2024 election.
On the economic front, global labor markets remained tight, and most countries and regions continued to make inroads in the battle against inflation, as the U.S., U.K., eurozone and Japan all reported slowing annual inflation in November; 3.1%, 3.9%, 2.4% and 2.8%, respectively. In response to the improving conditions, both major western and eastern nations largely kept interest rate policy steady during the quarter. However, future policy direction looks to be divided heading into the new year, as the U.S. signaled potential rate cuts, the U.K. and eurozone rebuffed premature discussions of cuts, and Japan looks to end its policy of negative rates in 2024. Nevertheless, the International Monetary Fund expects global inflation to continue to steadily decline due to overall tighter monetary policy and lower commodity prices, which have been further suppressed by the bursting of China’s property bubble.
Annual Markets Review
After a tumultuous year in 2022, global equity markets rebounded in 2023, as the MSCI ACWI posted a full-year return of 22.20%. Additionally, after underperforming value in 2022 by the largest amount since 2000, growth recovered, as the MSCI ACWI Growth Index outperformed the MSCI ACWI Value Index by 21.41% in 2023. Meanwhile, fixed income markets also rose, as the Bloomberg Global Aggregate Bond Index increased 5.72%.
Though markets trended in a positive direction, 2023 still had its share of twists and turns in the form of a banking crisis and geopolitical conflicts in Europe, the Middle East and Asia. Furthermore, inflation, corresponding central bank policies, and economic recovery in areas like Europe and Asia generated significant headlines and proved to be key macroeconomic factors.
Given the multitude of headlines in a year and their fickle nature, short-term returns are often volatile and inconsistent. Therefore, we instead choose to focus on business fundamentals over the long term. By finding great businesses that are undervalued with actionable catalysts within our investment time horizon, we believe we can provide consistent and lasting value to our clients.
Performance and Attribution Summary
For the fourth quarter of 2023, Aristotle Capital’s Global Equity Composite posted a total return of 11.99% gross of fees (11.90% net of fees), outperforming the MSCI World Index, which returned 11.42%, and the MSCI ACWI Index, which returned 11.03%. Please refer to the table below for detailed performance.
Performance (%)
4Q23
1 Year
3 Years
5 Years
10 Years
Since Inception*
Global Equity Composite (gross)
11.99
20.16
6.12
12.79
9.38
10.02
Global Equity Composite (net)
11.90
19.80
5.80
12.42
9.00
9.58
MSCI World Index (net)
11.42
23.79
7.27
12.80
8.60
9.54
MSCI ACWI Index (net)
11.03
22.20
5.75
11.71
7.92
8.62
*The inception date for the Global Equity Composite is November 1, 2010. Past performance is not indicative of future results. Aristotle Global Equity Composite returns are presented gross and net of investment advisory fees and include the reinvestment of all income. Gross returns will be reduced by fees and other expenses that may be incurred in the management of the account. Net returns are presented net of actual investment advisory fees and after the deduction of all trading expenses. Aristotle Capital Composite returns are preliminary pending final account reconciliation. Please see important disclosures at the end of this document.
Source: FactSet Past performance is not indicative of future results. Attribution results are based on sector returns which are gross of investment advisory fees. Attribution is based on performance that is gross of investment advisory fees and includes the reinvestment of income.
From a sector perspective, the portfolio’s outperformance relative to the MSCI World Index can be attributed to security selection, while allocation effects had a negative impact. Security selection in Consumer Discretionary, Energy and Information Technology contributed the most to the portfolio’s relative performance. Conversely, security selection in Industrials, Financials and Health Care detracted from relative return.
Regionally, security selection was responsible for the portfolio’s outperformance relative to the MSCI World Index, while allocation effects had a negative impact. Security selection in North America and our exposure in Emerging Markets contributed the most to relative performance, while security selection in Europe and an overweight in Japan detracted.
Contributors and Detractors for 4Q 2023
Relative Contributors
Relative Detractors
Lennar
Rentokil Initial
Nemetschek
Jazz Pharmaceuticals
Martin Marietta Materials
FMC Corporation
Qualcomm
Alcon
Brookfield
TotalEnergies
Lennar, one of the nation’s largest homebuilders, was the top contributor for the period. Increasing mortgage rates reached a peak during the fourth quarter, but Lennar’s dynamic pricing model, combined with its digital marketing platform and buyer incentives, continued to drive volume and generate cash flow, all while reducing construction cycle times, returning capital to shareholders and further lowering the company’s debt. In 2023, Lennar delivered 73,000 homes (a 10% year-over-year volume increase).The company’s land light strategy also continues to move forward, with 76% of land now controlled through options, as compared to 69% a year ago (and less than 30% in 2015).Over our decade-plus investment in Lennar, we have admired the management team’s ability to respond to changing housing dynamics. We believe Lennar’s current land and pricing strategy should continue to support enhanced FREE cash flow generation. In addition, Lennar’s strong balance sheet, prudent inventory management and further ability to implement cost and production efficiencies position it well to meet demand amid the decade-long undersupply of homes in the U.S.
Nemetschek, a project management software solutions provider for the architecture, engineering and construction industry, was the one of the largest contributors for the quarter. Over the past couple of years, the company has made significant efforts to transition the business from a license to a subscription SaaS (software as a service) model, which we expected would drive higher and more stable revenues per user while creating more long-term value for customers. In line with this strategy, the company reported that ~75% of its revenues are now recurring, up from ~65% last year. Furthermore, with the backdrop of stable demand and strong operational execution, management reported EBITDA margins at the high end of guidance and raised its revenue projections for the year. We believe the optimization of Nemetschek’s business model, continued improvement in operational efficiency through efforts like internalization, and product innovation such as the open and cloud-based dTwin platform, will lead to long-term improvements in profitability and position the company for market share gains as building complexity continues to increase.
Rentokil Initial, the U.K.-based pest control and hygiene services company, was the largest detractor for the quarter. The company’s pest control segment (which accounts for 94% of total operating profit) reported a slowdown in organic revenue growth from 5.6% in the first half of 2023 to 2.3% in the third quarter. As these results are short term in nature, we will continue to closely monitor the company’s progress on both integration of Terminix and further improvement of its marketing strategy. This includes the recent appointment of Brad Paulsen as CEO of the North America Region and his impact on the company’s most important geography (accounting for ~75% of pest control sales). Over the long term, we remain confident that the Terminix acquisition will create scale efficiencies and in-market densification (with a targeted $200 million in cost synergies by 2025), as well as accelerate the consolidation of the U.S. pest control market. Short-term impacts on the company’s stock price, in our opinion, are overdone given these fundamental improvements coupled with the resilient nature of the pest control business.
FMC Corporation, the global provider of crop protection solutions,was the largest detractor for the year and a top detractor for the fourth quarter. Following robust orders during the 2020-2022 period, customer destocking persisted throughout 2023, particularly in Latin America. Despite strong end-market demand, market forces, including inflationary prices and sharply higher interest rates, have combined to motivate customers to draw down existing inventories. As a result, FMC lowered its 2023 guidance and introduced a global restructuring initiative. In November, we attended FMC’s Investor Day where management detailed its strategic plans and introduced mid-term financial goals. We came away with increased confidence that FMC is at or near a cyclical bottom and that management is taking appropriate actions in navigating the worst downcycle the crop protection market has seen in more than 40 years.
Recent Portfolio Activity
Buys
Sells
MonotaRO
Kubota
During the quarter, we sold our position in Kubota and invested in a new position, MonotaRO.
We first invested in Kubota, the maker of tractors and construction machinery, during the second quarter of 2015. During our holding period, the company has increased its agricultural sales by entering wet field markets in Southeast Asia, gained share of small tractors/construction machinery in North America, and restructured its water and environment segment. We decided to sell in favor of what we think is a more compelling investment opportunity. However, we will continue to monitor this high-quality company and follow with interest its attempts to increase its presence in India, a very attractive tractor market where Kubota has yet to prove whether it will be able to take meaningful share.
MonotaRO Co., Ltd.
Established in Japan in 2000, MonotaRO operates a business-to-business (B2B) e-commerce platform, selling about 20 million items (over 650,000 SKUs) to more than 8 million customers (mostly in Japan). The company is an MRO (maintenance, repair and operations) distributor focused on small- and mid-sized companies (~two-thirds of customers), with manufacturing, construction and auto repair industries accounting for the majority of sales. For those reading this online, MonotaRO’s business may seem simple or even obvious; however, the company’s unique profile (>95% of sales are online) and innovative solutions, we believe, provide its customers a distinct value proposition and its shareholders a compelling opportunity to own a leader in a fragmented industry.
MonotaRO serves as a one-stop solution, allowing customers to shop for millions of products via a centralized location. Its transparent pricing saves clients time and reduces costs by removing the need to rely on independent catalogs, individual quotes or separate orders. The company sources its merchandise from thousands of suppliers (i.e., manufacturers and wholesalers) in ten countries and carries over 500,000 products in stock, ready for same-day shipment from its own distribution centers. In addition, its ONE SOURCE Lite allows large clients to link their purchasing management systems to MonotaRO’s, providing company-wide visibility of items and purchases and an integrated experience.
MonotaRO operates as a consolidated subsidiary of U.S.-based Grainger (an industrials supplier) and provides consulting services to the parent’s e-commerce businesses in the U.S., Germany and the U.K.
High-Quality Business
Some of the quality characteristics we have identified for MonotaRO include:
High barriers to entry given that scale is essential to most products in the MRO market, which requires high variety yet small lot ordering, making it imperative to offer a high number of SKUs while investing in technology to provide easier curation and shorter delivery times;
The company’s vast product breath, combined with its advanced data analytics, allows it to analyze procurement behaviors and better predict which items to keep in inventory. The client is able to spend less time ordering and can count on reliable delivery;
Attractive business fundamentals, as ordering can be cumbersome, and clients value reliability, convenience and variety more so than price. The MRO market is also highly fragmented and inefficient. As MonotaRO expands, the more difficult it becomes for others to compete; and
Expertise in database marketing leads to high repeat order rates, while its integrated purchasing management system into large corporations increases their switching costs.
Attractive Valuation
Using our estimates of normalized sales attained through continued market share gains, we believe MonotaRO’s current stock price is offered at a discount to our estimate of the company’s intrinsic value.
Compelling Catalysts
Catalysts we have identified for MonotaRo, which we believe will cause its stock price to appreciate over our three- to five-year investment horizon, include:
Ability to continue gaining share from inefficient small players (e.g., door-to-door dealers relying on people, catalogs and even fax machines);
Increasing existing customers’ sales through technological improvements (e.g., website personalization and recommendation displays) aimed at reducing the time it takes to (1) find, (2) purchase and (3) receive products;
Further penetration into enterprise customers should provide a larger source for sales growth, as this segment represents a higher customer lifetime value as well as stickiness; and
Growth in sales of MonotaRO’s private label offering of approximately 300,000 products that are higher margin yet provide savings to clients.
Conclusion
With volatile economic data points, changing central bank policies, shocks to the banking system and various geopolitical conflicts, 2023 was full of headline-worthy news. However, as the market’s attention quickly shifted from one macro event to the next, we remained true to our bottom up, fundamental investment philosophy.
As such, instead of chasing the next headline or “placing bets” on short-term predictions, our focus remains on business fundamentals and what is analyzable in the long run. For over the past quarter century, we have dedicated ourselves to a “bottom-up” process of identifying high-quality businesses trading at meaningful discounts to intrinsic value, that possess catalysts which are underway and within management’s control. By doing so, we believe we can find long-term success regardless of the macroeconomic environment or news of the day.
Disclosures
The opinions expressed herein are those of Aristotle Capital Management, LLC (Aristotle Capital) and are subject to change without notice. Past performance is not a guarantee or indicator of future results. This material is not financial advice or an offer to buy or sell any product. You should not assume that any of the securities transactions, sectors or holdings discussed in this report were or will be profitable, or that recommendations Aristotle Capital makes in the future will be profitable or equal the performance of the securities listed in this report. The portfolio characteristics shown relate to the Aristotle Global Equity strategy. Not every client’s account will have these characteristics. Aristotle Capital reserves the right to modify its current investment strategies and techniques based on changing market dynamics or client needs. There is no assurance that any securities discussed herein will remain in an account’s portfolio at the time you receive this report or that securities sold have not been repurchased. The securities discussed may not represent an account’s entire portfolio and, in the aggregate, may represent only a small percentage of an account’s portfolio holdings. The performance attribution presented is of a representative account from Aristotle Capital’s Global Equity Composite. The representative account is a discretionary client account which was chosen to most closely reflect the investment style of the strategy. The criteria used for representative account selection is based on the account’s period of time under management and its similarity of holdings in relation to the strategy. Recommendations made in the last 12 months are available upon request.
Returns are presented gross and net of investment advisory fees and include the reinvestment of all income. Gross returns will be reduced by fees and other expenses that may be incurred in the management of the account. Net returns are presented net of actual investment advisory fees and after the deduction of all trading expenses.
All investments carry a certain degree of risk, including the possible loss of principal. Investments are also subject to political, market, currency and regulatory risks or economic developments. International investments involve special risks that may in particular cause a loss in principal, including currency fluctuation, lower liquidity, different accounting methods and economic and political systems, and higher transaction costs. These risks typically are greater in emerging markets. Securities of small‐ and medium‐sized companies tend to have a shorter history of operations, be more volatile and less liquid. Value stocks can perform differently from the market as a whole and other types of stocks.
The material is provided for informational and/or educational purposes only and is not intended to be and should not be construed as investment, legal or tax advice and/or a legal opinion. Investors should consult their financial and tax adviser before making investments. The opinions referenced are as of the date of publication, may be modified due to changes in the market or economic conditions, and may not necessarily come to pass. Information and data presented has been developed internally and/or obtained from sources believed to be reliable. Aristotle Capital does not guarantee the accuracy, adequacy or completeness of such information.
Aristotle Capital Management, LLC is an independent investment adviser registered under the Investment Advisers Act of 1940, as amended. Registration does not imply a certain level of skill or training. More information about Aristotle Capital, including our investment strategies, fees and objectives, can be found in our Form ADV Part 2, which is available upon request. ACM-2401-89
Performance Disclosures
Sources: CAPS CompositeHubTM, MSCI
Composite returns for all periods ended December 31, 2023 are preliminary pending final account reconciliation.
The Aristotle Global Equity Composite has an inception date of November 1, 2010; however, the strategy initially began at Howard Gleicher’s predecessor firm in July 2007. A supplemental performance track record from January 1, 2008 through October 31, 2010 is provided on this page and complements the Global Equity Composite presentation that is located at the end of this presentation. The performance results were achieved while Mr. Gleicher managed the strategy at a prior firm. The returns are those of a publicly available mutual fund from the fund’s inception through Mr. Gleicher’s departure from the firm. During that time, Mr. Gleicher had primary responsibility for managing the fund.
Past performance is not indicative of future results. The information provided should not be considered financial advice or a recommendation to purchase or sell any particular security or product. Performance results for periods greater than one year have been annualized.
Returns are presented gross and net of investment advisory fees and include the reinvestment of all income. Gross returns will be reduced by fees and other expenses that may be incurred in the management of the account. Net returns are presented net of actual investment advisory fees and after the deduction of all trading expenses.
Index Disclosures
The MSCI World Index is a free float-adjusted market capitalization weighted index that is designed to measure the equity market performance of developed markets. The MSCI World Index consists of the following 23 developed market country indexes: Australia, Austria, Belgium, Canada, Denmark, Finland, France, Germany, Hong Kong, Ireland, Israel, Italy, Japan, Netherlands, New Zealand, Norway, Portugal, Singapore, Spain, Sweden, Switzerland, the United Kingdom and the United States. The MSCI Emerging Markets Index is a free float-adjusted market capitalization-weighted index that is designed to measure equity market performance of emerging markets. The MSCI Emerging Markets Index consists of the following 24 emerging market country indexes: Brazil, Chile, China, Colombia, Czech Republic, Egypt, Greece, Hungary, India, Indonesia, Korea, Kuwait, Malaysia, Mexico, Peru, Philippines, Poland, Qatar, Saudi Arabia, South Africa, Taiwan, Thailand, Turkey and United Arab Emirates. The MSCI ACWI captures large and mid-cap representation across 23 developed markets and 24 emerging markets countries. With approximately 3,000 constituents, the Index covers approximately 85% of the global investable equity opportunity set. The MSCI ACWI Growth Index captures large and mid-cap securities exhibiting overall growth style characteristics across 23 developed markets countries and 24 emerging markets countries. The MSCI ACWI Value Index captures large and mid-cap securities exhibiting overall value style characteristics across 23 developed markets countries and 24 emerging markets countries. The MSCI Europe Index captures large and mid-cap representation across 15 developed markets countries in Europe. With more than 400 constituents, the Index covers approximately 85% of the free float-adjusted market capitalization across the European developed markets equity universe. The MSCI Japan Index is designed to measure the performance of the large and mid-cap segments of the Japanese market. With approximately 250 constituents, the Index covers approximately 85% of the free float-adjusted market capitalization in Japan. The S&P 500® Index is the Standard & Poor’s Composite Index of 500 stocks and is a widely recognized, unmanaged index of common stock prices. The Bloomberg Global Aggregate Bond Index is a flagship measure of global investment grade debt from 28 local currency markets. This multi-currency benchmark includes Treasury, government-related, corporate and securitized fixed rate bonds from both developed and emerging markets issuers. The Brent Crude Oil Index is a major trading classification of sweet light crude oil that serves as a major benchmark price for purchases of oil worldwide. The volatility (beta) of the Composite may be greater or less than the benchmarks. It is not possible to invest directly in these indexes.
(All MSCI index returns are shown net and in U.S. dollars unless otherwise noted.)
Markets Review
Sources: CAPS CompositeHubTM, Bloomberg Past performance is not indicative of future results. Aristotle International Equity Composite returns are presented gross and net of investment advisory fees and include the reinvestment of all income. Gross returns will be reduced by fees and other expenses that may be incurred in the management of the account. Net returns are presented net of actual investment advisory fees and after the deduction of all trading expenses. Aristotle Capital Composite returns are preliminary pending final account reconciliation. Please see important disclosures at the end of this document.
Global equity markets rallied in the fourth quarter. Overall, the MSCI ACWI Index rose 11.03% during the period. Concurrently, the Bloomberg Global Aggregate Bond Index increased 8.10%. In terms of style, value stocks underperformed their growth counterparts during the quarter, with the MSCI ACWI Value Index trailing the MSCI ACWI Growth Index by 3.57%.
The MSCI EAFE Index climbed 10.42% during the fourth quarter, while the MSCI ACWI ex USA Index increased 9.75%. Within the MSCI EAFE Index, Europe & Middle East and Asia were the strongest performers, while the U.K., though posting strong absolute results, gained the least. On a sector basis, all eleven sectors within the MSCI EAFE Index posted positive returns, with Information Technology, Materials and Real Estate generating the largest gains. Conversely, Energy, Health Care and Consumer Staples gained the least.
Despite posting overall gains, global equity markets were shocked with another war and humanitarian crisis as tensions between Israel and Hamas reached a watershed during the quarter. In response to the deadly terrorist attack on civilians by Hamas, Israel commenced a military campaign in the Gaza Strip. While concerns that the war might spread throughout the entire Middle East abated during the period, the complex religious, ethnic and political makeup of the region could complicate diplomatic relationships in the future.
Meanwhile, in Europe, Ukraine’s 2023 counteroffensive against Russia was confirmed as a failure, and Western support for the beleaguered nation seems to be waning. President Putin has stated that Russia’s war goals have not changed, but reports indicate that he may be open to a cease-fire. In Asia, President Xi Jinping claimed that reunification is inevitable, adding to the mounting Chinese pressure on Taiwan ahead of Taiwan’s 2024 election.
On the economic front, global labor markets remained tight, and most countries and regions continued to make inroads in the battle against inflation, as the U.S., U.K., eurozone and Japan all reported slowing annual inflation in November; 3.1%, 3.9%, 2.4% and 2.8%, respectively. In response to the improving conditions, both major western and eastern nations largely kept interest rate policy steady during the quarter. However, future policy direction looks to be divided heading into the new year, as the U.S. signaled potential rate cuts, the U.K. and eurozone rebuffed premature discussions of cuts, and Japan looks to end its policy of negative rates in 2024. Nevertheless, the International Monetary Fund expects global inflation to continue to steadily decline due to overall tighter monetary policy and lower commodity prices, which have been further suppressed by the bursting of China’s property bubble.
Annual Markets Review
After a tumultuous year in 2022, global equity markets rebounded in 2023, as the MSCI ACWI posted a full-year return of 22.20%. Additionally, after underperforming value in 2022 by the largest amount since 2000, growth recovered, as the MSCI ACWI Growth Index outperformed the MSCI ACWI Value Index by 21.41% in 2023. Meanwhile, fixed income markets also rose, as the Bloomberg Global Aggregate Bond Index increased 5.72%.
Though markets trended in a positive direction, 2023 still had its share of twists and turns in the form of a banking crisis and geopolitical conflicts in Europe, the Middle East and Asia. Furthermore, inflation, corresponding central bank policies, and economic recovery in areas like Europe and Asia generated significant headlines and proved to be key macroeconomic factors.
Given the multitude of headlines in a year and their fickle nature, short-term returns are often volatile and inconsistent. Therefore, we instead choose to focus on business fundamentals over the long term. By finding great businesses that are undervalued with actionable catalysts within our investment time horizon, we believe we can provide consistent and lasting value to our clients.
Performance and Attribution Summary
For the fourth quarter of 2023, Aristotle Capital’s International Equity Composite posted a total return of 10.41% gross of fees (10.31% net of fees), underperforming the MSCI EAFE Index, which returned 10.42%, and outperforming the MSCI ACWI ex USA Index, which returned 9.75%. Please refer to the table below for detailed performance.
Performance (%)
4Q23
1 Year
3 Years
5 Years
10 Years
Since Inception*
International Equity Composite (gross)
10.41
18.54
3.32
8.81
5.17
5.63
International Equity Composite (net)
10.31
18.00
2.84
8.30
4.66
5.13
MSCI EAFE Index (net)
10.42
18.24
4.02
8.16
4.28
2.76
MSCI ACWI ex USA Index (net)
9.75
15.62
1.55
7.08
3.83
2.35
*The inception date for the International Equity Composite is January 1, 2008. Past performance is not indicative of future results. Aristotle International Equity Composite returns are presented gross and net of investment advisory fees and include the reinvestment of all income. Gross returns will be reduced by fees and other expenses that may be incurred in the management of the account. Net returns are presented net of actual investment advisory fees and after the deduction of all trading expenses. Aristotle Capital Composite returns are preliminary pending final account reconciliation. Please see important disclosures at the end of this document.
Source: FactSet Past performance is not indicative of future results. Attribution results are based on sector returns which are gross of investment advisory fees. Attribution is based on performance that is gross of investment advisory fees and includes the reinvestment of income.
From a sector perspective in the fourth quarter, the portfolio’s modest underperformance relative to the MSCI EAFE Index can be attributed to allocation effects, while security selection had a positive impact. Security selection in Industrials and Health Care, as well as an overweight in Energy, detracted the most from the portfolio’s relative performance. Conversely, security selection in Financials, Consumer Discretionary and Energy contributed to relative return.
Regionally, security selection was responsible for the portfolio’s underperformance, while allocation effects had a positive impact. Security selection in the U.K. and Asia detracted from relative performance, while exposure to Canada and security selection in Europe & Middle East contributed.
Contributors and Detractors for 4Q 2023
Relative Contributors
Relative Detractors
Nemetschek
Rentokil Initial
Brookfield
Haleon
Assa Abloy
Alcon
Experian
Nidec
Samsung Electronics
Munich Reinsurance
Rentokil Initial, the U.K.-based pest control and hygiene services company, was the largest detractor for the quarter. The company’s pest control segment (which accounts for 94% of total operating profit) reported a slowdown in organic revenue growth from 5.6% in the first half of 2023 to 2.3% in the third quarter. As these results are short term in nature, we will continue to closely monitor the company’s progress on both integration of Terminix and further improvement of its marketing strategy. This includes the recent appointment of Brad Paulsen as CEO of the North America Region and his impact on the company’s most important geography (accounting for ~75% of pest control sales). Over the long term, we remain confident that the Terminix acquisition will create scale efficiencies and in-market densification (with a targeted $200 million in cost synergies by 2025), as well as accelerate the consolidation of the U.S. pest control market. Short-term impacts on the company’s stock price, in our opinion, are overdone given these fundamental improvements coupled with the resilient nature of the pest control business.
Japan-based Nidec, the global supplier of brushless motors, was one of the largest detractors for the quarter. The company’s electric vehicle (EV) traction motor business has disappointed, with shipment assumptions dropping to 350,000 from 949,000 at the start of the fiscal year. Management also withdrew its ambitious target for the EV business to turn profitable this fiscal year, now projecting an operating loss of ¥15 billion, as it noted all motor suppliers to Chinese EV manufacturers are currently experiencing losses due to intensifying price competition. In response, Nidec has announced a shift in its strategy to both increase R&D spending to accelerate product development and shore up profitability with more selective order placement. While we continue to believe Nidec’s expertise in power efficiency provides it with a unique advantage to supply industrial motors across markets (not only for EVs, but also robots, appliances and industrial applications), we are carefully reviewing whether recent setbacks are cyclical issues or more permanent in nature, and we also continue to monitor changes in leadership, including those set to take place in April 2024.
Nemetschek, a project management software solutions provider for the architecture, engineering and construction industry, was the largest contributor for the quarter. Over the past couple of years, the company has made significant efforts to transition the business from a license to a subscription SaaS (software as a service) model, which we expected would drive higher and more stable revenues per user while creating more long-term value for customers. In line with this strategy, the company reported that ~75% of its revenues are now recurring, up from ~65% last year. Furthermore, with the backdrop of stable demand and strong operational execution, management reported EBITDA margins at the high end of guidance and raised its revenue projections for the year. We believe the optimization of Nemetschek’s business model, continued improvement in operational efficiency through efforts like internalization, and product innovation, such as the open and cloud-based dTwin platform, will lead to long-term improvements in profitability and position the company for market share gains as building complexity continues to increase.
Experian, one of the largest credit bureau companies in the world, was a primary contributor during the quarter. Amidtighter lending conditions, the company continues to show its strength. This includes recent product launches and innovation within the company’s Ascend platform, which leverages deeper analytics so that lenders can automate processes and target audiences more effectively. The credit bureau also expanded its position in employer services and verifications and has seen further digital penetration in areas like Auto and Health. During our well over a decade-long ownership of Experian, the company has increasingly found ways to monetize existing data sets and serve new types of customers. We believe Experian’s unique industry structure and massive data library (with data on ~1.5 billion consumers and ~200 million businesses) not only creates an exceptionally scalable business with high barriers to entry, but also makes it uniquely positioned to benefit from the increased need for big data across many industries.
Recent Portfolio Activity
Buys
Sells
Daikin Industries
Dassault Systèmes
Sandoz
During the quarter, we sold our positions in Dassault Systèmes and Sandoz and invested in a new position in Daikin Industries.
We first invested in Dassault in the first quarter of 2015. During our more than eight-year holding period, the company executed on a number of catalysts, including a profitable transition to a new software platform (i.e., 3DExperience) and successful entry into new verticals such as life sciences via the 2019 acquisition of Medidata. While we continue to view Dassault as a high-quality company, we decided to exit our investment in favor of what we view as a more optimal opportunity in Daikin Industries, which is discussed in detail below.
We have been Novartis shareholders for over a decade. In October of 2023, the company completed the spinoff of Sandoz, its generics and biosimilars business. This divestiture furthers Novartis’s ongoing transition to a focus on branded prescription drugs, having over the last several years also exited its eye care, vaccine, animal health and consumer healthcare businesses. Upon further analysis, we decided to sell the shares received in the Sandoz spinoff and use the proceeds for what we consider to be a more optimal investment.
Daikin Industries, Ltd.
Founded in 1924 and headquartered in Japan, Daikin Industries is the world’s largest commercial and residential air conditioner company. Daikin primarily manufactures and sells air conditioning systems, heat pumps, air purifiers and refrigeration equipment (which accounts for over 90% of revenue). Daikin has long been an industry leader in developing energy-efficient products, which was molded by its roots in Japan, a region with limited natural resources and high energy costs. The company’s R&D consists of a global Technology Innovation Center and 39 other regional development facilities in charge of tailoring offerings to their local markets. Today Daikin’s products are sold in over 170 countries, and the company boasts leading market positions in Japan and China, as well as in the U.S. residential market.
Distribution is particularly important since air conditioning systems are difficult to install. Daikin’s 2012 acquisition of Goodman in the U.S. added hundreds of distribution points across the country, providing Daikin with a leading national market position and platform from which to expand. In China, specialty retail stores (ProShops) sell directly to homeowners, focusing on high-end, multi-unit products at much higher margins than if they were selling to a developer or contractor.
High-Quality Business
Some of the quality characteristics we have identified for Daikin include:
Strong brand recognition and a large global distribution network are, in our opinion, strong competitive advantages and serve as high barriers to entry;
History of technological innovation, particularly in energy-saving inverters and variable refrigerant flow systems; and
Ability to tailor products to different local preferences across geographies and varied levels of HVAC regulations, thanks to Daikin’s network of global production bases and development facilities.
Attractive Valuation
Based on our estimates, shares of the company are attractively valued. We believe greater global adoption of air conditioning, as well as higher priced and more profitable technologies (i.e., heat pumps and inverters), will lead to higher normalized FREE cash flow than currently appreciated by the market.
Compelling Catalysts
Catalysts we have identified for Daikin, which we believe will cause its stock price to appreciate over our three- to five-year investment horizon, include:
As the largest global supplier and a leader in energy efficiency, Daikin is uniquely positioned to benefit from the increase in worldwide air conditioning adoption rates (projected to triple by 2050) while leveraging its intellectual property in inverters and heat pumps;
Market share gains in the U.S. as Daikin further leverages its technology in premium residential air conditioning supported by Goodman’s distribution network; and
Execution of its Fusion 25 strategic plan that includes making improvements in technological development, strengthening sales and service networks, promoting digital transformation, and more.
Conclusion
With volatile economic data points, changing central bank policies, shocks to the banking system and various geopolitical conflicts, 2023 was full of headline-worthy news. However, as the market’s attention quickly shifted from one macro event to the next, we remained true to our bottom up, fundamental investment philosophy.
As such, instead of chasing the next headline or “placing bets” on short-term predictions, our focus remains on business fundamentals and what is analyzable in the long run. For over the past quarter century, we have dedicated ourselves to a “bottom-up” process of identifying high-quality businesses trading at meaningful discounts to intrinsic value, that possess catalysts which are underway and within management’s control. By doing so, we believe we can find long-term success regardless of the macroeconomic environment or news of the day.
Disclosures
The opinions expressed herein are those of Aristotle Capital Management, LLC (Aristotle Capital) and are subject to change without notice. Past performance is not a guarantee or indicator of future results. This material is not financial advice or an offer to buy or sell any product. You should not assume that any of the securities transactions, sectors or holdings discussed in this report were or will be profitable, or that recommendations Aristotle Capital makes in the future will be profitable or equal the performance of the securities listed in this report. The portfolio characteristics shown relate to the Aristotle International Equity strategy. Not every client’s account will have these characteristics. Aristotle Capital reserves the right to modify its current investment strategies and techniques based on changing market dynamics or client needs. There is no assurance that any securities discussed herein will remain in an account’s portfolio at the time you receive this report or that securities sold have not been repurchased. The securities discussed may not represent an account’s entire portfolio and, in the aggregate, may represent only a small percentage of an account’s portfolio holdings. The performance attribution presented is of a representative account from Aristotle Capital’s International Equity Composite. The representative account is a discretionary client account which was chosen to most closely reflect the investment style of the strategy. The criteria used for representative account selection is based on the account’s period of time under management and its similarity of holdings in relation to the strategy. Recommendations made in the last 12 months are available upon request.
Returns are presented gross and net of investment advisory fees and include the reinvestment of all income. Gross returns will be reduced by fees and other expenses that may be incurred in the management of the account. Net returns are presented net of actual investment advisory fees and after the deduction of all trading expenses.
All investments carry a certain degree of risk, including the possible loss of principal. Investments are also subject to political, market, currency and regulatory risks or economic developments. International investments involve special risks that may in particular cause a loss in principal, including currency fluctuation, lower liquidity, different accounting methods and economic and political systems, and higher transaction costs. These risks typically are greater in emerging markets. Securities of small‐ and medium‐sized companies tend to have a shorter history of operations, be more volatile and less liquid. Value stocks can perform differently from the market as a whole and other types of stocks.
The material is provided for informational and/or educational purposes only and is not intended to be and should not be construed as investment, legal or tax advice and/or a legal opinion. Investors should consult their financial and tax adviser before making investments. The opinions referenced are as of the date of publication, may be modified due to changes in the market or economic conditions, and may not necessarily come to pass. Information and data presented has been developed internally and/or obtained from sources believed to be reliable. Aristotle Capital does not guarantee the accuracy, adequacy or completeness of such information.
Aristotle Capital Management, LLC is an independent registered investment adviser under the Advisers Act of 1940, as amended. Registration does not imply a certain level of skill or training. More information about Aristotle Capital, including our investment strategies, fees and objectives, can be found in our Form ADV Part 2, which is available upon request. ACM-2401-45
Performance Disclosures
Sources: CAPS CompositeHubTM, MSCI
Composite returns for all periods ended December 31, 2023 are preliminary pending final account reconciliation.
Past performance is not indicative of future results. The information provided should not be considered financial advice or a recommendation to purchase or sell any particular security or product. Performance results for periods greater than one year have been annualized.
Returns are presented gross and net of investment advisory fees and include the reinvestment of all income. Gross returns will be reduced by fees and other expenses that may be incurred in the management of the account. Net returns are presented net of actual investment advisory fees and after the deduction of all trading expenses.
Index Disclosures
The MSCI EAFE Index (Europe, Australasia, Far East) is a free float-adjusted market capitalization-weighted index that is designed to measure the equity market performance of developed markets, excluding the United States and Canada. The MSCI EAFE Index consists of the following 21 developed market country indexes: Australia, Austria, Belgium, Denmark, Finland, France, Germany, Hong Kong, Ireland, Israel, Italy, Japan, the Netherlands, New Zealand, Norway, Portugal, Singapore, Spain, Sweden, Switzerland and the United Kingdom. The MSCI ACWI captures large and mid-cap representation across 23 developed market countries and 24 emerging markets countries. With approximately 3,000 constituents, the Index covers approximately 85% of the global investable equity opportunity set. The MSCI ACWI Growth Index captures large and mid-cap securities exhibiting overall growth style characteristics across 23 developed markets countries and 24 emerging markets countries. The MSCI ACWI Value Index captures large and mid-cap securities exhibiting overall value style characteristics across 23 developed markets countries and 24 emerging markets countries. The MSCI ACWI ex USA Index captures large and mid-cap representation across 22 of 23 developed markets countries (excluding the United States) and 24 emerging markets countries. With approximately 2,300 constituents, the Index covers approximately 85% of the global equity opportunity set outside the United States. The MSCI Emerging Markets Index is a free float-adjusted market capitalization-weighted index that is designed to measure the equity market performance of emerging markets. The MSCI Emerging Markets Index consists of the following 24 emerging market country indexes: Brazil, Chile, China, Colombia, Czech Republic, Egypt, Greece, Hungary, India, Indonesia, Korea, Kuwait, Malaysia, Mexico, Peru, Philippines, Poland, Qatar, Saudi Arabia, South Africa, Taiwan, Thailand, Turkey and United Arab Emirates. The S&P 500® Index is the Standard & Poor’s Composite Index of 500 stocks and is a widely recognized, unmanaged index of common stock prices. The Brent Crude Oil Index is a major trading classification of sweet light crude oil that serves as a major benchmark price for purchases of oil worldwide. The MSCI Japan Index is designed to measure the performance of the large and mid-cap segments of the Japanese market. With approximately 250 constituents, the Index covers approximately 85% of the free float-adjusted market capitalization in Japan. The Bloomberg Global Aggregate Bond Index is a flagship measure of global investment grade debt from 28 local currency markets. This multi-currency benchmark includes treasury, government-related, corporate and securitized fixed-rate bonds from both developed and emerging markets issuers. The MSCI United Kingdom Index is designed to measure the performance of the large and mid-cap segments of the U.K. market. With nearly 100 constituents, the Index covers approximately 85% of the free float-adjusted market capitalization in the United Kingdom. The MSCI Europe Index captures large and mid-cap representation across 15 developed markets countries in Europe. With approximately 430 constituents, the Index covers approximately 85% of the free float-adjusted market capitalization across the European developed markets equity universe. These indexes have been selected as the benchmarks and are used for comparison purposes only. The volatility (beta) of the Composite may be greater or less than the respective benchmarks. It is not possible to invest directly in these indexes.