This site has been created for institutional investors and RIAs. An institutional investor is an entity that invests capital on behalf of others such as pension funds, banks, insurance companies, mutual funds, foundations/endowments, trust companies or other large investors and their investment consultants. RIA is a registered investment advisor who is responsible for allocating their client funds. This site is not intended for individual investor access, as it does not consider individual risk tolerances or investment objectives of an individual investor. Click “Accept and Continue” to affirm you meet the description of an Institutional Investor.
This site has been designed for financial intermediaries such as financial advisors, wealth managers, broker/dealers and home office research teams. This site is not intended for individual investor access, as it does not consider individual risk tolerances or investment objectives of an individual investor. Click “Accept and Continue” to affirm you meet the description of a Financial Advisor.
This area of the website contains information that is general and/or educational in nature. Individual investors should consider their own investment objectives and risk tolerances or consult with a financial advisor before making any investment decision. Click “Accept and Continue” to continue.
Aristotle Pacific’s Jeffrey Klingelhofer, CFA, was live on Yahoo Finance’s “Market Domination Overtime” with Julie Hyman and Josh Lipton. In this segment, he shared his perspective on the current state of the U.S. economy, addressed the noise around tariffs, and offered insights on interest rates in today’s dynamic market environment.
Jeff Klingelhofer Managing Director, Portfolio Manager
Watch the full interview below (2:53-9:57 for full context).
Video property of Yahoo Finance
About Aristotle Pacific Aristotle Pacific Capital is a Newport Beach, Calif.-based registered investment adviser that actively invests in credit securities on the basis of fundamental credit analysis with the objective of identifying and realizing relative value. The firm manages credit strategies across floating-rate loans, CLOs, multi-sector, high-yield, investment-grade, and short-duration bonds.
(All MSCI index returns are shown net and in U.S. dollars unless otherwise noted.)
Markets Review
Sources: CAPS CompositeHubTM, Bloomberg Past performance is not indicative of future results. Aristotle International Equity ADR WM Composite returns are presented pure gross and net of the maximum wrap fee and include the reinvestment of all income. Pure gross returns do not reflect the deduction of any trading costs or other fees and are supplemental to the net returns. Net returns are calculated by subtracting the highest applicable wrap/SMA fee, which includes trading costs and custodial fees, from the pure gross composite return. (From inception to 12/31/2015, the highest applicable wrap/SMA fee is 3.00% on an annual basis, or 0.75% quarterly. From 1/1/2016 to 12/31/2023, the highest applicable wrap/SMA fee is 2.00% on an annual basis, or 0.50% quarterly and 0.17% monthly from 1/1/2024 to present.) Aristotle Capital Composite returns are preliminary pending final account reconciliation. Please see important disclosures at the end of this document.
Global equity markets started the year on a modestly negative note, with the MSCI ACWI Index returning ‑1.32% for the first quarter. In contrast, global fixed income gained ground, as the Bloomberg Global Aggregate Bond Index rose 2.64%. Value stocks outpaced growth over the quarter, with the MSCI ACWI Value Index outperforming the MSCI ACWI Growth Index by 11.59%.
Outside the U.S., international equities made strong gains versus their American counterparts. The MSCI EAFE Index rose 6.86% during the first quarter, while the MSCI ACWI ex USA Index climbed 5.23%. Within the MSCI EAFE Index, Europe & Middle East and the U.K. were the strongest performers, while Asia increased the least. On a sector basis, nine out of the eleven sectors within the MSCI EAFE Index posted positive returns, with Energy, Financials and Utilities generating the largest gains. Conversely, Information Technology, Consumer Discretionary and Real Estate performed the worst.
Inflation trends remained broadly stable across developed markets. The U.S., U.K., and EU all reported annual inflation below 3%, giving central banks greater flexibility. The Federal Reserve held rates steady, while the European Central Bank and Bank of England continued to ease monetary policy in response to softer growth signals. In Asia, China’s economy recorded 5% GDP growth in 2024, showing tentative signs of recovery, while the Bank of Japan raised interest rates for the third time since ending its negative interest rate policy in March 2024 on expectations of sustained 2% inflation.
Trade policy re-emerged as a market concern during the quarter. In his first months back in office, President Trump announced a new wave of tariffs on imports from Canada, Mexico and China, with additional warnings directed at the EU and other trading partners over what were termed “imbalanced trade arrangements.” The targeted industries—autos, steel and aluminum—reflected a focus on reshoring and industrial policy. While the long-term impact is still unfolding, the renewed trade uncertainty prompted central banks to lower growth forecasts and adopt a more cautious tone on future rate moves.
In Europe, Germany’s economy remained under pressure after contracting for a second consecutive year in 2024—the first two-year contraction since 2003. In response, Chancellor-designate Friedrich Merz proposed sweeping fiscal reforms, including an overhaul of the constitutional debt brake, a €500 billion infrastructure fund and increased defense spending. While potentially supportive of medium-term growth, these initiatives have raised concerns around inflation and fiscal discipline, adding complexity to the European Central Bank’s policy path.
On the geopolitical front, a fragile ceasefire between Israel and Hamas in January unraveled by March amid disagreements over hostage releases. In Ukraine, a military stalemate in the east opened the door for ceasefire negotiations brokered by the U.S., with discussions reportedly tied to a potential minerals agreement to offset financial aid.
Finally, the artificial intelligence (AI) theme continued to influence market narratives. Chinese startup DeepSeek gained international attention after launching a low-cost rival to leading generative AI models from OpenAI, Anthropic and Google. The move not only intensified competition but raised new questions about the durability and configuration of global AI supply chains. Notably, DeepSeek’s approach—achieving comparable performance at a fraction of the cost—has challenged assumptions around the infrastructure demands of generative AI, potentially reducing the need for GPUs, energy-intensive data centers and the broader hardware stack the market had expected would underpin AI growth.
Performance and Attribution Summary
For the first quarter of 2025, Aristotle Capital’s International Equity ADR WM Composite posted a total return of 4.06% pure gross of fees (3.56% net of fees), underperforming the MSCI EAFE Index, which returned 6.86%, and the MSCI ACWI ex USA Index, which returned 5.23%. Please refer to the table below for detailed performance.
Performance (%)
1Q25
1 Year
3 Years
5 Years
10 Years
Since Inception*
International Equity ADR WM Composite (pure gross)
4.06
6.86
6.17
13.06
6.73
7.83
International Equity ADR WM Composite (net)
3.56
4.77
4.05
10.82
4.61
5.48
MSCI EAFE Index (net)
6.86
4.88
6.05
11.77
5.40
6.97
MSCI ACWI ex USA Index (net)
5.23
6.09
4.48
10.92
4.98
6.07
*The inception date for the International Equity ADR WM Composite is 7/1/2012. As of 1/1/2024, the composite was renamed from the International Equity ADR Wrap Composite. Past performance is not indicative of future results. Aristotle International Equity ADR WM Composite returns are presented pure gross and net of the maximum wrap fee and include the reinvestment of all income. Pure gross returns do not reflect the deduction of any trading costs or other fees and are supplemental to the net returns. Net returns are calculated by subtracting the highest applicable wrap/SMA fee, which includes trading costs and custodial fees, from the pure gross composite return. (From inception to 12/31/2015, the highest applicable wrap/SMA fee is 3.00% on an annual basis, or 0.75% quarterly. From 1/1/2016 to 12/31/2023, the highest applicable wrap/SMA fee is 2.00% on an annual basis, or 0.50% quarterly and 0.17% monthly from 1/1/2024 to present.) Aristotle Capital Composite returns are preliminary pending final account reconciliation. Please see important disclosures at the end of this document.
Source: FactSet Past performance is not indicative of future results. Sector attribution shows how much of a portfolio’s overall return is directly attributable to stock selection and asset allocation decisions within the portfolio, highlighting which sectors contributed or detracted to the total return. Attribution includes the reinvestment of income.
From a sector perspective, the portfolio’s underperformance relative to the MSCI EAFE Index can be attributed to both security selection and allocation effects. Security selection in Energy, Financials and Industrials detracted the most from the portfolio’s relative performance. Conversely, security selection in Health Care and Consumer Discretionary, as well as an underweight in Information Technology, contributed to relative returns.
Regionally, both allocation effects and security selection were responsible for the portfolio’s underperformance. Exposure to Canada and security selection in the U.K. detracted the most from relative performance, while security selection and an underweight in Asia contributed.
Contributors and Detractors for 1Q 2025
Relative Contributors
Relative Detractors
ING Groep
Cameco
Safran
Brookfield
Munich Reinsurance
Accenture
Sony
Diageo
Roche
Ashtead Group
Cameco, one of the world’s largest uranium producers, was a primary detractor during the quarter. Shares of the Canada-based company declined following President Trump’s 10% tariff on Canadian energy exports to the U.S., where Cameco is a major uranium supplier. However, we believe these tariff concerns are overstated given the inelastic nature of uranium demand and the lack of substitutes. Any incremental costs would be absorbed by utilities under existing contract structures. While the company’s stock price may have followed the decline in uranium spot prices during the period, Cameco’s business is largely insulated from short-term price swings due to its extensive use of long-term contracts rather than spot-market sales. Moreover, the company’s tier-one assets in politically stable jurisdictions, operational track record and ability to flex production—particularly at its MacArthur River and Key Lake mines—further strengthen its competitive advantage. We believe Cameco remains exceptionally well-positioned to benefit as governments around the world increasingly turn to nuclear power as a clean, secure and scalable source of energy.
Accenture, the global IT services and consulting firm, was one of the largest detractors during the period. The company reported revenue at the top end of its guided range, supported by solid booking, particularly in large-scale transformational projects from major corporate clients. Despite these results, shares declined as investor sentiment was impacted by continued client caution amid heightened global uncertainty, including concerns around tariffs and consumer sentiment, as well as the U.S. administration’s initiative to streamline federal operations, which could result in canceled or delayed government contracts. We believe Accenture is well-positioned to support the federal government’s efficiency goals through its expertise and proven track record in delivering innovative, cost-effective solutions. Accenture has also continued to see traction in emerging areas such as generative AI, securing $1.4 billion in new bookings and generating approximately $600 million in related revenue during the quarter. Short-term fluctuations in consulting demand are not unusual, and we remain confident that Accenture’s global scale and deep expertise make it well-positioned to continue to provide solutions and deepen its partnerships with many of the world’s largest companies as they continue to implement increasingly sophisticated technologies.
Munich Re, the world’s largest reinsurance company, was a leading contributor for the quarter. The company delivered strong results despite absorbing €1.2 billion in claims from January’s California wildfires, a testament to the reinsurer’s prudent risk management. Demonstrating confidence in its ongoing profitability and robust capital position, Munich Re also raised its dividend by more than 30% and announced an expanded €2 billion share buyback program. Favorable market pricing and disciplined underwriting have continued to support profitability, even amid elevated volatility in capital markets and global catastrophe losses. Additionally, Munich Re’s experienced leadership team has placed an unusual emphasis on innovation for a reinsurer of its size, investing meaningfully in R&D and technology. For example, the company has identified, launched or already implemented over 300 AI use cases that aim to increase efficiency and enhance its competitive edge. We expect these initiatives to further support Munich Re’s continued market share gains across specialty lines, including cybersecurity, and in rapidly growing Asian markets where insurance penetration remains relatively low.
Sony, the global leader in video games, image sensors, music and movies, was a top contributor for the period. The company delivered strong quarterly results, driven primarily by its gaming and music businesses, and announced a new executive leadership structure. In gaming, Sony reported a record-high 129 million monthly active users, a 20% year-over-year increase in PlayStation Plus revenue and an expanding user base, as 40% of new PS5 console buyers were new to the platform. The Music segment also continued to benefit from global streaming tailwinds, delivering double-digit profit growth. In a significant leadership transition, Sony announced that, effective April 1, 2025, Hiroki Totoki, currently COO and CFO, would succeed Kenichiro Yoshida as CEO. Our original investment in Sony was grounded in the strategic transformation led by Yoshida-san, where Totoki-san was an instrumental partner in driving Sony’s pivot away from commoditized businesses whilespearheading investments in content IP and semiconductors. Looking ahead, we continue to see opportunity for Sony to capitalize on its unique position as both a content creator and platform owner. The company’s ability to integrate gaming, music, anime and film and leverage IP across platforms (e.g., Crunchyroll and its recent partnership with Kadokawa) should position it well for long-term value creation.
Recent Portfolio Activity
Buys
Sells
Fast Retailing
Magna International
During the quarter, we sold our position in Magna International and invested in Fast Retailing.
We first invested in Magna International, a Canada-based global auto parts, systems and assembly company, in the fourth quarter of 2019. The company, in our opinion, has a unique capability of supplying parts for an increasingly electrified and autonomous fleet of vehicles. This includes Magna’s specialty in lightweighting vehicles—a necessity for heavy electric cars—as well as its years of investment in self-driving technologies. In addition, with leading market share positions in many of its core markets and products, we believe Magna remains well-positioned to benefit as content-per-vehicle increases and automotive parts and systems become more complex. Though the company continues to meet our Quality and Valuation criteria, we have diminished confidence in its Catalysts. As such, we exited our position in Magna to fund the purchase of Fast Retailing, which we view as a more optimal investment.
Fast RetailingCo., Ltd.
Founded in 1984 and headquartered in Japan, Fast Retailing is one of the world’s largest apparel companies. Best known for its flagship brand UNIQLO, the company has over 3,500 stores worldwide, generating approximately 40% of sales in Japan, 20% in China and the remainder across the U.S., Europe and other Asian markets. UNIQLO (originally “Unique Clothing Warehouse”) accounts for roughly 85% of sales, with the remaining 15% coming from brands such as GU, Theory and others.
Fast Retailing is often grouped with “fast fashion” competitors such as Zara (owned by Inditex) and H&M. However, Fast Retailing’s strategy is fundamentally different. While fast fashion brands focus on rapidly turning over the latest trends—often at the expense of quality—Fast Retailing emphasizes timeless, high-quality apparel at accessible prices. Its LifeWear philosophy prioritizes functionality, comfort and durability, with innovations such as HeatTech for warmth and AIRism for breathability making its clothes essential wardrobe staples rather than disposable fashion. This focus on innovation, quality and affordability has helped Fast Retailing build a globally recognized brand with a history of profitable expansion in and outside Japan.
While this is our first time investing in Fast Retailing, we have followed the company for over a decade, having previously invested in Toray Industries, which produces many of the proprietary fabrics that underpin UNIQLO’s appeal. Given its long-term growth potential and operational strengths, we believe now is the right time to invest.
High-Quality Business
Some of the quality characteristics we have identified for Fast Retailing include:
Economies of scale achieved with a strategy that focuses on functionality, quality and value (rather than rapidly changing fashion trends) contribute to above peer profitability;
Globally recognized brand with a history of profitable expansion within Japan and internationally;
Technology-driven innovation in materials, inventory, logistics and supply chain management; and
Long-tenured management team with unusually high insider ownership.
Attractive Valuation
Based on our estimates, shares of the company are attractively valued. We believe continued overseas expansion, as well as other catalysts (see below), will likely lead to higher normalized margins and FREE cash flow than currently appreciated by the market.
Catalysts
Catalysts we have identified for Fast Retailing, which we believe will cause its stock price to appreciate over our three- to five-year investment horizon, include:
Continued overseas expansion should drive higher normalized revenue and profitability;
Operational improvements in China, including better inventory management and an optimized store footprint, are expected to enhance margins; and
Improved performance at GU brand in Asia, as well as expansion into the U.S.
Conclusion
As we progress through the early stages of 2025, the convergence of persistent macroeconomic forces with the renewed presence of trade conflicts has added to the uncertainty facing equity markets. While there certainly was no shortage of headlines during the quarter, we believe trying to time the market or to predict the impact of these developments is a futile task. Instead, our focus remains on evaluating whether these events are truly analyzable, materially differentiated and meaningful to long-term investors—or simply noise that fuels short-term speculation.
At Aristotle Capital, we do not aim to capture short-term gains by “trading” portfolios based on the news of the day. Rather, we remain committed to identifying companies we believe exhibit high-quality characteristics and the resilience to perform across full market cycles. In our experience, breaking news is often fleeting and not quite as impactful as many market participants believe it to be. On the contrary, during periods of economic uncertainty high-quality companies are oftentimes able to make decisions that result in market share gains, thus, potentially, increasing their longer-term intrinsic worth. As such, we will continue to study the microeconomic decisions of individual businesses rather than attempt to predict macroeconomic events or outcomes.
Disclosures
The opinions expressed herein are those of Aristotle Capital Management, LLC (Aristotle Capital) and are subject to change without notice. Past performance is not a guarantee or indicator of future results. This material is not financial advice or an offer to buy or sell any product. You should not assume that any of the securities transactions, sectors or holdings discussed in this report were or will be profitable, or that recommendations Aristotle Capital makes in the future will be profitable or equal the performance of the securities listed in this report. The portfolio characteristics shown relate to the Aristotle International Equity ADR strategy. Not every client’s account will have these characteristics. Aristotle Capital reserves the right to modify its current investment strategies and techniques based on changing market dynamics or client needs. There is no assurance that any securities discussed herein will remain in an account’s portfolio at the time you receive this report or that securities sold have not been repurchased. The securities discussed may not represent an account’s entire portfolio and, in the aggregate, may represent only a small percentage of an account’s portfolio holdings. The performance attribution presented is of a representative account from Aristotle Capital’s International Equity ADR strategy. The representative account is a discretionary client account which was chosen to most closely reflect the investment style of the strategy. The criteria used for representative account selection is based on the account’s period of time under management and its similarity of holdings in relation to the strategy. Recommendations made in the last 12 months are available upon request.
Composite returns are presented pure gross and net of the maximum wrap fee and include the reinvestment of all income. Pure gross returns do not reflect the deduction of any trading costs or other fees and are supplemental to the net returns. Net returns are calculated by subtracting the highest applicable wrap/SMA fee, which includes trading costs and custodial fees, from the pure gross composite return. (From inception to 12/31/2015, the highest applicable wrap/SMA fee is 3.00% on an annual basis, or 0.75% quarterly. From 1/1/2016 to 12/31/2023, the highest applicable wrap/SMA fee is 2.00% on an annual basis, or 0.50% quarterly and 0.17% monthly from 1/1/2024 to present.)
All investments carry a certain degree of risk, including the possible loss of principal. Investments are also subject to political, market, currency and regulatory risks or economic developments. International investments involve special risks that may in particular cause a loss in principal, including currency fluctuation, lower liquidity, different accounting methods and economic and political systems, and higher transaction costs. These risks typically are greater in emerging markets. Securities of small‐ and medium‐sized companies tend to have a shorter history of operations, be more volatile and less liquid. Value stocks can perform differently from the market as a whole and other types of stocks.
The material is provided for informational and/or educational purposes only and is not intended to be and should not be construed as investment, legal or tax advice and/or a legal opinion. Investors should consult their financial and tax adviser before making investments. The opinions referenced are as of the date of publication, may be modified due to changes in the market or economic conditions, and may not necessarily come to pass. Information and data presented has been developed internally and/or obtained from sources believed to be reliable. Aristotle Capital does not guarantee the accuracy, adequacy or completeness of such information.
Aristotle Capital Management, LLC is an independent registered investment adviser under the Advisers Act of 1940, as amended. Registration does not imply a certain level of skill or training. More information about Aristotle Capital, including our investment strategies, fees and objectives, can be found in our Form ADV Part 2, which is available upon request. ACM-2504-128
Performance Disclosures
Sources: CAPS CompositeHubTM, MSCI
Composite returns for all periods ended March 31, 2025 are preliminary pending final account reconciliation.
Past performance is not indicative of future results. The information provided should not be considered financial advice or a recommendation to purchase or sell any particular security or product. Performance results for periods greater than one year have been annualized.
The Aristotle International Equity ADR WM Composite has an inception date of 7/1/2012. As of 1/1/2024, the composite was renamed from the International Equity ADR Wrap Composite.
Composite returns are presented pure gross and net of the maximum wrap fee and include the reinvestment of all income. Pure gross returns do not reflect the deduction of any trading costs or other fees and are supplemental to the net returns. Net returns are calculated by subtracting the highest applicable wrap/SMA fee, which includes trading costs and custodial fees, from the pure gross composite return. (From inception to 12/31/2015, the highest applicable wrap/SMA fee is 3.00% on an annual basis, or 0.75% quarterly. From 1/1/2016 to 12/31/2023, the highest applicable wrap/SMA fee is 2.00% on an annual basis, or 0.50% quarterly and 0.17% monthly from 1/1/2024 to present.)
Index Disclosures
The MSCI EAFE Index (Europe, Australasia, Far East) is a free float-adjusted market capitalization-weighted index that is designed to measure the equity market performance of developed markets, excluding the United States and Canada. The MSCI EAFE Index consists of the following 21 developed market country indexes: Australia, Austria, Belgium, Denmark, Finland, France, Germany, Hong Kong, Ireland, Israel, Italy, Japan, the Netherlands, New Zealand, Norway, Portugal, Singapore, Spain, Sweden, Switzerland and the United Kingdom. The MSCI ACWI captures large and mid-cap representation across 23 developed market countries and 24 emerging markets countries. With approximately 2,600 constituents, the Index covers approximately 85% of the global investable equity opportunity set. The MSCI ACWI Growth Index captures large and mid-cap securities exhibiting overall growth style characteristics across 23 developed markets countries and 24 emerging markets countries. The MSCI ACWI Value Index captures large and mid-cap securities exhibiting overall value style characteristics across 23 developed markets countries and 24 emerging markets countries. The MSCI ACWI ex USA Index captures large and mid-cap representation across 22 of 23 developed markets countries (excluding the United States) and 24 emerging markets countries. With approximately 2,000 constituents, the Index covers approximately 85% of the global equity opportunity set outside the United States. The MSCI Emerging Markets Index is a free float-adjusted market capitalization-weighted index that is designed to measure the equity market performance of emerging markets. The MSCI Emerging Markets Index consists of the following 24 emerging market country indexes: Brazil, Chile, China, Colombia, Czech Republic, Egypt, Greece, Hungary, India, Indonesia, Korea, Kuwait, Malaysia, Mexico, Peru, Philippines, Poland, Qatar, Saudi Arabia, South Africa, Taiwan, Thailand, Turkey and United Arab Emirates. The S&P 500® Index is the Standard & Poor’s Composite Index of 500 stocks and is a widely recognized, unmanaged index of common stock prices. The Brent Crude Oil Index is a major trading classification of sweet light crude oil that serves as a major benchmark price for purchases of oil worldwide. The MSCI Japan Index is designed to measure the performance of the large and mid-cap segments of the Japanese market. With approximately 200 constituents, the Index covers approximately 85% of the free float-adjusted market capitalization in Japan. The Bloomberg Global Aggregate Bond Index is a flagship measure of global investment grade debt from 27 local currency markets. This multi-currency benchmark includes treasury, government-related, corporate and securitized fixed-rate bonds from both developed and emerging markets issuers. The MSCI United Kingdom Index is designed to measure the performance of the large and mid-cap segments of the U.K. market. With nearly 100 constituents, the Index covers approximately 85% of the free float-adjusted market capitalization in the United Kingdom. The MSCI Europe Index captures large and mid-cap representation across 15 developed markets countries in Europe. With approximately 400 constituents, the Index covers approximately 85% of the free float-adjusted market capitalization across the European developed markets equity universe. These indexes have been selected as the benchmarks and are used for comparison purposes only. The volatility (beta) of the Composite may be greater or less than the respective benchmarks. It is not possible to invest directly in these indexes.
Related Resources
For more on International Equity, access the latest resources.
(All MSCI index returns are shown net and in U.S. dollars unless otherwise noted.)
Markets Review
Sources: CAPS CompositeHubTM, Bloomberg Past performance is not indicative of future results. Aristotle International Equity ADR Composite returns are presented gross and net of investment advisory fees and include the reinvestment of all income. Gross returns will be reduced by fees and other expenses that may be incurred in the management of the account. Net returns are presented net of actual investment advisory fees and after the deduction of all trading expenses. Aristotle Capital Composite returns are preliminary pending final account reconciliation. Please see important disclosures at the end of this document.
Global equity markets started the year on a modestly negative note, with the MSCI ACWI Index returning ‑1.32% for the first quarter. In contrast, global fixed income gained ground, as the Bloomberg Global Aggregate Bond Index rose 2.64%. Value stocks outpaced growth over the quarter, with the MSCI ACWI Value Index outperforming the MSCI ACWI Growth Index by 11.59%.
Outside the U.S., international equities made strong gains versus their American counterparts. The MSCI EAFE Index rose 6.86% during the first quarter, while the MSCI ACWI ex USA Index climbed 5.23%. Within the MSCI EAFE Index, Europe & Middle East and the U.K. were the strongest performers, while Asia increased the least. On a sector basis, nine out of the eleven sectors within the MSCI EAFE Index posted positive returns, with Energy, Financials and Utilities generating the largest gains. Conversely, Information Technology, Consumer Discretionary and Real Estate performed the worst.
Inflation trends remained broadly stable across developed markets. The U.S., U.K., and EU all reported annual inflation below 3%, giving central banks greater flexibility. The Federal Reserve held rates steady, while the European Central Bank and Bank of England continued to ease monetary policy in response to softer growth signals. In Asia, China’s economy recorded 5% GDP growth in 2024, showing tentative signs of recovery, while the Bank of Japan raised interest rates for the third time since ending its negative interest rate policy in March 2024 on expectations of sustained 2% inflation.
Trade policy re-emerged as a market concern during the quarter. In his first months back in office, President Trump announced a new wave of tariffs on imports from Canada, Mexico and China, with additional warnings directed at the EU and other trading partners over what were termed “imbalanced trade arrangements.” The targeted industries—autos, steel and aluminum—reflected a focus on reshoring and industrial policy. While the long-term impact is still unfolding, the renewed trade uncertainty prompted central banks to lower growth forecasts and adopt a more cautious tone on future rate moves.
In Europe, Germany’s economy remained under pressure after contracting for a second consecutive year in 2024—the first two-year contraction since 2003. In response, Chancellor-designate Friedrich Merz proposed sweeping fiscal reforms, including an overhaul of the constitutional debt brake, a €500 billion infrastructure fund and increased defense spending. While potentially supportive of medium-term growth, these initiatives have raised concerns around inflation and fiscal discipline, adding complexity to the European Central Bank’s policy path.
On the geopolitical front, a fragile ceasefire between Israel and Hamas in January unraveled by March amid disagreements over hostage releases. In Ukraine, a military stalemate in the east opened the door for ceasefire negotiations brokered by the U.S., with discussions reportedly tied to a potential minerals agreement to offset financial aid.
Finally, the artificial intelligence (AI) theme continued to influence market narratives. Chinese startup DeepSeek gained international attention after launching a low-cost rival to leading generative AI models from OpenAI, Anthropic and Google. The move not only intensified competition but raised new questions about the durability and configuration of global AI supply chains. Notably, DeepSeek’s approach—achieving comparable performance at a fraction of the cost—has challenged assumptions around the infrastructure demands of generative AI, potentially reducing the need for GPUs, energy-intensive data centers and the broader hardware stack the market had expected would underpin AI growth.
Performance and Attribution Summary
For the first quarter of 2025, Aristotle Capital’s International Equity ADR Composite posted a total return of 4.05% gross of fees (3.91% net of fees), underperforming the MSCI EAFE Index, which returned 6.86%, and the MSCI ACWI ex USA Index, which returned 5.23%. Please refer to the table below for detailed performance.
Performance (%)
1Q25
1 Year
3 Years
5 Years
10 Years
Since Inception*
International Equity ADR Composite (gross)
4.05
7.65
6.46
13.28
6.73
6.50
International Equity ADR Composite (net)
3.91
7.12
5.91
12.72
6.22
5.99
MSCI EAFE Index (net)
6.86
4.88
6.05
11.77
5.40
5.66
MSCI ACWI ex USA Index (net)
5.23
6.09
4.48
10.92
4.98
5.01
*The inception date for the International Equity ADR Composite is June 1, 2013. Past performance is not indicative of future results. Aristotle International Equity ADR Composite returns are presented gross and net of investment advisory fees and include the reinvestment of all income. Gross returns will be reduced by fees and other expenses that may be incurred in the management of the account. Net returns are presented net of actual investment advisory fees and after the deduction of all trading expenses. Aristotle Capital Composite returns are preliminary pending final account reconciliation. Please see important disclosures at the end of this document.
Source: FactSet Past performance is not indicative of future results. Attribution results are based on sector returns which are gross of investment advisory fees. Attribution is based on performance that is gross of investment advisory fees and includes the reinvestment of income.
From a sector perspective, the portfolio’s underperformance relative to the MSCI EAFE Index can be attributed to both security selection and allocation effects. Security selection in Energy, Financials and Industrials detracted the most from the portfolio’s relative performance. Conversely, security selection in Health Care and Consumer Discretionary, as well as an underweight in Information Technology, contributed to relative returns.
Regionally, both allocation effects and security selection were responsible for the portfolio’s underperformance. Exposure to Canada and security selection in the U.K. detracted the most from relative performance, while security selection and an underweight in Asia contributed.
Contributors and Detractors for 1Q 2025
Relative Contributors
Relative Detractors
ING Groep
Cameco
Safran
Brookfield
Munich Reinsurance
Accenture
Sony
Diageo
Roche
Ashtead Group
Cameco, one of the world’s largest uranium producers, was a primary detractor during the quarter. Shares of the Canada-based company declined following President Trump’s 10% tariff on Canadian energy exports to the U.S., where Cameco is a major uranium supplier. However, we believe these tariff concerns are overstated given the inelastic nature of uranium demand and the lack of substitutes. Any incremental costs would be absorbed by utilities under existing contract structures. While the company’s stock price may have followed the decline in uranium spot prices during the period, Cameco’s business is largely insulated from short-term price swings due to its extensive use of long-term contracts rather than spot-market sales. Moreover, the company’s tier-one assets in politically stable jurisdictions, operational track record and ability to flex production—particularly at its MacArthur River and Key Lake mines—further strengthen its competitive advantage. We believe Cameco remains exceptionally well-positioned to benefit as governments around the world increasingly turn to nuclear power as a clean, secure and scalable source of energy.
Accenture, the global IT services and consulting firm, was one of the largest detractors during the period. The company reported revenue at the top end of its guided range, supported by solid booking, particularly in large-scale transformational projects from major corporate clients. Despite these results, shares declined as investor sentiment was impacted by continued client caution amid heightened global uncertainty, including concerns around tariffs and consumer sentiment, as well as the U.S. administration’s initiative to streamline federal operations, which could result in canceled or delayed government contracts. We believe Accenture is well-positioned to support the federal government’s efficiency goals through its expertise and proven track record in delivering innovative, cost-effective solutions. Accenture has also continued to see traction in emerging areas such as generative AI, securing $1.4 billion in new bookings and generating approximately $600 million in related revenue during the quarter. Short-term fluctuations in consulting demand are not unusual, and we remain confident that Accenture’s global scale and deep expertise make it well-positioned to continue to provide solutions and deepen its partnerships with many of the world’s largest companies as they continue to implement increasingly sophisticated technologies.
Munich Re, the world’s largest reinsurance company, was a leading contributor for the quarter. The company delivered strong results despite absorbing €1.2 billion in claims from January’s California wildfires, a testament to the reinsurer’s prudent risk management. Demonstrating confidence in its ongoing profitability and robust capital position, Munich Re also raised its dividend by more than 30% and announced an expanded €2 billion share buyback program. Favorable market pricing and disciplined underwriting have continued to support profitability, even amid elevated volatility in capital markets and global catastrophe losses. Additionally, Munich Re’s experienced leadership team has placed an unusual emphasis on innovation for a reinsurer of its size, investing meaningfully in R&D and technology. For example, the company has identified, launched or already implemented over 300 AI use cases that aim to increase efficiency and enhance its competitive edge. We expect these initiatives to further support Munich Re’s continued market share gains across specialty lines, including cybersecurity, and in rapidly growing Asian markets where insurance penetration remains relatively low.
Sony, the global leader in video games, image sensors, music and movies, was a top contributor for the period. The company delivered strong quarterly results, driven primarily by its gaming and music businesses, and announced a new executive leadership structure. In gaming, Sony reported a record-high 129 million monthly active users, a 20% year-over-year increase in PlayStation Plus revenue and an expanding user base, as 40% of new PS5 console buyers were new to the platform. The Music segment also continued to benefit from global streaming tailwinds, delivering double-digit profit growth. In a significant leadership transition, Sony announced that, effective April 1, 2025, Hiroki Totoki, currently COO and CFO, would succeed Kenichiro Yoshida as CEO. Our original investment in Sony was grounded in the strategic transformation led by Yoshida-san, where Totoki-san was an instrumental partner in driving Sony’s pivot away from commoditized businesses whilespearheading investments in content IP and semiconductors. Looking ahead, we continue to see opportunity for Sony to capitalize on its unique position as both a content creator and platform owner. The company’s ability to integrate gaming, music, anime and film and leverage IP across platforms (e.g., Crunchyroll and its recent partnership with Kadokawa) should position it well for long-term value creation.
Recent Portfolio Activity
Buys
Sells
Fast Retailing
Magna International
During the quarter, we sold our position in Magna International and invested in Fast Retailing.
We first invested in Magna International, a Canada-based global auto parts, systems and assembly company, in the fourth quarter of 2019. The company, in our opinion, has a unique capability of supplying parts for an increasingly electrified and autonomous fleet of vehicles. This includes Magna’s specialty in lightweighting vehicles—a necessity for heavy electric cars—as well as its years of investment in self-driving technologies. In addition, with leading market share positions in many of its core markets and products, we believe Magna remains well-positioned to benefit as content-per-vehicle increases and automotive parts and systems become more complex. Though the company continues to meet our Quality and Valuation criteria, we have diminished confidence in its Catalysts. As such, we exited our position in Magna to fund the purchase of Fast Retailing, which we view as a more optimal investment.
Fast RetailingCo., Ltd.
Founded in 1984 and headquartered in Japan, Fast Retailing is one of the world’s largest apparel companies. Best known for its flagship brand UNIQLO, the company has over 3,500 stores worldwide, generating approximately 40% of sales in Japan, 20% in China and the remainder across the U.S., Europe and other Asian markets. UNIQLO (originally “Unique Clothing Warehouse”) accounts for roughly 85% of sales, with the remaining 15% coming from brands such as GU, Theory and others.
Fast Retailing is often grouped with “fast fashion” competitors such as Zara (owned by Inditex) and H&M. However, Fast Retailing’s strategy is fundamentally different. While fast fashion brands focus on rapidly turning over the latest trends—often at the expense of quality—Fast Retailing emphasizes timeless, high-quality apparel at accessible prices. Its LifeWear philosophy prioritizes functionality, comfort and durability, with innovations such as HeatTech for warmth and AIRism for breathability making its clothes essential wardrobe staples rather than disposable fashion. This focus on innovation, quality and affordability has helped Fast Retailing build a globally recognized brand with a history of profitable expansion in and outside Japan.
While this is our first time investing in Fast Retailing, we have followed the company for over a decade, having previously invested in Toray Industries, which produces many of the proprietary fabrics that underpin UNIQLO’s appeal. Given its long-term growth potential and operational strengths, we believe now is the right time to invest.
High-Quality Business
Some of the quality characteristics we have identified for Fast Retailing include:
Economies of scale achieved with a strategy that focuses on functionality, quality and value (rather than rapidly changing fashion trends) contribute to above peer profitability;
Globally recognized brand with a history of profitable expansion within Japan and internationally;
Technology-driven innovation in materials, inventory, logistics and supply chain management; and
Long-tenured management team with unusually high insider ownership.
Attractive Valuation
Based on our estimates, shares of the company are attractively valued. We believe continued overseas expansion, as well as other catalysts (see below), will likely lead to higher normalized margins and FREE cash flow than currently appreciated by the market.
Catalysts
Catalysts we have identified for Fast Retailing, which we believe will cause its stock price to appreciate over our three- to five-year investment horizon, include:
Continued overseas expansion should drive higher normalized revenue and profitability;
Operational improvements in China, including better inventory management and an optimized store footprint, are expected to enhance margins; and
Improved performance at GU brand in Asia, as well as expansion into the U.S.
Conclusion
As we progress through the early stages of 2025, the convergence of persistent macroeconomic forces with the renewed presence of trade conflicts has added to the uncertainty facing equity markets. While there certainly was no shortage of headlines during the quarter, we believe trying to time the market or to predict the impact of these developments is a futile task. Instead, our focus remains on evaluating whether these events are truly analyzable, materially differentiated and meaningful to long-term investors—or simply noise that fuels short-term speculation.
At Aristotle Capital, we do not aim to capture short-term gains by “trading” portfolios based on the news of the day. Rather, we remain committed to identifying companies we believe exhibit high-quality characteristics and the resilience to perform across full market cycles. In our experience, breaking news is often fleeting and not quite as impactful as many market participants believe it to be. On the contrary, during periods of economic uncertainty high-quality companies are oftentimes able to make decisions that result in market share gains, thus, potentially, increasing their longer-term intrinsic worth. As such, we will continue to study the microeconomic decisions of individual businesses rather than attempt to predict macroeconomic events or outcomes.
Disclosures
The opinions expressed herein are those of Aristotle Capital Management, LLC (Aristotle Capital) and are subject to change without notice. Past performance is not a guarantee or indicator of future results. This material is not financial advice or an offer to buy or sell any product. You should not assume that any of the securities transactions, sectors or holdings discussed in this report were or will be profitable, or that recommendations Aristotle Capital makes in the future will be profitable or equal the performance of the securities listed in this report. The portfolio characteristics shown relate to the Aristotle International Equity ADR strategy. Not every client’s account will have these characteristics. Aristotle Capital reserves the right to modify its current investment strategies and techniques based on changing market dynamics or client needs. There is no assurance that any securities discussed herein will remain in an account’s portfolio at the time you receive this report or that securities sold have not been repurchased. The securities discussed may not represent an account’s entire portfolio and, in the aggregate, may represent only a small percentage of an account’s portfolio holdings. The performance attribution presented is of a representative account from Aristotle Capital’s International Equity ADR Composite. The representative account is a discretionary client account which was chosen to most closely reflect the investment style of the strategy. The criteria used for representative account selection is based on the account’s period of time under management and its similarity of holdings in relation to the strategy. Recommendations made in the last 12 months are available upon request.
Returns are presented gross and net of investment advisory fees and include the reinvestment of all income. Gross returns will be reduced by fees and other expenses that may be incurred in the management of the account. Net returns are presented net of actual investment advisory fees and after the deduction of all trading expenses.
All investments carry a certain degree of risk, including the possible loss of principal. Investments are also subject to political, market, currency and regulatory risks or economic developments. International investments involve special risks that may in particular cause a loss in principal, including currency fluctuation, lower liquidity, different accounting methods and economic and political systems, and higher transaction costs. These risks typically are greater in emerging markets. Securities of small‐ and medium‐sized companies tend to have a shorter history of operations, be more volatile and less liquid. Value stocks can perform differently from the market as a whole and other types of stocks.
The material is provided for informational and/or educational purposes only and is not intended to be and should not be construed as investment, legal or tax advice and/or a legal opinion. Investors should consult their financial and tax adviser before making investments. The opinions referenced are as of the date of publication, may be modified due to changes in the market or economic conditions, and may not necessarily come to pass. Information and data presented has been developed internally and/or obtained from sources believed to be reliable. Aristotle Capital does not guarantee the accuracy, adequacy or completeness of such information.
Aristotle Capital Management, LLC is an independent registered investment adviser under the Advisers Act of 1940, as amended. Registration does not imply a certain level of skill or training. More information about Aristotle Capital, including our investment strategies, fees and objectives, can be found in our Form ADV Part 2, which is available upon request. ACM-2504-102
Performance Disclosures
Sources: CAPS CompositeHubTM, MSCI
Composite returns for all periods ended March 31, 2025 are preliminary pending final account reconciliation.
Past performance is not indicative of future results. The information provided should not be considered financial advice or a recommendation to purchase or sell any particular security or product. Performance results for periods greater than one year have been annualized.
Returns are presented gross and net of investment advisory fees and include the reinvestment of all income. Gross returns will be reduced by fees and other expenses that may be incurred in the management of the account. Net returns are presented net of actual investment advisory fees and after the deduction of all trading expenses.
Index Disclosures
The MSCI EAFE Index (Europe, Australasia, Far East) is a free float-adjusted market capitalization-weighted index that is designed to measure the equity market performance of developed markets, excluding the United States and Canada. The MSCI EAFE Index consists of the following 21 developed market country indexes: Australia, Austria, Belgium, Denmark, Finland, France, Germany, Hong Kong, Ireland, Israel, Italy, Japan, the Netherlands, New Zealand, Norway, Portugal, Singapore, Spain, Sweden, Switzerland and the United Kingdom. The MSCI ACWI captures large and mid-cap representation across 23 developed market countries and 24 emerging markets countries. With approximately 2,600 constituents, the Index covers approximately 85% of the global investable equity opportunity set. The MSCI ACWI Growth Index captures large and mid-cap securities exhibiting overall growth style characteristics across 23 developed markets countries and 24 emerging markets countries. The MSCI ACWI Value Index captures large and mid-cap securities exhibiting overall value style characteristics across 23 developed markets countries and 24 emerging markets countries. The MSCI ACWI ex USA Index captures large and mid-cap representation across 22 of 23 developed markets countries (excluding the United States) and 24 emerging markets countries. With approximately 2,000 constituents, the Index covers approximately 85% of the global equity opportunity set outside the United States. The MSCI Emerging Markets Index is a free float-adjusted market capitalization-weighted index that is designed to measure the equity market performance of emerging markets. The MSCI Emerging Markets Index consists of the following 24 emerging market country indexes: Brazil, Chile, China, Colombia, Czech Republic, Egypt, Greece, Hungary, India, Indonesia, Korea, Kuwait, Malaysia, Mexico, Peru, Philippines, Poland, Qatar, Saudi Arabia, South Africa, Taiwan, Thailand, Turkey and United Arab Emirates. The S&P 500® Index is the Standard & Poor’s Composite Index of 500 stocks and is a widely recognized, unmanaged index of common stock prices. The Brent Crude Oil Index is a major trading classification of sweet light crude oil that serves as a major benchmark price for purchases of oil worldwide. The MSCI Japan Index is designed to measure the performance of the large and mid-cap segments of the Japanese market. With approximately 200 constituents, the Index covers approximately 85% of the free float-adjusted market capitalization in Japan. The Bloomberg Global Aggregate Bond Index is a flagship measure of global investment grade debt from 27 local currency markets. This multi-currency benchmark includes treasury, government-related, corporate and securitized fixed-rate bonds from both developed and emerging markets issuers. The MSCI United Kingdom Index is designed to measure the performance of the large and mid-cap segments of the U.K. market. With nearly 100 constituents, the Index covers approximately 85% of the free float-adjusted market capitalization in the United Kingdom. The MSCI Europe Index captures large and mid-cap representation across 15 developed markets countries in Europe. With approximately 400 constituents, the Index covers approximately 85% of the free float-adjusted market capitalization across the European developed markets equity universe. These indexes have been selected as the benchmarks and are used for comparison purposes only. The volatility (beta) of the Composite may be greater or less than the respective benchmarks. It is not possible to invest directly in these indexes.
The U.S. equity market began 2025 with a modest decline, with the S&P 500 Index falling 4.27% during the first quarter. In contrast, bonds provided a measure of stability, as the Bloomberg U.S. Aggregate Bond Index rose 2.78%.
Sources: CAPS CompositeHubTM, Bloomberg Past performance is not indicative of future results. Aristotle Atlantic Focus Growth Composite returns are presented gross and net of investment advisory fees and include the reinvestment of all income. Gross returns will be reduced by fees and other expenses that may be incurred in the management of the account. Net returns are presented net of actual investment advisory fees and after the deduction of all trading expenses. Aristotle Atlantic Composite returns are preliminary pending final account reconciliation. Please see important disclosures at the end of this document.
On a sector basis, negative performance was led by four of the eleven sectors within the Russell 1000 Growth Index in the first quarter of 2025. The weakest sectors were Consumer Discretionary and Information Technology. The best-performing sectors were Energy and Real Estate.
U.S. economic data reported during the quarter presented a mixed picture. Real GDP growth slowed to an annualized rate of 2.4%, while inflation remained stable. The Consumer Price Index (CPI) rose 2.8% year-over-year in February, reflecting moderate inflationary pressures. Meanwhile, the labor market remained resilient, with the unemployment rate hovering around 4%. However, consumer strength showed signs of strain, as retail sales slowed from levels seen late last year, potentially impacted by adverse weather and broader macroeconomic uncertainty.
Trade policy was a major source of uncertainty during the quarter. President Trump announced a series of new tariffs on imports from Canada, Mexico and China, citing concerns over illegal immigration, drug trafficking and intellectual property theft. Targeted industries included autos, steel, aluminum and energy, particularly Venezuelan oil. While tariffs initially raised concerns, the administration’s selective enforcement and flexible implementation approach helped ease market anxiety. In response to the evolving economic landscape, the Federal Reserve (Fed) maintained its target range for the federal funds rate at 4.25% to 4.50%. The central bank acknowledged potential inflationary pressures from tariffs and moderated expectations for economic growth in 2025.
Despite broader economic headwinds, corporate earnings remained strong. S&P 500 companies reported impressive 17.8% year-over-year earnings growth, the highest rate since 2021. However, tariff-related uncertainties loomed large, with more than 220 companies referencing tariffs in their earnings calls and nearly 15% issuing negative earnings guidance.
On the domestic front, a government shutdown was averted, as President Trump signed a six-month funding bill. Senate Democratic Leader Chuck Schumer supported the measure, believing that a shutdown would have allowed the Department of Government Efficiency (DOGE) to terminate government services at a faster rate.
Geopolitically, the U.S. continued its mediation efforts in the Middle East and Ukraine. While a temporary ceasefire agreement was reached between Israel and Hamas in January, tensions flared again in March over disputes regarding hostage releases in Gaza. In Ukraine, U.S. aid was briefly paused following a contentious White House meeting between presidents Trump and Zelensky. Financial and intelligence support resumed after Ukraine signaled it was open to a ceasefire and agreed to revisit terms of a potential mineral deal, aiming to offset the costs of U.S. assistance.
Performance and Attribution Summary
For the first quarter of 2025, Aristotle Atlantic’s Focus Growth Composite posted a total return of -8.47% gross of fees (-8.50% net of fees), outperforming the -9.97% total return of the Russell 1000 Growth Index.
Performance (%)
1Q25
1 Year
3 Years
5 Years
Since Inception*
Focus Growth Composite (gross)
-8.47
7.50
6.22
15.67
12.90
Focus Growth Composite (net)
-8.50
7.40
6.11
15.56
12.68
Russell 1000 Growth Index
-9.97
7.76
10.10
20.09
15.43
*The Focus Growth Composite has an inception date of March 1, 2018. Past performance is not indicative of future results. Aristotle Atlantic Focus Growth Composite returns are presented gross and net of investment advisory fees and include the reinvestment of all income. Gross returns will be reduced by fees and other expenses that may be incurred in the management of the account. Net returns are presented net of actual investment advisory fees and after the deduction of all trading expenses. Aristotle Atlantic Composite returns are preliminary pending final account reconciliation. Please see important disclosures at the end of this document.
Sources: FactSet Past performance is not indicative of future results. Sector attribution shows how much of a portfolio’s overall return is directly attributable to stock selection and asset allocation decisions within the portfolio, highlighting which sectors contributed or detracted to the total return. Attribution includes the reinvestment of income. Please see important disclosures at the end of this document.
During the first quarter, the portfolio’s outperformance relative to the Russell 1000 Growth Index was due to both security selection and allocation effects. An underweight in Consumer Discretionary combined with security selection in Financials contributed the most to relative returns. Conversely, security selection in Information Technology and Industrials detracted the most.
Contributors and Detractors for 1Q 2025
Relative Contributors
Relative Detractors
Visa
ServiceNow
Guardant Health
Bio-Techne
S&P Global
Eli Lilly
Costco Wholesale
Datadog
Adaptive Biotechnologies
Nvidia
Contributors
Visa
Visa was a relative contributor in the first quarter, driven by strong fourth quarter earnings supported by robust holiday-season consumer spending and sustained growth in payment volumes, trends that continued into January. The company also indicated optimism regarding potential benefits from a more favorable regulatory environment under the new presidential administration. Additionally, two of the company’s fastest-growing segments, New Flows and Value-Added Services, continued to achieve above-average growth, capitalizing on substantial and expanding market opportunities.
Guardant Health
Guardant Health was a relative contributor in the first quarter following several positive announcements and solid fourth quarter earnings. Guardant announced Advanced Diagnostic Laboratory Test (ADLT) pricing from Medicare on its Guardant Shield test and a contract with the VA hospital system to cover patients over 45 years of age. This follows strong momentum and positive full-year revenue guidance.
Detractors
ServiceNow
ServiceNow detracted from performance in the first quarter, as the company reported guidance during the fourth quarter earnings call that was below investor expectations. Investors have also begun to incorporate tougher macroeconomic headwinds and negative impacts from the DOGE government spending cuts into their weaker outlook for software revenue growth in 2025.
Bio-Techne
Bio-Techne detracted from performance in the first quarter on fears around National Institutes of Health (NIH) funding concerns. The Trump administration announced caps on administrative costs for NIH-funded research projects, and this has resulted in fears of a slowdown in the academic and government segment. Bio-Techne has recently stated that its view is, worst case, a possible 50 basis point headwind to growth. Bio-Techne has shown positive momentum following a strong fiscal second quarter earnings report that included organic revenue growth of 9%. remains strong.
Recent Portfolio Activity
The table below shows all buys and sells completed during the quarter, followed by a brief rationale.
Buys
Sells
Oracle
Datadog
CrowdStrike
Buys
Oracle
Oracle provides products and services that address enterprise information technology (IT) environments. The company’s products and services include enterprise applications and infrastructure offerings that are delivered worldwide through a variety of flexible and interoperable IT deployment models. The company operates in three segments: Cloud and License, Hardware, and Services.
We believe Oracle’s cloud infrastructure product, OCI 2.0, will continue to demonstrate strong revenue growth over several quarters. Additionally, we see the rapid growth of artificial intelligence (AI) computing needs as being a differentiated growth driver for Oracle. We believe that Oracle will continue to drive positive outcomes for the Cerner business through a better margin structure, as well as top-line sales synergies.
CrowdStrike
CrowdStrike provides cybersecurity products and services that offer endpoint protection and threat intelligence solutions, enabling customers to prevent damage from targeted attacks, detect advanced malware, and search all endpoints. The company’s open cloud architecture enables it and third-party partners to rapidly innovate, build and deploy new cloud modules that can provide customers with enhanced functionality across a myriad of use cases.
We see the cloud cybersecurity market as positioned to experience strong growth over the next few years, driven by continued migration from on-premises to cloud-based architecture. We believe CrowdStrike can benefit from this trend due to its early-mover advantage, multiple product offerings and native integrations with leading cloud platforms. The increasing threats from state-sanctioned cybercriminals using high-performance computing and AI necessitate higher spending on advanced cybersecurity products. The total addressable market (TAM) is projected to grow significantly over the next four calendar years. Additionally, CrowdStrike’s cloud-native architecture and unified platform approach provide competitive advantages, resulting in high customer retention and widespread adoption of multiple modules.
Sells
Datadog
We sold the position in Datadog following the company’s most recent quarterly results. We remain concerned about the loss of a key customer(s) in the AI development space and the impact that could have on Datadog’s growth rate. While the company is executing on its core business, we see a rising risk of a slowing top-line growth rate, which we believe would result in valuation compression and a negative impact on the stock performance.
Outlook
The equity markets in the first quarter declined as investors digested the potential impact of wide-ranging tariffs, along with concerns of a peak in the capital spending cycle around AI. Interest rates declined in the quarter, with the 10-year U.S. Treasury yield down about 35 basis points. The prospects of tariffs pushing prices higher could put the Fed on hold in a period when the economy starts to weaken. Economic data was mostly in line with expectations, reflecting a moderately growing economy. Although equity market valuations have pulled back, they are still in elevated territory with growing concerns of a slowdown in corporate profits. Our focus will continue to be at the company level, with an emphasis on seeking to invest in companies with secular tailwinds or strong product-driven cycles.
Disclosures
The opinions expressed herein are those of Aristotle Atlantic Partners, LLC (Aristotle Atlantic) and are subject to change without notice. Past performance is not a guarantee or indicator of future results. This material is not financial advice or an offer to purchase or sell any product. You should not assume that any of the securities transactions, sectors or holdings discussed in this report were or will be profitable, or that recommendations Aristotle Atlantic makes in the future will be profitable or equal the performance of the listed in this report. The portfolio characteristics shown relate to the Aristotle Atlantic Focus Growth strategy. Not every client’s account will have these characteristics. Aristotle Atlantic reserves the right to modify its current investment strategies and techniques based on changing market dynamics or client needs. There is no assurance that any securities discussed herein will remain in an account’s portfolio at the time you receive this report or that securities sold have not been repurchased. The securities discussed may not represent an account’s entire portfolio and, in the aggregate, may represent only a small percentage of an account’s portfolio holdings. The performance attribution presented is of a representative account from Aristotle Atlantic’s Focus Growth Composite. The representative account is a discretionary client account which was chosen to most closely reflect the investment style of the strategy. The criteria used for representative account selection is based on the account’s period of time under management and its similarity of holdings in relation to the strategy. Recommendations made in the last 12 months are available upon request. Returns are presented gross and net of investment advisory fees and include the reinvestment of all income. Gross returns will be reduced by fees and other expenses that may be incurred in the management of the account. Net returns are presented net of actual investment advisory fees and after the deduction of all trading expenses.
All investments carry a certain degree of risk, including the possible loss of principal. Investments are also subject to political, market, currency and regulatory risks or economic developments. International investments involve special risks that may in particular cause a loss in principal, including currency fluctuation, lower liquidity, different accounting methods and economic and political systems, and higher transaction costs. These risks typically are greater in emerging markets. Securities of small‐ and medium‐sized companies tend to have a shorter history of operations, be more volatile and less liquid. Value stocks can perform differently from the market as a whole and other types of stocks.
The material is provided for informational and/or educational purposes only and is not intended to be and should not be construed as investment, legal or tax advice and/or a legal opinion. Investors should consult their financial and tax adviser before making investments. The opinions referenced are as of the date of publication, may be modified due to changes in the market or economic conditions, and may not necessarily come to pass. Information and data presented has been developed internally and/or obtained from sources believed to be reliable. Aristotle Atlantic does not guarantee the accuracy, adequacy or completeness of such information.
Aristotle Atlantic Partners, LLC is an independent registered investment adviser under the Advisers Act of 1940, as amended. Registration does not imply a certain level of skill or training. More information about Aristotle Atlantic, including our investment strategies, fees and objectives, can be found in our Form ADV Part 2, which is available upon request. AAP-2504-27
Performance Disclosures
Sources: CAPS CompositeHubTM
Composite returns for all periods ended March 31, 2025 are preliminary pending final account reconciliation.
Past performance is not indicative of future results. Performance results for periods greater than one year have been annualized. Returns are presented gross and net of investment advisory fees and include the reinvestment of all income. Gross returns will be reduced by fees and other expenses that may be incurred in the management of the account. Net returns are presented net of actual investment advisory fees and after the deduction of all trading expenses.
Index Disclosures
The Russell 1000® Growth Index measures the performance of the large cap growth segment of the U.S. equity universe. It includes those Russell 1000 companies with higher price-to-book ratios and higher forecasted growth values. This index has been selected as the benchmark and is used for comparison purposes only. The Russell 1000® Value Index measures the performance of the large cap value segment of the U.S. equity universe. It includes those Russell 1000 companies with lower price-to-book ratios and lower expected growth values. The S&P 500® Index is the Standard & Poor’s Composite Index of 500 stocks and is a widely recognized, unmanaged index of common stock prices. The Russell 2000® Index measures the performance of the small cap segment of the U.S. equity universe. The Russell 2000 Index is a subset of the Russell 3000® Index representing approximately 10% of the total market capitalization of that index. It includes approximately 2,000 of the smallest securities based on a combination of their market cap and current index membership. The Dow Jones Industrial Average® is a price-weighted measure of 30 U.S. blue-chip companies. The Index covers all industries except transportation and utilities. The NASDAQ Composite Index measures all NASDAQ domestic and international based common type stocks listed on The NASDAQ Stock Market. The NASDAQ Composite includes over 3,000 companies, more than most other stock market indices. The Bloomberg U.S. Aggregate Bond Index is an unmanaged index of domestic investment grade bonds, including corporate, government and mortgage-backed securities. The WTI Crude Oil Index is a major trading classification of sweet light crude oil that serves as a major benchmark price for oil consumed in the United States. The 3-Month U.S. Treasury Bill is a short-term debt obligation backed by the U.S. Treasury Department with a maturity of three months. The Consumer Price Index (CPI) is a measure of the average change over time in the prices paid by urban consumers for a market basket of consumer goods and services. While stock selection is not governed by quantitative rules, a stock typically is added only if the company has an excellent reputation, demonstrates sustained growth and is of interest to a large number of investors. The volatility (beta) of the Composite may be greater or less than its respective benchmarks. It is not possible to invest directly in these indices.
(All MSCI index returns are shown net and in U.S. dollars unless otherwise noted.)
Markets Review
Sources: CAPS CompositeHubTM, Bloomberg Past performance is not indicative of future results. Aristotle Global Equity WM Composite returns are presented pure gross and net of maximum wrap fee and include the reinvestment of all income. Pure gross returns do not reflect the deduction of any trading costs or other fees and are supplemental to the net returns. Net returns are calculated by subtracting the highest applicable wrap/SMA fee, which includes trading costs and custodial fees, from the pure gross composite return. The highest applicable wrap/SMA fee is 2.00% on an annual basis, or 0.50% quarterly from inception to 12/31/2023 and 0.17% monthly from 1/1/2024 to present. Aristotle Capital Composite returns are preliminary pending final account reconciliation. Please see important disclosures at the end of this document.
Global equity markets started the year on a modestly negative note, with the MSCI ACWI Index returning -1.32% for the first quarter. In contrast, global fixed income gained ground, as the Bloomberg Global Aggregate Bond Index rose 2.64%. Value stocks outpaced growth over the quarter, with the MSCI ACWI Value Index outperforming the MSCI ACWI Growth Index by 11.59%.
Latin America and Europe were the strongest regions, while North America was the only negative performer and Japan increased the least. On a sector basis, eight out of the eleven sectors within the MSCI ACWI Index finished higher, with Energy, Utilities and Financials rising the most. Meanwhile, Information Technology, Consumer Discretionary and Communication Services were the weakest performers.
Inflation trends remained broadly stable across developed markets. The U.S., U.K., and EU all reported annual inflation below 3%, giving central banks greater flexibility. The Federal Reserve held rates steady, while the European Central Bank and Bank of England continued to ease monetary policy in response to softer growth signals. In Asia, China’s economy recorded 5% GDP growth in 2024, showing tentative signs of recovery, while the Bank of Japan raised interest rates for the third time since ending its negative interest rate policy in March 2024 on expectations of sustained 2% inflation.
Trade policy re-emerged as a market concern during the quarter. In his first months back in office, President Trump announced a new wave of tariffs on imports from Canada, Mexico and China, with additional warnings directed at the EU and other trading partners over what were termed “imbalanced trade arrangements.” The targeted industries—autos, steel and aluminum—reflected a focus on reshoring and industrial policy. While the long-term impact is still unfolding, the renewed trade uncertainty prompted central banks to lower growth forecasts and adopt a more cautious tone on future rate moves.
In Europe, Germany’s economy remained under pressure after contracting for a second consecutive year in 2024—the first two-year contraction since 2003. In response, Chancellor-designate Friedrich Merz proposed sweeping fiscal reforms, including an overhaul of the constitutional debt brake, a €500 billion infrastructure fund and increased defense spending. While potentially supportive of medium-term growth, these initiatives have raised concerns around inflation and fiscal discipline, adding complexity to the European Central Bank’s policy path.
On the geopolitical front, a fragile ceasefire between Israel and Hamas in January unraveled by March amid disagreements over hostage releases. In Ukraine, a military stalemate in the east opened the door for ceasefire negotiations brokered by the U.S., with discussions reportedly tied to a potential minerals agreement to offset financial aid.
Finally, the artificial intelligence (AI) theme continued to influence market narratives. Chinese startup DeepSeek gained international attention after launching a low-cost rival to leading generative AI models from OpenAI, Anthropic and Google. The move not only intensified competition but raised new questions about the durability and configuration of global AI supply chains. Notably, DeepSeek’s approach—achieving comparable performance at a fraction of the cost—has challenged assumptions around the infrastructure demands of generative AI, potentially reducing the need for GPUs, energy-intensive data centers and the broader hardware stack the market had expected would underpin AI growth.
Performance and Attribution Summary
For the first quarter of 2025, Aristotle Capital’s Global Equity WM Composite posted a total return of 1.35% pure gross of fees (0.85% net of fees), outperforming the MSCI ACWI Index, which returned -1.32%, and the MSCI World Index, which returned -1.79%. Please refer to the table below for detailed performance.
Performance (%)
1Q25
1 Year
3 Years
5 Years
10 Years
Since Inception*
Global Equity WM Composite (pure gross)
1.35
-0.50
5.11
14.12
9.42
9.64
Global Equity WM Composite (net)
0.85
-2.45
3.01
11.87
7.24
7.47
MSCI ACWI Index (net)
-1.32
7.15
6.91
15.18
8.84
9.19
MSCI World Index (net)
-1.79
7.04
7.58
16.13
9.50
10.07
* The inception date for the Global Equity WM Composite is December 1, 2010. Past performance is not indicative of future results. Aristotle Global Equity WM Composite returns are presented pure gross and net of maximum wrap fee and include the reinvestment of all income. Pure gross returns do not reflect the deduction of any trading costs or other fees and are supplemental to the net returns. Net returns are calculated by subtracting the highest applicable wrap/SMA fee, which includes trading costs and custodial fees, from the pure gross composite return. The highest applicable wrap/SMA fee is 2.00% on an annual basis, or 0.50% quarterly from inception to 12/31/2023 and 0.17% monthly from 1/1/2024 to present. Aristotle Capital Composite returns are preliminary pending final account reconciliation. Please see important disclosures at the end of this document.
Source: FactSet Past performance is not indicative of future results. Sector attribution shows how much of a portfolio’s overall return is directly attributable to stock selection and asset allocation decisions within the portfolio, highlighting which sectors contributed or detracted to the total return. Attribution includes the reinvestment of income.
From a sector perspective, the portfolio’s outperformance relative to the MSCI ACWI Index can be primarily attributed to allocation effects, while security selection also had a positive impact. Security selection and an underweight in Information Technology and security selection in Consumer Discretionary contributed the most to the portfolio’s relative performance. Conversely, security selection in Materials, Energy and Industrials detracted from relative return.
Regionally, allocation effects were primarily responsible for the portfolio’s outperformance relative to the MSCI ACWI Index, while security selection also had a positive impact. Security selection in Japan and an overweight in Europe contributed the most to relative performance, while security selection in North American and an underweight in Emerging Markets detracted.
Contributors and Detractors for 1Q 2025
Relative Contributors
Relative Detractors
Munich Reinsurance
Cameco
Sony
Lenner
Nemetshek
Norwegian Cruise Line
Amgen
Microchip Technology
TotalEnergies
Adobe
Munich Re, the world’s largest reinsurance company, was the leading contributor for the quarter. The company delivered strong results despite absorbing €1.2 billion in claims from January’s California wildfires, a testament to the reinsurer’s prudent risk management. Demonstrating confidence in its ongoing profitability and robust capital position, Munich Re also raised its dividend by more than 30% and announced an expanded €2 billion share buyback program. Favorable market pricing and disciplined underwriting have continued to support profitability, even amid elevated volatility in capital markets and global catastrophe losses. Additionally, Munich Re’s experienced leadership team has placed an unusual emphasis on innovation for a reinsurer of its size, investing meaningfully in R&D and technology. For example, the company has identified, launched or already implemented over 300 AI use cases that aim to increase efficiency and enhance its competitive edge. We expect these initiatives to further support Munich Re’s continued market share gains across specialty lines, including cybersecurity, and in rapidly growing Asian markets where insurance penetration remains relatively low.
Sony, the global leader in video games, image sensors, music and movies, was a top contributor for the period. The company delivered strong quarterly results, driven primarily by its gaming and music businesses, and announced a new executive leadership structure. In gaming, Sony reported a record-high 129 million monthly active users, a 20% year-over-year increase in PlayStation Plus revenue and an expanding user base, as 40% of new PS5 console buyers were new to the platform. The Music segment also continued to benefit from global streaming tailwinds, delivering double-digit profit growth. In a significant leadership transition, Sony announced that, effective April 1, 2025, Hiroki Totoki, currently COO and CFO, would succeed Kenichiro Yoshida as CEO. Our original investment in Sony was grounded in the strategic transformation led by Yoshida-san, where Totoki-san was an instrumental partner in driving Sony’s pivot away from commoditized businesses whilespearheading investments in content IP and semiconductors. Looking ahead, we continue to see opportunity for Sony to capitalize on its unique position as both a content creator and platform owner. The company’s ability to integrate gaming, music, anime and film and leverage IP across platforms (e.g., Crunchyroll and its recent partnership with Kadokawa) should position it well for long-term value creation.
Cameco, one of the world’s largest uranium producers, was a primary detractor during the quarter. Shares of the Canada-based company declined following President Trump’s 10% tariff on Canadian energy exports to the U.S., where Cameco is a major uranium supplier. However, we believe these tariff concerns are overstated given the inelastic nature of uranium demand and the lack of substitutes. Any incremental costs would be absorbed by utilities under existing contract structures. While the company’s stock price may have followed the decline in uranium spot prices during the period, Cameco’s business is largely insulated from short-term price swings due to its extensive use of long-term contracts rather than spot-market sales. Moreover, the company’s tier-one assets in politically stable jurisdictions, operational track record and ability to flex production—particularly at its MacArthur River and Key Lake mines—further strengthen its competitive advantage. We believe Cameco remains exceptionally well-positioned to benefit as governments around the world increasingly turn to nuclear power as a clean, secure and scalable source of energy.
Adobe, the leading provider of content creation and publishing software, was a notable detractor during the quarter. This came despite the company reporting record revenue of over $5.7 billion in the first quarter—a 10% year-over-year increase, with double-digit increases across both its Digital Media and Digital Experience segments. The disconnect between strong fundamentals and share price weakness reflects ongoing market concerns around intensifying competitive threats from generative AI and lower-cost design platforms. Market sentiment has remained cautious around the perceived disruption risk posed by new AI-driven entrants, including OpenAI’s Sora for video generation and platforms like Canva, which cater to the broader prosumer and small and medium-sized business segment. However, we continue to view these as largely non-overlapping with Adobe’s core base of creative professionals, enterprises and agencies—audiences that demand precision, control and integration within larger workflows. Canva, while expanding its feature set, remains limited in its enterprise readiness and depth. Sora, meanwhile, remains early-stage and experimental, with limited commercial application at this point. Crucially, Adobe is not standing still. The company is actively embedding generative AI across its ecosystem through Firefly, which is commercially safe (i.e., free of copyrighted sources to train its models) and integrated natively into Creative Cloud applications like Photoshop and Illustrator. Firefly has shown strong early traction, generating $125 million in annualized recurring revenue, with management expecting that figure to double by year-end. While modest in size relative to Adobe’s total revenue, Firefly’s monetization strategy is still in its early innings, with further potential through upselling, usage-based pricing and expanded use cases. Beyond monetization, AI integration enhances Adobe’s long-term competitive moat through product functionality, stronger customer engagement and increased switching costs. Adobe’s unique access to proprietary data, content workflows and creative content allows it to fine-tune models that serve the high-end needs of professionals—capabilities that generic AI models lack. Strategic partnerships with Microsoft (e.g., Firefly in Microsoft 365 Copilot) and ongoing momentum in Adobe Express further extend its reach into new user segments. Ultimately, we believe Adobe has a durable competitive advantage, underpinned by a large installed base, subscription-led business model, strong brand equity and a long track record of innovation. While short-term concerns over AI disruption have weighed on the stock price, we believe Adobe is well-positioned to harness AI as a driver of value rather than being displaced by it.
Recent Portfolio Activity
Buys
Sells
Alphabet
Honeywell
Daikin Industries
Michelin
Millrose Properties
During the quarter, we sold our positions in Honeywell, Michelin and Millrose Properties and invested in Alphabet and Daikin Industries.
We first invested in Honeywell, the multinational industrial conglomerate, in the third quarter of 2021. Throughout our ownership period, the company made meaningful progress in its transformation into a modern, innovation-driven enterprise, with a focus on energy efficiency, productivity and connectivity—commonly referred to as the Industrial Internet of Things (IIoT). Supported by a disciplined capital allocation strategy, Honeywell continued to reshape its product portfolio, emphasizing higher-margin, technology-enabled offerings, such as aerospace software and industrial automation—catalysts we had previously identified. As one of the last remaining diversified U.S. conglomerates, and following years of pressure from activist investors, Honeywell announced in February its decision to split into three independent, publicly listed companies: Honeywell Automation, Honeywell Aerospace and Advanced Materials. We believe this move has the potential to enhance operational focus and unlock shareholder value, in line with similar breakups by other large conglomerates. However, the process is expected to take time and is not anticipated to be completed until the second half of 2026. Given this long runway and the limited near-term visibility, we elected to exit our stake in Honeywell and will continue to monitor the business as further details emerge. We used the proceeds from the sale to fund what we believe is a more attractive investment in Alphabet.
Our team initially invested in Michelin, one of the world’s largest tire manufacturers, in the first quarter of 2022. In our view, the company benefits from a strong competitive position driven by its global scale, brand strength and continued leadership in cutting-edge tire technology. We believe Michelin is well-positioned to enhance profitability through an ongoing shift in its product mix toward higher-margin specialty and large-diameter tires, along with improved SG&A efficiency supported by process optimization initiatives. While Michelin continues to meet all of our core investment criteria, we chose to exit our position in order to fund what we believe is a more compelling opportunity in Daikin Industries.
We received shares of Millrose Properties after it was spun off from Lennar on February 7. Millrose is a new publicly traded company focused on land banking and development. As part of the spinoff, Lennar transferred $6 billion worth of land inventory to Millrose. We believe this spinoff will allow Lennar to be a more capital efficient homebuilder, as less land inventory should lead to stronger FREE cash flow generation and better returns on invested capital. As such, we decided to sell our shares of Millrose and continue with our investment in Lennar’s core homebuilding operations, which we view as a more optimal investment.
Alphabet, Inc.
Headquartered in Mountain View, California and founded by Larry Page and Sergey Brin, Alphabet is one of the world’s most dominant and innovative technology companies. Best known as the parent company of Google, Alphabet generates most of its revenue from digital advertising, particularly search. Google currently holds an estimated 87% market share in U.S. search and nearly 90% globally, underpinning a highly profitable ad business that accounts for roughly 75% of Alphabet’s total revenue.
While Google was founded in 1998 and became public in 2004, Alphabet was created in 2015 to provide greater transparency and operational independence across its varied business lines. Beyond its core, the company has increasingly diversified into accelerating products, including Google Cloud and YouTube’s suite of subscription services (YouTube Premium, YouTube TV and YouTube Music). Today, Google Services (Search, YouTube, Chrome, Android and the Play Store) makes up ~87% of total revenue, while Google Cloud represents ~13%. Alphabet also invests in longer-term innovation through its Other Bets segment, which includes autonomous driving (Waymo), life sciences (Verily) and advanced AI research (DeepMind).
High-Quality Business
Some of the quality characteristics we have identified for Alphabet include:
Unrivaled scale in global search and digital advertising, protected by powerful network effects and vast proprietary data;
An integrated ecosystem—across Search, YouTube, Android, Chrome and Gmail—that supports user retention and ad targeting efficiency;
Category leadership in digital media, with YouTube generating over $45 billion in revenue in 2024 and expanding rapidly through ad-supported and subscription models;
Emerging strength in cloud computing, with Google Cloud now profitable and scaling meaningfully; and
A culture of innovation, supported by its Other Bets incubator, which allows Alphabet to invest in moonshot ideas while maintaining financial discipline.
Attractive Valuation
We believe shares of Alphabet are significantly undervalued at less than 12x our estimate of normalized earnings. The company continues to scale high-margin businesses like Google Cloud and YouTube’s subscription offerings while maintaining robust FREE cash flow generation from its dominant advertising segment.
Compelling Catalysts
Catalysts we have identified for Alphabet, which we believe will cause its stock price to appreciate over our three- to five-year investment horizon, include:
Sustained leadership in search and digital advertising, reinforced by Google’s unmatched first-party data and adtech platform;
Improving profitability, margin expansion and market share gains for Google Cloud as it effectively competes at scale with AWS and Microsoft Azure; and
Continued growth in YouTube subscription revenues as YouTube TV—which is on track to become the largest U.S. pay-TV provider by 2026—captures share from traditional cable providers and premium, ad-free content attracts a broader audience.
Potential Future Catalyst: Alphabet’s deep expertise and resources in AI, particularly through the Gemini model family (the company’s flagship large language model), could enhance monetization across Ads, Search and Cloud. Though this is not explicitly included in our valuation estimates, we view the possibility as a “free option.”
Daikin Industries, Ltd.
Founded in 1924 and headquartered in Japan, Daikin Industries is the world’s largest manufacturer of commercial and residential air conditioner systems. The company produces air conditioning systems, heat pumps, air purifiers and refrigeration equipment (which accounts for over 90% of revenue). Daikin has long been an industry leader in developing energy-efficient products, leadership that was molded by its roots in Japan, a region with limited natural resources and high energy costs. Its R&D organization includes a global Technology Innovation Center and 39 other regional development facilities that customize offerings to local markets. Today, Daikin’s products are sold in over 170 countries, with leading market positions in Japan, China and the U.S. residential market.
Air conditioning products often require professional installation, making distribution a critical factor in Daikin’s success. Its 2012 acquisition of Goodman expanded its reach in the U.S., adding hundreds of distribution points and a platform from which to expand. In China, Daikin sells high-end, multi-unit systems through its specialty ProShop retail stores, earning higher margins by selling directly to homeowners rather than through developers or contractors.
High-Quality Business
Some of the quality characteristics we have identified for Daikin include:
Strong brand recognition and a large global distribution network provide competitive advantages and serve as high barriers to entry;
History of technological innovation, particularly in energy-saving inverters and variable refrigerant flow systems; and
Ability to tailor products to different local preferences across geographies and varied levels of HVAC regulations, thanks to Daikin’s network of global production bases and development facilities.
Attractive Valuation
Based on our estimates, shares of the company are significantly undervalued. We believe greater global adoption of air conditioning, as well as higher priced and more profitable technologies (e.g., heat pumps and inverters), will lead to higher normalized FREE cash flow than currently appreciated by the market.
Compelling Catalysts
Catalysts we have identified for Daikin, which we believe will cause its stock price to appreciate over our three- to five-year investment horizon, include:
As the largest global supplier and a leader in energy efficiency, Daikin is uniquely positioned to benefit from the increase in worldwide air conditioning adoption rates (projected to triple by 2050) while leveraging its intellectual property in inverters and heat pumps;
Market share gains in the U.S. as Daikin further leverages its technology in premium residential air conditioning, supported by Goodman’s distribution network;
Ongoing adoption of heat pumps in Europe and a recovery in China’s property market; and
Entering the final year of its Fusion 25 strategic plan with room for improvements in advancing technological development, strengthening sales and service networks, promoting digital transformation, and more.
Conclusion
As we progress through the early stages of 2025, the convergence of persistent macroeconomic forces with the renewed presence of trade conflicts has added to the uncertainty facing equity markets. While there certainly was no shortage of headlines during the quarter, we believe trying to time the market or to predict the impact of these developments is a futile task. Instead, our focus remains on evaluating whether these events are truly analyzable, materially differentiated and meaningful to long-term investors—or simply noise that fuels short-term speculation.
At Aristotle Capital, we do not aim to capture short-term gains by “trading” portfolios based on the news of the day. Rather, we remain committed to identifying companies we believe exhibit high-quality characteristics and the resilience to perform across full market cycles. In our experience, breaking news is often fleeting and not quite as impactful as many market participants believe it to be. On the contrary, during periods of economic uncertainty high-quality companies are oftentimes able to make decisions that result in market share gains, thus, potentially, increasing their longer-term intrinsic worth. As such, we will continue to study the microeconomic decisions of individual businesses rather than attempt to predict macroeconomic events or outcomes.
Disclosures
The opinions expressed herein are those of Aristotle Capital Management, LLC (Aristotle Capital) and are subject to change without notice. Past performance is not a guarantee or indicator of future results. This material is not financial advice or an offer to buy or sell any product. You should not assume that any of the securities transactions, sectors or holdings discussed in this report were or will be profitable, or that recommendations Aristotle Capital makes in the future will be profitable or equal the performance of the securities listed in this report. The portfolio characteristics shown relate to the Aristotle Global Equity Advisory strategy. Not every client’s account will have these characteristics. Aristotle Capital reserves the right to modify its current investment strategies and techniques based on changing market dynamics or client needs. There is no assurance that any securities discussed herein will remain in an account’s portfolio at the time you receive this report or that securities sold have not been repurchased. The securities discussed may not represent an account’s entire portfolio and, in the aggregate, may represent only a small percentage of an account’s portfolio holdings. The performance attribution presented is of a representative account from Aristotle Capital’s Global Equity WM Composite. The representative account is a discretionary client account which was chosen to most closely reflect the investment style of the strategy. The criteria used for representative account selection is based on the account’s period of time under management and its similarity of holdings in relation to the strategy. Recommendations made in the last 12 months are available upon request.
Composite returns are presented pure gross and net of the maximum wrap fee and include the reinvestment of all income. Pure gross returns do not reflect the deduction of any trading costs or other fees and are supplemental to the net returns. Net returns are calculated by subtracting the highest applicable wrap/SMA fee, which includes trading costs and custodial fees, from the pure gross composite return. The highest applicable wrap/SMA fee is 2.00% on an annual basis, or 0.50% quarterly from inception to 12/31/2023 and 0.17% monthly from 1/1/2024 to present.
All investments carry a certain degree of risk, including the possible loss of principal. Investments are also subject to political, market, currency and regulatory risks or economic developments. International investments involve special risks that may in particular cause a loss in principal, including currency fluctuation, lower liquidity, different accounting methods and economic and political systems, and higher transaction costs. These risks typically are greater in emerging markets. Securities of small‐ and medium‐sized companies tend to have a shorter history of operations, be more volatile and less liquid. Value stocks can perform differently from the market as a whole and other types of stocks.
The material is provided for informational and/or educational purposes only and is not intended to be and should not be construed as investment, legal or tax advice and/or a legal opinion. Investors should consult their financial and tax adviser before making investments. The opinions referenced are as of the date of publication, may be modified due to changes in the market or economic conditions, and may not necessarily come to pass. Information and data presented has been developed internally and/or obtained from sources believed to be reliable. Aristotle Capital does not guarantee the accuracy, adequacy or completeness of such information.
Aristotle Capital Management, LLC is an independent investment adviser registered under the Investment Advisers Act of 1940, as amended. Registration does not imply a certain level of skill or training. More information about Aristotle Capital, including our investment strategies, fees and objectives, can be found in our Form ADV Part 2, which is available upon request. ACM-2504-103
Performance Disclosures
Sources: CAPS CompositeHubTM, MSCI
Composite returns for all periods ended March 31, 2025 are preliminary pending final account reconciliation.MSCI ACWI (Net) was stated as the primary benchmark on June 1, 2024 and MSCI World (Net) became the secondary benchmark.
The Aristotle Global Equity WM Composite has an inception date of December 1, 2010. As of 1/1/2024, the composite was renamed from the Global Equity Advisory Composite.
Past performance is not indicative of future results. The information provided should not be considered financial advice or a recommendation to purchase or sell any particular security or product. Performance results for periods greater than one year have been annualized.
Composite returns are presented pure gross and net of the maximum wrap fee and include the reinvestment of all income. Pure gross returns do not reflect the deduction of any trading costs or other fees and are supplemental to the net returns. Net returns are calculated by subtracting the highest applicable wrap/SMA fee, which includes trading costs and custodial fees, from the pure gross composite return. The highest applicable wrap/SMA fee is 2.00% on an annual basis, or 0.50% quarterly from inception to 12/31/2023 and 0.17% monthly from 1/1/2024 to present.
Index Disclosures
MSCI ACWI (Net) was stated as the primary benchmark on June 1, 2024 and MSCI World (Net) became the secondary benchmark. The MSCI ACWI captures large and mid-cap representation across 23 developed markets and 24 emerging markets countries. With approximately 2,600 constituents, the Index covers approximately 85% of the global investable equity opportunity set. The MSCI ACWI Equal Weighted Index represents an alternative weighting scheme to its market cap weighted parent index, MSCI ACWI. The Index includes the same constituents as its parent (large and mid-cap securities from 23 developed markets and 24 emerging markets countries. However, at each quarterly rebalance date, all index constituents are weighted equally, effectively removing the influence of each constituent’s current price (high or low). Between rebalances, index constituent weightings will fluctuate due to price performance. The MSCI World Index is a free float-adjusted market capitalization weighted index that is designed to measure the equity market performance of developed markets. The MSCI World Index consists of the following 23 developed market country indexes: Australia, Austria, Belgium, Canada, Denmark, Finland, France, Germany, Hong Kong, Ireland, Israel, Italy, Japan, Netherlands, New Zealand, Norway, Portugal, Singapore, Spain, Sweden, Switzerland, the United Kingdom and the United States. The MSCI Emerging Markets Index is a free float-adjusted market capitalization-weighted index that is designed to measure equity market performance of emerging markets. The MSCI Emerging Markets Index consists of the following 24 emerging market country indexes: Brazil, Chile, China, Colombia, Czech Republic, Egypt, Greece, Hungary, India, Indonesia, Korea, Kuwait, Malaysia, Mexico, Peru, Philippines, Poland, Qatar, Saudi Arabia, South Africa, Taiwan, Thailand, Turkey and United Arab Emirates. The MSCI ACWI Growth Index captures large and mid-cap securities exhibiting overall growth style characteristics across 23 developed markets countries and 24 emerging markets countries. The MSCI ACWI Value Index captures large and mid-cap securities exhibiting overall value style characteristics across 23 developed markets countries and 24 emerging markets countries. The MSCI Europe Index captures large and mid-cap representation across 15 developed markets countries in Europe. With approximately 400 constituents, the Index covers approximately 85% of the free float-adjusted market capitalization across the European developed markets equity universe. The MSCI Japan Index is designed to measure the performance of the large and mid-cap segments of the Japanese market. With approximately 200 constituents, the Index covers approximately 85% of the free float-adjusted market capitalization in Japan. The S&P 500® Index is the Standard & Poor’s Composite Index of 500 stocks and is a widely recognized, unmanaged index of common stock prices. The S&P 500 Equal Weight Index is designed to be the size-neutral version of the S&P 500. It includes the same constituents as the cap-weighted S&P 500, but each company in the S&P 500 Equal Weight Index is allocated the same weight at each quarterly rebalance. The Bloomberg Global Aggregate Bond Index is a flagship measure of global investment grade debt from 27 local currency markets. This multi-currency benchmark includes Treasury, government-related, corporate and securitized fixed rate bonds from both developed and emerging markets issuers. The Brent Crude Oil Index is a major trading classification of sweet light crude oil that serves as a major benchmark price for purchases of oil worldwide. The volatility (beta) of the Composite may be greater or less than the benchmarks. It is not possible to invest directly in these indexes.
Related Resources
For more on Global Equity, access the latest resources.
(All MSCI index returns are shown net and in U.S. dollars unless otherwise noted.)
Markets Review
Sources: CAPS CompositeHubTM, Bloomberg Past performance is not indicative of future results. Aristotle Global Equity Composite returns are presented gross and net of investment advisory fees and include the reinvestment of all income. Gross returns will be reduced by fees and other expenses that may be incurred in the management of the account. Net returns are presented net of actual investment advisory fees and after the deduction of all trading expenses. Aristotle Capital Composite returns are preliminary pending final account reconciliation. Please see important disclosures at the end of this document.
Global equity markets started the year on a modestly negative note, with the MSCI ACWI Index returning -1.32% for the first quarter. In contrast, global fixed income gained ground, as the Bloomberg Global Aggregate Bond Index rose 2.64%. Value stocks outpaced growth over the quarter, with the MSCI ACWI Value Index outperforming the MSCI ACWI Growth Index by 11.59%.
Latin America and Europe were the strongest regions, while North America was the only negative performer and Japan increased the least. On a sector basis, eight out of the eleven sectors within the MSCI ACWI Index finished higher, with Energy, Utilities and Financials rising the most. Meanwhile, Information Technology, Consumer Discretionary and Communication Services were the weakest performers.
Inflation trends remained broadly stable across developed markets. The U.S., U.K., and EU all reported annual inflation below 3%, giving central banks greater flexibility. The Federal Reserve held rates steady, while the European Central Bank and Bank of England continued to ease monetary policy in response to softer growth signals. In Asia, China’s economy recorded 5% GDP growth in 2024, showing tentative signs of recovery, while the Bank of Japan raised interest rates for the third time since ending its negative interest rate policy in March 2024 on expectations of sustained 2% inflation.
Trade policy re-emerged as a market concern during the quarter. In his first months back in office, President Trump announced a new wave of tariffs on imports from Canada, Mexico and China, with additional warnings directed at the EU and other trading partners over what were termed “imbalanced trade arrangements.” The targeted industries—autos, steel and aluminum—reflected a focus on reshoring and industrial policy. While the long-term impact is still unfolding, the renewed trade uncertainty prompted central banks to lower growth forecasts and adopt a more cautious tone on future rate moves.
In Europe, Germany’s economy remained under pressure after contracting for a second consecutive year in 2024—the first two-year contraction since 2003. In response, Chancellor-designate Friedrich Merz proposed sweeping fiscal reforms, including an overhaul of the constitutional debt brake, a €500 billion infrastructure fund and increased defense spending. While potentially supportive of medium-term growth, these initiatives have raised concerns around inflation and fiscal discipline, adding complexity to the European Central Bank’s policy path.
On the geopolitical front, a fragile ceasefire between Israel and Hamas in January unraveled by March amid disagreements over hostage releases. In Ukraine, a military stalemate in the east opened the door for ceasefire negotiations brokered by the U.S., with discussions reportedly tied to a potential minerals agreement to offset financial aid.
Finally, the artificial intelligence (AI) theme continued to influence market narratives. Chinese startup DeepSeek gained international attention after launching a low-cost rival to leading generative AI models from OpenAI, Anthropic and Google. The move not only intensified competition but raised new questions about the durability and configuration of global AI supply chains. Notably, DeepSeek’s approach—achieving comparable performance at a fraction of the cost—has challenged assumptions around the infrastructure demands of generative AI, potentially reducing the need for GPUs, energy-intensive data centers and the broader hardware stack the market had expected would underpin AI growth.
Performance and Attribution Summary
For the first quarter of 2025, Aristotle Capital’s Global Equity Composite posted a total return of 1.12% gross of fees (1.02% net of fees), outperforming the MSCI ACWI Index, which returned -1.32%, and the MSCI World Index, which returned -1.79%. Please refer to the table below for detailed performance.
Performance (%)
1Q25
1 Year
3 Years
5 Years
10 Years
Since Inception*
Global Equity Composite (gross)
1.12
-1.26
4.70
13.74
9.30
9.47
Global Equity Composite (net)
1.02
-1.59
4.37
13.37
8.93
9.04
MSCI ACWI Index (net)
-1.32
7.15
6.91
15.18
8.84
8.96
MSCI World Index (net)
-1.79
7.04
7.58
16.13
9.50
9.85
*The inception date for the Global Equity Composite is November 1, 2010. Past performance is not indicative of future results. Aristotle Global Equity Composite returns are presented gross and net of investment advisory fees and include the reinvestment of all income. Gross returns will be reduced by fees and other expenses that may be incurred in the management of the account. Net returns are presented net of actual investment advisory fees and after the deduction of all trading expenses. Aristotle Capital Composite returns are preliminary pending final account reconciliation. MSCI ACWI (Net) was stated as the primary benchmark on June 1, 2024 and MSCI World (Net) became the secondary benchmark. Please see important disclosures at the end of this document.
Source: FactSet Past performance is not indicative of future results. Sector attribution shows how much of a portfolio’s overall return is directly attributable to stock selection and asset allocation decisions within the portfolio, highlighting which sectors contributed or detracted to the total return. Attribution includes the reinvestment of income.
From a sector perspective, the portfolio’s outperformance relative to the MSCI ACWI Index can be primarily attributed to allocation effects, while security selection also had a positive impact. Security selection and an underweight in Information Technology and security selection in Consumer Discretionary contributed the most to the portfolio’s relative performance. Conversely, security selection in Materials, Energy and Industrials detracted from relative return.
Regionally, allocation effects were primarily responsible for the portfolio’s outperformance relative to the MSCI ACWI Index, while security selection also had a positive impact. An overweight in Europe and security selection in Japan contributed the most to relative performance, while an underweight in Emerging Markets and security selection in North America detracted.
Contributors and Detractors for 1Q 2025
Relative Contributors
Relative Detractors
Munich Reinsurance
Cameco
Sony
Lenner
Nemetshek
Norwegian Cruise Line
Amgen
Microchip Technology
TotalEnergies
Adobe
Munich Re, the world’s largest reinsurance company, was the leading contributor for the quarter. The company delivered strong results despite absorbing €1.2 billion in claims from January’s California wildfires, a testament to the reinsurer’s prudent risk management. Demonstrating confidence in its ongoing profitability and robust capital position, Munich Re also raised its dividend by more than 30% and announced an expanded €2 billion share buyback program. Favorable market pricing and disciplined underwriting have continued to support profitability, even amid elevated volatility in capital markets and global catastrophe losses. Additionally, Munich Re’s experienced leadership team has placed an unusual emphasis on innovation for a reinsurer of its size, investing meaningfully in R&D and technology. For example, the company has identified, launched or already implemented over 300 AI use cases that aim to increase efficiency and enhance its competitive edge. We expect these initiatives to further support Munich Re’s continued market share gains across specialty lines, including cybersecurity, and in rapidly growing Asian markets where insurance penetration remains relatively low.
Sony, the global leader in video games, image sensors, music and movies, was a top contributor for the period. The company delivered strong quarterly results, driven primarily by its gaming and music businesses, and announced a new executive leadership structure. In gaming, Sony reported a record-high 129 million monthly active users, a 20% year-over-year increase in PlayStation Plus revenue and an expanding user base, as 40% of new PS5 console buyers were new to the platform. The Music segment also continued to benefit from global streaming tailwinds, delivering double-digit profit growth. In a significant leadership transition, Sony announced that, effective April 1, 2025, Hiroki Totoki, currently COO and CFO, would succeed Kenichiro Yoshida as CEO. Our original investment in Sony was grounded in the strategic transformation led by Yoshida-san, where Totoki-san was an instrumental partner in driving Sony’s pivot away from commoditized businesses whilespearheading investments in content IP and semiconductors. Looking ahead, we continue to see opportunity for Sony to capitalize on its unique position as both a content creator and platform owner. The company’s ability to integrate gaming, music, anime and film and leverage IP across platforms (e.g., Crunchyroll and its recent partnership with Kadokawa) should position it well for long-term value creation.
Cameco, one of the world’s largest uranium producers, was a primary detractor during the quarter. Shares of the Canada-based company declined following President Trump’s 10% tariff on Canadian energy exports to the U.S., where Cameco is a major uranium supplier. However, we believe these tariff concerns are overstated given the inelastic nature of uranium demand and the lack of substitutes. Any incremental costs would be absorbed by utilities under existing contract structures. While the company’s stock price may have followed the decline in uranium spot prices during the period, Cameco’s business is largely insulated from short-term price swings due to its extensive use of long-term contracts rather than spot-market sales. Moreover, the company’s tier-one assets in politically stable jurisdictions, operational track record and ability to flex production—particularly at its MacArthur River and Key Lake mines—further strengthen its competitive advantage. We believe Cameco remains exceptionally well-positioned to benefit as governments around the world increasingly turn to nuclear power as a clean, secure and scalable source of energy.
Adobe, the leading provider of content creation and publishing software, was a notable detractor during the quarter. This came despite the company reporting record revenue of over $5.7 billion in the first quarter—a 10% year-over-year increase, with double-digit increases across both its Digital Media and Digital Experience segments. The disconnect between strong fundamentals and share price weakness reflects ongoing market concerns around intensifying competitive threats from generative AI and lower-cost design platforms. Market sentiment has remained cautious around the perceived disruption risk posed by new AI-driven entrants, including OpenAI’s Sora for video generation and platforms like Canva, which cater to the broader prosumer and small and medium-sized business segment. However, we continue to view these as largely non-overlapping with Adobe’s core base of creative professionals, enterprises and agencies—audiences that demand precision, control and integration within larger workflows. Canva, while expanding its feature set, remains limited in its enterprise readiness and depth. Sora, meanwhile, remains early-stage and experimental, with limited commercial application at this point. Crucially, Adobe is not standing still. The company is actively embedding generative AI across its ecosystem through Firefly, which is commercially safe (i.e., free of copyrighted sources to train its models) and integrated natively into Creative Cloud applications like Photoshop and Illustrator. Firefly has shown strong early traction, generating $125 million in annualized recurring revenue, with management expecting that figure to double by year-end. While modest in size relative to Adobe’s total revenue, Firefly’s monetization strategy is still in its early innings, with further potential through upselling, usage-based pricing and expanded use cases. Beyond monetization, AI integration enhances Adobe’s long-term competitive moat through product functionality, stronger customer engagement and increased switching costs. Adobe’s unique access to proprietary data, content workflows and creative content allows it to fine-tune models that serve the high-end needs of professionals—capabilities that generic AI models lack. Strategic partnerships with Microsoft (e.g., Firefly in Microsoft 365 Copilot) and ongoing momentum in Adobe Express further extend its reach into new user segments. Ultimately, we believe Adobe has a durable competitive advantage, underpinned by a large installed base, subscription-led business model, strong brand equity and a long track record of innovation. While short-term concerns over AI disruption have weighed on the stock price, we believe Adobe is well-positioned to harness AI as a driver of value rather than being displaced by it.
Recent Portfolio Activity
Buys
Sells
Alphabet
Honeywell
Daikin Industries
Michelin
Millrose Properties
During the quarter, we sold our positions in Honeywell, Michelin and Millrose Properties and invested in Alphabet and Daikin Industries.
We first invested in Honeywell, the multinational industrial conglomerate, in the third quarter of 2021. Throughout our ownership period, the company made meaningful progress in its transformation into a modern, innovation-driven enterprise, with a focus on energy efficiency, productivity and connectivity—commonly referred to as the Industrial Internet of Things (IIoT). Supported by a disciplined capital allocation strategy, Honeywell continued to reshape its product portfolio, emphasizing higher-margin, technology-enabled offerings, such as aerospace software and industrial automation—catalysts we had previously identified. As one of the last remaining diversified U.S. conglomerates, and following years of pressure from activist investors, Honeywell announced in February its decision to split into three independent, publicly listed companies: Honeywell Automation, Honeywell Aerospace and Advanced Materials. We believe this move has the potential to enhance operational focus and unlock shareholder value, in line with similar breakups by other large conglomerates. However, the process is expected to take time and is not anticipated to be completed until the second half of 2026. Given this long runway and the limited near-term visibility, we elected to exit our stake in Honeywell and will continue to monitor the business as further details emerge. We used the proceeds from the sale to fund what we believe is a more attractive investment in Alphabet.
Our team initially invested in Michelin, one of the world’s largest tire manufacturers, in the first quarter of 2022. In our view, the company benefits from a strong competitive position driven by its global scale, brand strength and continued leadership in cutting-edge tire technology. We believe Michelin is well-positioned to enhance profitability through an ongoing shift in its product mix toward higher-margin specialty and large-diameter tires, along with improved SG&A efficiency supported by process optimization initiatives. While Michelin continues to meet all of our core investment criteria, we chose to exit our position in order to fund what we believe is a more compelling opportunity in Daikin Industries.
We received shares of Millrose Properties after it was spun off from Lennar on February 7. Millrose is a new publicly traded company focused on land banking and development. As part of the spinoff, Lennar transferred $6 billion worth of land inventory to Millrose. We believe this spinoff will allow Lennar to be a more capital efficient homebuilder, as less land inventory should lead to stronger FREE cash flow generation and better returns on invested capital. As such, we decided to sell our shares of Millrose and continue with our investment in Lennar’s core homebuilding operations, which we view as a more optimal investment.
Alphabet, Inc.
Headquartered in Mountain View, California and founded by Larry Page and Sergey Brin, Alphabet is one of the world’s most dominant and innovative technology companies. Best known as the parent company of Google, Alphabet generates most of its revenue from digital advertising, particularly search. Google currently holds an estimated 87% market share in U.S. search and nearly 90% globally, underpinning a highly profitable ad business that accounts for roughly 75% of Alphabet’s total revenue.
While Google was founded in 1998 and became public in 2004, Alphabet was created in 2015 to provide greater transparency and operational independence across its varied business lines. Beyond its core, the company has increasingly diversified into accelerating products, including Google Cloud and YouTube’s suite of subscription services (YouTube Premium, YouTube TV and YouTube Music). Today, Google Services (Search, YouTube, Chrome, Android and the Play Store) makes up ~87% of total revenue, while Google Cloud represents ~13%. Alphabet also invests in longer-term innovation through its Other Bets segment, which includes autonomous driving (Waymo), life sciences (Verily) and advanced AI research (DeepMind).
High-Quality Business
Some of the quality characteristics we have identified for Alphabet include:
Unrivaled scale in global search and digital advertising, protected by powerful network effects and vast proprietary data;
An integrated ecosystem—across Search, YouTube, Android, Chrome and Gmail—that supports user retention and ad targeting efficiency;
Category leadership in digital media, with YouTube generating over $45 billion in revenue in 2024 and expanding rapidly through ad-supported and subscription models;
Emerging strength in cloud computing, with Google Cloud now profitable and scaling meaningfully; and
A culture of innovation, supported by its Other Bets incubator, which allows Alphabet to invest in moonshot ideas while maintaining financial discipline.
Attractive Valuation
We believe shares of Alphabet are significantly undervalued at less than 12x our estimate of normalized earnings. The company continues to scale high-margin businesses like Google Cloud and YouTube’s subscription offerings while maintaining robust FREE cash flow generation from its dominant advertising segment.
Compelling Catalysts
Catalysts we have identified for Alphabet, which we believe will cause its stock price to appreciate over our three- to five-year investment horizon, include:
Sustained leadership in search and digital advertising, reinforced by Google’s unmatched first-party data and adtech platform;
Improving profitability, margin expansion and market share gains for Google Cloud as it effectively competes at scale with AWS and Microsoft Azure; and
Continued growth in YouTube subscription revenues as YouTube TV—which is on track to become the largest U.S. pay-TV provider by 2026—captures share from traditional cable providers and premium, ad-free content attracts a broader audience.
Potential Future Catalyst: Alphabet’s deep expertise and resources in AI, particularly through the Gemini model family (the company’s flagship large language model), could enhance monetization across Ads, Search and Cloud. Though this is not explicitly included in our valuation estimates, we view the possibility as a “free option.”
Daikin Industries, Ltd.
Founded in 1924 and headquartered in Japan, Daikin Industries is the world’s largest manufacturer of commercial and residential air conditioner systems. The company produces air conditioning systems, heat pumps, air purifiers and refrigeration equipment (which accounts for over 90% of revenue). Daikin has long been an industry leader in developing energy-efficient products, leadership that was molded by its roots in Japan, a region with limited natural resources and high energy costs. Its R&D organization includes a global Technology Innovation Center and 39 other regional development facilities that customize offerings to local markets. Today, Daikin’s products are sold in over 170 countries, with leading market positions in Japan, China and the U.S. residential market.
Air conditioning products often require professional installation, making distribution a critical factor in Daikin’s success. Its 2012 acquisition of Goodman expanded its reach in the U.S., adding hundreds of distribution points and a platform from which to expand. In China, Daikin sells high-end, multi-unit systems through its specialty ProShop retail stores, earning higher margins by selling directly to homeowners rather than through developers or contractors.
High-Quality Business
Some of the quality characteristics we have identified for Daikin include:
Strong brand recognition and a large global distribution network provide competitive advantages and serve as high barriers to entry;
History of technological innovation, particularly in energy-saving inverters and variable refrigerant flow systems; and
Ability to tailor products to different local preferences across geographies and varied levels of HVAC regulations, thanks to Daikin’s network of global production bases and development facilities.
Attractive Valuation
Based on our estimates, shares of the company are significantly undervalued. We believe greater global adoption of air conditioning, as well as higher priced and more profitable technologies (e.g., heat pumps and inverters), will lead to higher normalized FREE cash flow than currently appreciated by the market.
Compelling Catalysts
Catalysts we have identified for Daikin, which we believe will cause its stock price to appreciate over our three- to five-year investment horizon, include:
As the largest global supplier and a leader in energy efficiency, Daikin is uniquely positioned to benefit from the increase in worldwide air conditioning adoption rates (projected to triple by 2050) while leveraging its intellectual property in inverters and heat pumps;
Market share gains in the U.S. as Daikin further leverages its technology in premium residential air conditioning, supported by Goodman’s distribution network;
Ongoing adoption of heat pumps in Europe and a recovery in China’s property market; and
Entering the final year of its Fusion 25 strategic plan with room for improvements in advancing technological development, strengthening sales and service networks, promoting digital transformation, and more.
Conclusion
As we progress through the early stages of 2025, the convergence of persistent macroeconomic forces with the renewed presence of trade conflicts has added to the uncertainty facing equity markets. While there certainly was no shortage of headlines during the quarter, we believe trying to time the market or to predict the impact of these developments is a futile task. Instead, our focus remains on evaluating whether these events are truly analyzable, materially differentiated and meaningful to long-term investors—or simply noise that fuels short-term speculation.
At Aristotle Capital, we do not aim to capture short-term gains by “trading” portfolios based on the news of the day. Rather, we remain committed to identifying companies we believe exhibit high-quality characteristics and the resilience to perform across full market cycles. In our experience, breaking news is often fleeting and not quite as impactful as many market participants believe it to be. On the contrary, during periods of economic uncertainty high-quality companies are oftentimes able to make decisions that result in market share gains, thus, potentially, increasing their longer-term intrinsic worth. As such, we will continue to study the microeconomic decisions of individual businesses rather than attempt to predict macroeconomic events or outcomes.
Disclosures
The opinions expressed herein are those of Aristotle Capital Management, LLC (Aristotle Capital) and are subject to change without notice. Past performance is not a guarantee or indicator of future results. This material is not financial advice or an offer to buy or sell any product. You should not assume that any of the securities transactions, sectors or holdings discussed in this report were or will be profitable, or that recommendations Aristotle Capital makes in the future will be profitable or equal the performance of the securities listed in this report. The portfolio characteristics shown relate to the Aristotle Global Equity strategy. Not every client’s account will have these characteristics. Aristotle Capital reserves the right to modify its current investment strategies and techniques based on changing market dynamics or client needs. There is no assurance that any securities discussed herein will remain in an account’s portfolio at the time you receive this report or that securities sold have not been repurchased. The securities discussed may not represent an account’s entire portfolio and, in the aggregate, may represent only a small percentage of an account’s portfolio holdings. The performance attribution presented is of a representative account from Aristotle Capital’s Global Equity Composite. The representative account is a discretionary client account which was chosen to most closely reflect the investment style of the strategy. The criteria used for representative account selection is based on the account’s period of time under management and its similarity of holdings in relation to the strategy. Recommendations made in the last 12 months are available upon request.
Returns are presented gross and net of investment advisory fees and include the reinvestment of all income. Gross returns will be reduced by fees and other expenses that may be incurred in the management of the account. Net returns are presented net of actual investment advisory fees and after the deduction of all trading expenses.
All investments carry a certain degree of risk, including the possible loss of principal. Investments are also subject to political, market, currency and regulatory risks or economic developments. International investments involve special risks that may in particular cause a loss in principal, including currency fluctuation, lower liquidity, different accounting methods and economic and political systems, and higher transaction costs. These risks typically are greater in emerging markets. Securities of small‐ and medium‐sized companies tend to have a shorter history of operations, be more volatile and less liquid. Value stocks can perform differently from the market as a whole and other types of stocks.
The material is provided for informational and/or educational purposes only and is not intended to be and should not be construed as investment, legal or tax advice and/or a legal opinion. Investors should consult their financial and tax adviser before making investments. The opinions referenced are as of the date of publication, may be modified due to changes in the market or economic conditions, and may not necessarily come to pass. Information and data presented has been developed internally and/or obtained from sources believed to be reliable. Aristotle Capital does not guarantee the accuracy, adequacy or completeness of such information.
Aristotle Capital Management, LLC is an independent investment adviser registered under the Investment Advisers Act of 1940, as amended. Registration does not imply a certain level of skill or training. More information about Aristotle Capital, including our investment strategies, fees and objectives, can be found in our Form ADV Part 2, which is available upon request. ACM-2503-131
Performance Disclosures
Composite returns for all periods ended March 31, 2025 are preliminary pending final account reconciliation.MSCI ACWI (Net) was stated as the primary benchmark on June 1, 2024 and MSCI World (Net) became the secondary benchmark. The Aristotle Global Equity Composite has an inception date of November 1, 2010; however, the strategy initially began at Howard Gleicher’s predecessor firm in July 2007. A supplemental performance track record from January 1, 2008 through October 31, 2010 is provided on this page and complements the Global Equity Composite presentation that is located at the end of this presentation. The performance results were achieved while Mr. Gleicher managed the strategy at a prior firm. The returns are those of a publicly available mutual fund from the fund’s inception through Mr. Gleicher’s departure from the firm. During that time, Mr. Gleicher had primary responsibility for managing the fund.
Past performance is not indicative of future results. The information provided should not be considered financial advice or a recommendation to purchase or sell any particular security or product. Performance results for periods greater than one year have been annualized. Returns are presented gross and net of investment advisory fees and include the reinvestment of all income. Gross returns will be reduced by fees and other expenses that may be incurred in the management of the account. Net returns are presented net of actual investment advisory fees and after the deduction of all trading expenses.
Index Disclosures
MSCI ACWI (Net) was stated as the primary benchmark on June 1, 2024 and MSCI World (Net) became the secondary benchmark. The MSCI ACWI captures large and mid-cap representation across 23 developed markets and 24 emerging markets countries. With approximately 2,600 constituents, the Index covers approximately 85% of the global investable equity opportunity set. The MSCI ACWI Equal Weighted Index represents an alternative weighting scheme to its market cap weighted parent index, MSCI ACWI. The Index includes the same constituents as its parent (large and mid-cap securities from 23 developed markets and 24 emerging markets countries. However, at each quarterly rebalance date, all index constituents are weighted equally, effectively removing the influence of each constituent’s current price (high or low). Between rebalances, index constituent weightings will fluctuate due to price performance. The MSCI World Index is a free float-adjusted market capitalization weighted index that is designed to measure the equity market performance of developed markets. The MSCI World Index consists of the following 23 developed market country indexes: Australia, Austria, Belgium, Canada, Denmark, Finland, France, Germany, Hong Kong, Ireland, Israel, Italy, Japan, Netherlands, New Zealand, Norway, Portugal, Singapore, Spain, Sweden, Switzerland, the United Kingdom and the United States. The MSCI Emerging Markets Index is a free float-adjusted market capitalization-weighted index that is designed to measure equity market performance of emerging markets. The MSCI Emerging Markets Index consists of the following 24 emerging market country indexes: Brazil, Chile, China, Colombia, Czech Republic, Egypt, Greece, Hungary, India, Indonesia, Korea, Kuwait, Malaysia, Mexico, Peru, Philippines, Poland, Qatar, Saudi Arabia, South Africa, Taiwan, Thailand, Turkey and United Arab Emirates. The MSCI ACWI Growth Index captures large and mid-cap securities exhibiting overall growth style characteristics across 23 developed markets countries and 24 emerging markets countries. The MSCI ACWI Value Index captures large and mid-cap securities exhibiting overall value style characteristics across 23 developed markets countries and 24 emerging markets countries. The MSCI Europe Index captures large and mid-cap representation across 15 developed markets countries in Europe. With approximately 400 constituents, the Index covers approximately 85% of the free float-adjusted market capitalization across the European developed markets equity universe. The MSCI Japan Index is designed to measure the performance of the large and mid-cap segments of the Japanese market. With approximately 200 constituents, the Index covers approximately 85% of the free float-adjusted market capitalization in Japan. The S&P 500® Index is the Standard & Poor’s Composite Index of 500 stocks and is a widely recognized, unmanaged index of common stock prices. The S&P 500 Equal Weight Index is designed to be the size-neutral version of the S&P 500. It includes the same constituents as the cap-weighted S&P 500, but each company in the S&P 500 Equal Weight Index is allocated the same weight at each quarterly rebalance. The Bloomberg Global Aggregate Bond Index is a flagship measure of global investment grade debt from 27 local currency markets. This multi-currency benchmark includes Treasury, government-related, corporate and securitized fixed rate bonds from both developed and emerging markets issuers. The Brent Crude Oil Index is a major trading classification of sweet light crude oil that serves as a major benchmark price for purchases of oil worldwide. The volatility (beta) of the Composite may be greater or less than the benchmarks. It is not possible to invest directly in these indexes.
The U.S. equity market began 2025 with a modest decline, with the S&P 500 Index falling 4.27% during the first quarter. In contrast, bonds provided a measure of stability, as the Bloomberg U.S. Aggregate Bond Index rose 2.78%.
On a sector basis, negative performance was led by four of the eleven sectors within the Russell 1000 Growth Index in the first quarter of 2025. The weakest sectors were Consumer Discretionary and Information Technology. The best-performing sectors were Energy and Real Estate.
Sources: CAPS CompositeHubTM, Bloomberg Past performance is not indicative of future results. Aristotle Atlantic Large Cap Growth Composite returns are presented gross and net of investment advisory fees and include the reinvestment of all income. Gross returns will be reduced by fees and other expenses that may be incurred in the management of the account. Net returns are presented net of actual investment advisory fees and after the deduction of all trading expenses. Aristotle Atlantic Composite returns are preliminary pending final account reconciliation. Please see important disclosures at the end of this document.
U.S. economic data reported during the quarter presented a mixed picture. Real GDP growth slowed to an annualized rate of 2.4%, while inflation remained stable. The Consumer Price Index (CPI) rose 2.8% year-over-year in February, reflecting moderate inflationary pressures. Meanwhile, the labor market remained resilient, with the unemployment rate hovering around 4%. However, consumer strength showed signs of strain, as retail sales slowed from levels seen late last year, potentially impacted by adverse weather and broader macroeconomic uncertainty.
Trade policy was a major source of uncertainty during the quarter. President Trump announced a series of new tariffs on imports from Canada, Mexico and China, citing concerns over illegal immigration, drug trafficking and intellectual property theft. Targeted industries included autos, steel, aluminum and energy, particularly Venezuelan oil. While tariffs initially raised concerns, the administration’s selective enforcement and flexible implementation approach helped ease market anxiety. In response to the evolving economic landscape, the Federal Reserve (Fed) maintained its target range for the federal funds rate at 4.25% to 4.50%. The central bank acknowledged potential inflationary pressures from tariffs and moderated expectations for economic growth in 2025.
Despite broader economic headwinds, corporate earnings remained strong. S&P 500 companies reported impressive 17.8% year-over-year earnings growth, the highest rate since 2021. However, tariff-related uncertainties loomed large, with more than 220 companies referencing tariffs in their earnings calls and nearly 15% issuing negative earnings guidance.
On the domestic front, a government shutdown was averted, as President Trump signed a six-month funding bill. Senate Democratic Leader Chuck Schumer supported the measure, believing that a shutdown would have allowed the Department of Government Efficiency (DOGE) to terminate government services at a faster rate.
Geopolitically, the U.S. continued its mediation efforts in the Middle East and Ukraine. While a temporary ceasefire agreement was reached between Israel and Hamas in January, tensions flared again in March over disputes regarding hostage releases in Gaza. In Ukraine, U.S. aid was briefly paused following a contentious White House meeting between presidents Trump and Zelensky. Financial and intelligence support resumed after Ukraine signaled it was open to a ceasefire and agreed to revisit terms of a potential mineral deal, aiming to offset the costs of U.S. assistance.
Performance and Attribution Summary
For the first quarter of 2025, Aristotle Atlantic’s Large Cap Growth Composite posted a total return of -9.55% gross of fees (-9.68% net of fees), outperforming the -9.97% return of the Russell 1000 Growth Index.
Performance (%)
1Q25
1 Year
3 Years
5 Years
Since Inception*
Large Cap Growth Composite (gross)
-9.55
5.89
6.48
16.82
15.95
Large Cap Growth Composite (net)
-9.68
5.39
6.01
16.32
15.47
Russell 1000 Growth Index
-9.97
7.76
10.10
20.09
17.48
*The Large Cap Growth Composite has an inception date of November 1, 2016. Past performance is not indicative of future results. Aristotle Atlantic Large Cap Growth Equity Composite returns are presented gross and net of investment advisory fees and include the reinvestment of all income. Gross returns will be reduced by fees and other expenses that may be incurred in the management of the account. Net returns are presented net of actual investment advisory fees and after the deduction of all trading expenses. Aristotle Atlantic Composite returns are preliminary pending final account reconciliation. Please see important disclosures at the end of this document
Sources: FactSet Past performance is not indicative of future results. Sector attribution shows how much of a portfolio’s overall return is directly attributable to stock selection and asset allocation decisions within the portfolio, highlighting which sectors contributed or detracted to the total return. Attribution includes the reinvestment of income. Please see important disclosures at the end of this document.
During the first quarter, the portfolio’s outperformance relative to the Russell 1000 Growth Index was led by security selection. Security selection in Consumer Discretionary and Financials contributed the most to relative performance. Conversely, security selection in Information Technology and Industrials detracted.
Contributors and Detractors for 1Q 2025
Relative Contributors
Relative Detractors
Tesla
ServiceNow
Visa
Bio-Techne
O’Reilly Automotive
Eli Lilly
Guardant Health
Datadog
Adaptive Biotechnologies
Nvidia
Contributors
Tesla
The underweight in Tesla contributed to performance in the first quarter of 2025. Tesla’s automobile sales declined in the quarter, in part due to factory changeovers that were required for updates to the company’s best-selling vehicle, the Model Y. This resulted in slower sales volume in the quarter. Competition from China’s BYD is causing market share losses for Tesla in several non-U.S. markets. The CEO’s position as an advisor to President Trump has damaged Tesla’s brand image among a cohort of traditional electric vehicle buyers.
Visa
Visa was a relative contributor in the first quarter, driven by strong fourth quarter earnings supported by robust holiday-season consumer spending and sustained growth in payment volumes, trends that continued into January. The company also indicated optimism regarding potential benefits from a more favorable regulatory environment under the new presidential administration. Additionally, two of the company’s fastest-growing segments, New Flows and Value-Added Services, continued to achieve above-average growth, capitalizing on substantial and expanding market opportunities.
Detractors
ServiceNow
ServiceNow detracted from performance in the first quarter, as the company reported guidance during the fourth quarter earnings call that was below investor expectations. Investors have also begun to incorporate tougher macroeconomic headwinds and negative impacts from the DOGE government spending cuts into their weaker outlook for software revenue growth in 2025.
Bio-Techne
Bio-Techne detracted from performance in the first quarter on fears around National Institutes of Health (NIH) funding concerns. The Trump administration announced caps on administrative costs for NIH-funded research projects, and this has resulted in fears of a slowdown in the academic and government segment. Bio-Techne has recently stated that its view is, worst case, a possible 50 basis point headwind to growth. Bio-Techne has shown positive momentum following a strong fiscal second quarter earnings report that included organic revenue growth of 9%.
Recent Portfolio Activity
The table below shows all buys and sells completed during the quarter, followed by a brief rationale.
Buys
Sells
Oracle
Datadog
CowdStrike
Amphenol
Buys
Oracle
Oracle provides products and services that address enterprise information technology (IT) environments. The company’s products and services include enterprise applications and infrastructure offerings that are delivered worldwide through a variety of flexible and interoperable IT deployment models. The company operates in three segments: Cloud and License, Hardware and Services.
We believe Oracle’s cloud infrastructure product, OCI 2.0, will continue to demonstrate strong revenue growth over several quarters. Additionally, we see the rapid growth of artificial intelligence (AI) computing needs as being a differentiated growth driver for Oracle. We believe that Oracle will continue to drive positive outcomes for the Cerner business through a better margin structure, as well as top-line sales synergies.
CrowdStrike
CrowdStrike provides cybersecurity products and services that offer endpoint protection and threat intelligence solutions, enabling customers to prevent damage from targeted attacks, detect advanced malware and search all endpoints. The company’s open cloud architecture enables it and third-party partners to rapidly innovate, build and deploy new cloud modules that can provide customers with enhanced functionality across a myriad of use cases.
We see the cloud cybersecurity market as positioned to experience strong growth over the next few years, driven by continued migration from on-premises to cloud-based architecture. We believe CrowdStrike can benefit from this trend due to its early-mover advantage, multiple product offerings and native integrations with leading cloud platforms. The increasing threats from state-sanctioned cybercriminals using high-performance computing and AI necessitate higher spending on advanced cybersecurity products. The total addressable market (TAM) is projected to grow significantly over the next four calendar years. Additionally, CrowdStrike’s cloud-native architecture and unified platform approach provide competitive advantages, resulting in high customer retention and widespread adoption of multiple modules.
Sells
Datadog
We sold the position in Datadog following the company’s most recent quarterly results. We remain concerned about the loss of a key customer(s) in the AI development space and the impact that could have on Datadog’s growth rate. While the company is executing on its core business, we see a rising risk of a slowing top-line growth rate, which we believe would result in valuation compression and a negative impact on the stock performance.
Amphenol
We sold Amphenol, as we see earnings growth opportunities in other technology names. Competitive concerns have subsided in the near term but still exist. We have chosen to exit the position.er to be better growth prospects.
Outlook
The equity markets in the first quarter declined as investors digested the potential impact of wide-ranging tariffs, along with concerns of a peak in the capital spending cycle around AI. Interest rates declined in the quarter, with the 10-year U.S. Treasury yield down about 35 basis points. The prospects of tariffs pushing prices higher could put the Fed on hold in a period when the economy starts to weaken. Economic data was mostly in line with expectations, reflecting a moderately growing economy. Although equity market valuations have pulled back, they are still in elevated territory with growing concerns of a slowdown in corporate profits. Our focus will continue to be at the company level, with an emphasis on seeking to invest in companies with secular tailwinds or strong product-driven cycles.
Disclosures
The opinions expressed herein are those of Aristotle Atlantic Partners, LLC (Aristotle Atlantic) and are subject to change without notice. Past performance is not a guarantee or indicator of future results. This material is not financial advice or an offer to purchase or sell any product. You should not assume that any of the securities transactions, sectors or holdings discussed in this report were or will be profitable, or that recommendations Aristotle Atlantic makes in the future will be profitable or equal the performance of the securities listed in this report. The portfolio characteristics shown relate to the Aristotle Atlantic Large Cap Growth strategy. Not every client’s account will have these characteristics. Aristotle Atlantic reserves the right to modify its current investment strategies and techniques based on changing market dynamics or client needs. There is no assurance that any securities discussed herein will remain in an account’s portfolio at the time you receive this report or that securities sold have not been repurchased. The securities discussed may not represent an account’s entire portfolio and, in the aggregate, may represent only a small percentage of an account’s portfolio holdings. The performance attribution presented is of a representative account from Aristotle Atlantic’s Large Cap Growth Composite. The representative account is a discretionary client account which was chosen to most closely reflect the investment style of the strategy. The criteria used for representative account selection is based on the account’s period of time under management and its similarity of holdings in relation to the strategy. Recommendations made in the last 12 months are available upon request.
Past performance is not indicative of future results. Returns are presented gross and net of investment advisory fees and include the reinvestment of all income. Gross returns will be reduced by fees and other expenses that may be incurred in the management of the account. Net returns are presented net of actual investment advisory fees and after the deduction of all trading expenses.
All investments carry a certain degree of risk, including the possible loss of principal. Investments are also subject to political, market, currency and regulatory risks or economic developments. International investments involve special risks that may in particular cause a loss in principal, including currency fluctuation, lower liquidity, different accounting methods and economic and political systems, and higher transaction costs. These risks typically are greater in emerging markets. Securities of small‐ and medium‐sized companies tend to have a shorter history of operations, be more volatile and less liquid. Value stocks can perform differently from the market as a whole and other types of stocks.
The material is provided for informational and/or educational purposes only and is not intended to be and should not be construed as investment, legal or tax advice and/or a legal opinion. Investors should consult their financial and tax adviser before making investments. The opinions referenced are as of the date of publication, may be modified due to changes in the market or economic conditions, and may not necessarily come to pass. Information and data presented has been developed internally and/or obtained from sources believed to be reliable. Aristotle Atlantic does not guarantee the accuracy, adequacy or completeness of such information.
Aristotle Atlantic Partners, LLC is an independent registered investment adviser under the Advisers Act of 1940, as amended. Registration does not imply a certain level of skill or training. More information about Aristotle Atlantic, including our investment strategies, fees and objectives, can be found in our Form ADV Part 2, which is available upon request. AAP-2504-22
Performance Disclosure
Sources: CAPS CompositeHubTM
Composite returns for all periods ended March 31, 2025 are preliminary pending final account reconciliation.
Past performance is not indicative of future results. Performance results for periods greater than one year have been annualized. Returns are presented gross and net of investment advisory fees and include the reinvestment of all income. Gross returns will be reduced by fees and other expenses that may be incurred in the management of the account. Net returns are presented net of actual investment advisory fees and after the deduction of all trading expenses
Index Disclosure
The Russell 1000® Growth Index measures the performance of the large cap growth segment of the U.S. equity universe. It includes those Russell 1000 companies with higher price-to-book ratios and higher forecasted growth values. This index has been selected as the benchmark and is used for comparison purposes only. The Russell 1000® Value Index measures the performance of the large cap value segment of the U.S. equity universe. It includes those Russell 1000 companies with lower price-to-book ratios and lower expected growth values. The Russell 2000® Index measures the performance of the small cap segment of the U.S. equity universe. The Russell 2000 Index is a subset of the Russell 3000® Index representing approximately 10% of the total market capitalization of that index. It includes approximately 2000 of the smallest securities based on a combination of their market cap and current index membership. The S&P 500® Index is the Standard & Poor’s Composite Index of 500 stocks and is a widely recognized, unmanaged index of common stock prices. The Dow Jones Industrial Average® is a price-weighted measure of 30 U.S. blue-chip companies. The Index covers all industries except transportation and utilities. The NASDAQ Composite Index measures all NASDAQ domestic and international based common type stocks listed on The NASDAQ Stock Market. The NASDAQ Composite includes over 3,000 companies, more than most other stock market indices. The Bloomberg U.S. Aggregate Bond Index is an unmanaged index of domestic investment grade bonds, including corporate, government and mortgage-backed securities. The WTI Crude Oil Index is a major trading classification of sweet light crude oil that serves as a major benchmark price for oil consumed in the United States. The 3-Month U.S. Treasury Bill is a short-term debt obligation backed by the U.S. Treasury Department with a maturity of three months. The Consumer Price Index (CPI) is a measure of the average change over time in the prices paid by urban consumers for a market basket of consumer goods and services. While stock selection is not governed by quantitative rules, a stock typically is added only if the company has an excellent reputation, demonstrates sustained growth and is of interest to a large number of investors. The volatility (beta) of the Composite may be greater or less than its respective benchmarks. It is not possible to invest directly in these indices.
The volatility observed throughout 2024 persisted into the first quarter of 2025. The Russell 2000 Index approached correction territory with a loss of -9.48% for the quarter, following a solid 2024 with the index returning 11.54%. After a moderately positive start to the quarter, February and March were a more challenging market environment due to uncertainty surrounding the precise parameters and implementation of the new administration’s policies, geopolitical tensions and a higher for longer rate environment. Continued economic growth, a stable labor market and firmer inflation data kept the Federal Reserve (Fed) on the more hawkish course they took in December. Chairman Powell held rates steady at the March FOMC meeting and indicated the Fed will maintain a more measured approach going forward, updating their economic projections and forecasts to two rate cuts in 2025.
Stylistically, value stocks outperformed their growth counterparts during the quarter as the Russell 2000 Value Index returned -7.74% compared to the -11.12% return of the Russell 2000 Growth index. This is a reversal from last year where growth significantly outperformed value.
From a factor performance perspective, the quarter saw a change in market preference to higher-quality companies, favoring dividend-paying, defensive stocks. This change in sentiment was due in part to level interest rates, moderating US economic activity, and an increase in recession risk.
At the sector level, defensive sectors outperformed cyclical sectors, with Utilities (+5.28%), a sector often perceived as a bond proxy, being the only sector in the Russell 2000 Index to post a positive return during the quarter. The worst performing sectors were Information Technology (-18.39%), Consumer Discretionary (-14.91%), Energy (-12.95%), Communications (-12.51%) and Industrials (-11.03%) while Utilities (+5.28%), Health Care (-8.29%), Materials (-6.96%), Financials (-4.35%), Real Estate (-3.28%) and Consumer Staples (-0.07%) performed best.
Sources: CAPS Composite Hub, Russell Investments
Past performance is not indicative of future results. Returns are presented gross and net of investment advisory fees and include the reinvestment of all income. Gross returns will be reduced by fees and other expenses that may be incurred in the management of the account. Net returns are presented net of actual investment advisory fees and after the deduction of all trading expenses. Aristotle Small Cap Equity Composite returns are preliminary pending final account reconciliation. Please see important disclosures at the end of this document.
Performance Review
For the first quarter of 2025, the Aristotle Small Cap Equity Composite posted a total return of -7.34% net of fees (-7.20% gross of fees), beating the -9.48% total return of the Russell 2000 Index. Outperformance was driven by strong security selection in the Information Technology, Industrials and Materials sectors coupled with an underweight allocation to Consumer Discretionary. Security selection in Consumer Discretionary, Consumer Staples and Energy coupled with an overweight allocation to Information Technology detracted.
Relative Contributors
Relative Detractors
Alamos Gold
Columbus McKinnon
Huron Consulting Group
MACOM Technology Solutions
MACOM Technology Solutions
Wolverine World Wide
AerCap Holdings
ASGN Incorporated
Merit Medical Systems
Knowles Corp
CONTRIBUTORS
Alamos Gold (AGI-CA), engages in the exploration, development, mining and extraction of precious metals. The company benefited from rising gold prices as investors purchased the commodity as an inflation hedge. We maintain our investment as we believe in the company’s lower geopolitical risk profile, solid production growth plan from 600k oz to 1M oz per year over the next five years, and strong operational track record.
Huron Consulting Group (HURN), a specialty consulting company that provides financial, operational, and digital consulting services to health care, education and commercial clients, appreciated after delivering strong results highlighted by continued momentum within the company’s health care and commercial segments, more than offsetting the education segment. We maintain our investment, as we believe the company remains well-positioned to capitalize on a demand backdrop aided by financial and operational pressures in its largest end-markets, along with secular tailwinds supporting digital transformation, analytics and cloud consulting.
DETRACTORS
Columbus McKinnon (CMCO), engages in the design, manufacture, and marketing of material handling products and systems. The company came under pressure following the announcement of its intent to acquire Kito Crosby, a global provider of lifting solutions and securement. Investor concern about the size and financing of the deal contributed to the weakness. We continue to maintain a position, for now, as we continue to evaluate the risk/reward potential associated with the deal.
MACOM Technology Solutions (MTSI), a designer and manufacturer of high-performance semiconductor products, declined along with the broader semiconductor industry during the quarter. We maintain our position, as we believe the company’s meaningful exposure to growing demand from Data Center and 5G end market applications along with the integration of recent acquisitions should drive additional shareholder value in periods to come.
Recent Portfolio Activity
Buys/Acquisitions
Sells/Liquidations
Agree Realty Corporation
Avid Bioservices
Old National Bancorp
Barnes Group
Valvoline
Designer Brands
Veeco Instruments
Flushing Financial
ModivCare
Summit Materials
BUYS/ACQUISITIONS
Agree Realty Corporation (ADC), is a real estate investment trust that owns, manages and develops primarily neighborhood community shopping centers and single tenant properties leased to major retail tenants such as Sherwin-Williams, Wal-Mart and TJX Companies. We believe the company’s high-quality portfolio, recession resistant retail categories and strong balance sheet coupled with management’s proactive tenant management and acquisition pipeline will benefit the company on a go-forward basis.
Old National Bancorp (ONB), is a regional bank serving clients primarily in the Midwest and Southeastern U.S. We believe the company’s geographic location, strong balance sheet, increased loan growth and repricing of fixed-rate loans to higher rates will benefit NIMs on a go-forward basis.
Valvoline (VVV), is a pure-play auto quick lube and maintenance service provider with over 2,000 locations in the U.S. and Canada. The company provides quick and convenient stay-in-your-car automotive preventative maintenance through its full-service oil changes from skilled technicians in less than 15minutes. We believe the company will benefit from increased market share gains, driven by both corporate and franchise expansion, growing its scale, accelerating growth and increasing its moat.
Veeco Instruments (VECO), engages in the development, manufacture, sale, and support of semiconductor process equipment. Its technologies consist of metal organic chemical vapor deposition, advanced packaging lithography, wet etch and clean, laser annealing, ion beam, molecular beam epitaxy, wafer inspection, and atomic layer deposition systems. The company should benefit from the evolution of the semiconductor chip as manufacturers seek new technologies to enhance the manufacturing process that will enable them to produce smaller and faster chips.
SELLS/LIQUIDATIONS
Avid Bioservices (CDMO), is a dedicated biologics Contract Development and Manufacturing Organization working to improve patient lives by providing high quality development and manufacturing services to biotechnology and pharmaceutical companies. The company was acquired and taken private by GHO Capital and Ampersand Capital Partners.
Barnes Group (B), is a globally recognized industrial and aerospace manufacturer and service provider that stands out for its highly engineered products, differentiated industrial technologies, and innovative solutions. The company was acquired and taken private by Apollo Funds.
Designer Brands (DBI), is a North American company which engages in the design, production, and retail of footwear and accessory brands. We sold the position due to deteriorating corporate fundamentals.
Flushing Financial (FFIC), a NY-based regional bank holding company, was sold because the shares had reached our valuation target.
ModivCare (MODV), is a Colorado-based healthcare services company that provides non-emergency medical transportation (NEMT), homecare services, and remote patient monitoring to Medicaid and Medicare populations. We sold the position due to a deteriorating fundamental outlook that resulted in a deteriorating financial position.
Summit Materials (SUM), is a North American supplier of aggregates, cement, and ready-mix concrete for the construction industry. The company was acquired by Quikrete Holdings, Inc.
Outlook
We continue to remain optimistic about the long-term potential for the small-cap segment of the U.S. market. Valuations remain compelling relative to large caps, with the Russell 2000 Index trading near multi-decade lows on a relative basis. Potential tailwinds, including deregulation, lower corporate tax rate, increased M&A activity, continued reshoring of U.S. manufacturing, and infrastructure-related spending, could provide additional support for small-cap stocks. There may be some short-term volatility as the new administration’s policies are implemented and absorbed by markets. We also remain mindful of risks such as inflation reaccelerating, increased geopolitical tensions, and potential U.S. economic weakness.
Positioning
Our current positioning is a function of our bottom-up security selection process and our ability to identify what we view as attractive investment candidates, regardless of economic sector definitions. Overweights in Industrials and Information Technology are mostly a function of our underlying company specific views rather than any top-down predictions for each sector. Conversely, we continue to be underweight in Consumer Discretionary, as we have been unable to identify what we consider to be compelling long-term opportunities that fit our discipline given the rising risk profiles of many retail businesses and a potential deceleration in goods spending following a period of strength. While the portfolio’s allocation to Health Care is modestly below that of the benchmark, we continue to remain underweight the Biotechnology industry as many companies within that group do not fit our discipline due to their elevated levels of binary risk. Meanwhile we have found more opportunities for steady company growth within the Provider, Services and Equipment industry group so more of our exposure is to that area of Health Care. Given our focus on long-term business fundamentals, patient investment approach and low portfolio turnover, the strategy’s sector positioning generally does not change significantly from quarter to quarter. However, we may take advantage of periods of volatility by adding selectively to certain companies when appropriate.
Disclosures
The opinions expressed herein are those of Aristotle Capital Boston, LLC (Aristotle Boston) and are subject to change without notice.
Past performance is not indicative of future results. The information provided in this report should not be considered financial advice or a recommendation to purchase or sell any particular security. There is no assurance that any securities discussed herein will remain in an account’s portfolio at the time you receive this report or that securities sold have not been repurchased. The securities discussed may not represent an account’s entire portfolio and, in the aggregate, may represent only a small percentage of an account’s portfolio holdings. The performance attribution presented is of a representative account from Aristotle Boston’s Small Cap Equity Composite. The representative account is a discretionary client account which was chosen to most closely reflect the investment style of the strategy. The criteria used for representative account selection is based on the account’s period of time under management and its similarity of holdings in relation to the strategy. It should not be assumed that any of the securities transactions, holdings or sectors discussed were or will be profitable, or that the investment recommendations or decisions Aristotle Boston makes in the future will be profitable or equal the performance of the securities discussed herein. Aristotle Boston reserves the right to modify its current investment strategies and techniques based on changing market dynamics or client needs. Recommendations made in the last 12 months are available upon request.
Returns are presented gross and net of investment advisory fees and include the reinvestment of all income. Gross returns will be reduced by fees and other expenses that may be incurred in the management of the account. Net returns are presented net of actual investment advisory fees and after the deduction of all trading expenses.
Effective January 1, 2022, the Aristotle Small Cap Equity Composite has been redefined to exclude accounts with meaningful industry-specific restrictions or substantial values-based screens hampering implementation of the small cap strategy.
All investments carry a certain degree of risk, including the possible loss of principal. Investments are also subject to political, market, currency and regulatory risks or economic developments. International investments involve special risks that may in particular cause a loss in principal, including currency fluctuation, lower liquidity, different accounting methods and economic and political systems, and higher transaction costs.
These risks typically are greater in emerging markets. Securities of small‐ and medium‐sized companies tend to have a shorter history of operations, be more volatile and less liquid. Value stocks can perform differently from the market as a whole and other types of stocks. The material is provided for informational and/or educational purposes only and is not intended to be and should not be construed as investment, legal or tax advice and/or a legal opinion. Investors should consult their financial and tax adviser before making investments.
The opinions referenced are as of the date of publication, may be modified due to changes in the market or economic conditions, and may not necessarily come to pass.
Aristotle Capital Boston, LLC is an independent investment adviser registered under the Investment Advisers Act of 1940, as amended. Registration does not imply a certain level of skill or training. More information about Aristotle Boston, including our investment strategies, fees and objectives, can be found in our Form ADV Part 2, which is available upon request. ACB-2504-19
Performance Disclosures
Sources: CAPS Composite Hub, Russell Investments
Composite returns for periods ended March 31, 2025, are preliminary pending final account reconciliation.
*The Aristotle Small Cap Equity Composite has an inception date of November 1, 2006, at a predecessor firm. During this time, Jack McPherson and Dave Adams had primary responsibility for managing the strategy. Performance starting January 1, 2015, was achieved at Aristotle Boston.
**For the period November 2006 through December 2006.
Past performance is not indicative of future results. Performance results for periods greater than one year have been annualized.
Effective January 1, 2022, the Aristotle Small Cap Equity Composite has been redefined to exclude accounts with meaningful industry-specific restrictions or substantial values-based screens hampering implementation of the small cap strategy.
Returns are presented gross and net of investment advisory fees and include the reinvestment of all income. Gross returns will be reduced by fees and other expenses that may be incurred in the management of the account. Net returns are presented net of actual investment advisory fees and after the deduction of all trading expenses. Please see important disclosures enclosed within this document.
Index Disclosures
The Russell 2000® Index measures the performance of the small cap segment of the U.S. equity universe. The Russell 2000 Index is a subset of the Russell 3000® Index representing approximately 10% of the total market capitalization of that index. It includes approximately 2000 of the smallest securities based on a combination of their market cap and current index membership. The Russell 2000 Growth® Index measures the performance of the small cap companies located in the United States that also exhibit a growth probability. The Russell 2000 Value® Index measures the performance of the small cap companies located in the United States that also exhibit a value probability. The volatility (beta) of the composite may be greater or less than the benchmarks. It is not possible to invest directly in these indices.
2025 in the Russell 2000: narrow leadership, lower quality led the way.
Returns were highly concentrated in 2025 with over a quarter of the index’s return coming from just 10 stocks and the top 10 industries accounted for 91% of the benchmark’s return.
At the same time, fundamentals have weakened with median ROAs declining, the percent of unprofitable companies increasing alongside balance sheets deteriorating.
Yet long-term data shows:
83% of rolling periods reward Quality
79% reward Value
2025 has challenged disciplined investors, but history shows these environments are cyclical, not permanent.
Concentration of Russell 2000 Returns: Stocks
Over a quarter of the Russell 2000’s 2025 return came from its top ten contributors
Source: FactSet; data as of 12/31/2025.
Concentration of Russell 2000 Returns: Industries
91% of the Russell 2000’s 2025 return came from its top 10 industries
Source: FactSet; data as of 12/31/2025.
Quality of Index has Declined
As of December 31, 2025
Source: Aristotle Boston analysis with data from Bloomberg and Russell Investments. Data from 7/1994 to 12/2025
Rolling 12-Month Payoffs to Quality and Value
Russell 2000 Universe, 1995 – 2025
Source: Aristotle Capital Boston analysis using Bloomberg data over the years 1995 to 2025.
The opinions expressed herein are those of Aristotle Capital Boston (Aristotle Boston) and are subject to change without notice. This material is not financial advice or an offer to purchase or sell any product. Aristotle Boston reserves the right to modify its current investment strategies and techniques based on changing market dynamics or client needs.
All investments carry a certain degree of risk, including the possible loss of principal. Investments are also subject to political, market, currency and regulatory risks or economic developments. International investments involve special risks that may in particular cause a loss in principal, including currency fluctuation, lower liquidity, different accounting methods and economic and political systems, and higher transaction costs. These risks typically are greater in emerging markets. Securities of small- and medium-sized companies tend to have a shorter history of operations, be more volatile and less liquid. Value stocks can perform differently from the market as a whole and other types of stocks. The material is provided for informational and/or educational purposes only and is not intended to be and should not be construed as investment, legal or tax advice and/or a legal opinion. Investors should consult their financial and tax adviser before making investments. The opinions referenced are as of the date of publication, may be modified due to changes in the market or economic conditions, and may not necessarily come to pass. Information and data presented has been developed internally and/or obtained from sources believed to be reliable. Aristotle Boston does not guarantee the accuracy, adequacy or completeness of such information.
Past performance is not indicative of future results. The information provided in this report should not be considered financial advice or a recommendation to purchase or sell any particular security.
Differing historical time periods are selected throughout the presentation as we believe specific periods provide the most informative historical analog for the concepts presented.
The Russell 2000® Index measures the performance of the small cap segment of the U.S. equity universe. The Russell 2000 Index is a subset of the Russell 3000® Index representing approximately 10% of the total market capitalization of that index. It includes approximately 2000 of the smallest securities based on a combination of their market cap and current index membership. The Russell 1000® Index measures the performance of the large-cap segment of the US equity universe. It is a subset of the Russell 3000® Index and includes approximately 1,000 of the largest securities based on a combination of their market cap and current index membership. The Russell 1000 represents approximately 93% of the Russell 3000® Index, as of the most recent reconstitution. The volatility (beta) of the portfolios may be greater or less than the benchmarks. It is not possible to invest directly in these indices.
Aristotle Capital Boston, LLC is an independent investment adviser registered under the Investment Advisers Act of 1940, as amended. Registration does not imply a certain level of skill or training. More information about Aristotle Boston, including our investment strategies, fees and objectives, can be found in Form ADV Part 2, which is available upon request. ACB-2603-9
Active small-cap managers experienced performance headwinds since Liberation Day. Historically, how have small-cap core, growth, and value managers performed following similar challenging periods?
Extreme small-cap active underperformance has historically been followed by recovery.
Small-cap active managers are coming off one of the worst 9-month relative performance periods in the past 25 years.
History shows that after similar drawdowns:
Alpha has typically turned positive within 6-12 months
The strongest payoffs have come over 3 years, particularly in Small Core and Small Value
Periods of pain have often set the stage for opportunity.
For disciplined, long-term investors, mean reversion has mattered.
Better Times Tend to Follow Small Active Underperformance
As of December 31, 2025
Source: Jefferies Research Services; FTSE Russell; Lipper Analytical Services; FactSet as of 12/31/2025. Subsequent alpha is calculated following the worst nine-month relative return periods for each group of small cap managers: core, growth, and value.
The opinions expressed herein are those of Aristotle Capital Boston (Aristotle Boston) and are subject to change without notice. This material is not financial advice or an offer to purchase or sell any product. Aristotle Boston reserves the right to modify its current investment strategies and techniques based on changing market dynamics or client needs.
All investments carry a certain degree of risk, including the possible loss of principal. Investments are also subject to political, market, currency and regulatory risks or economic developments. International investments involve special risks that may in particular cause a loss in principal, including currency fluctuation, lower liquidity, different accounting methods and economic and political systems, and higher transaction costs. These risks typically are greater in emerging markets. Securities of small- and medium-sized companies tend to have a shorter history of operations, be more volatile and less liquid. Value stocks can perform differently from the market as a whole and other types of stocks. The material is provided for informational and/or educational purposes only and is not intended to be and should not be construed as investment, legal or tax advice and/or a legal opinion. Investors should consult their financial and tax adviser before making investments. The opinions referenced are as of the date of publication, may be modified due to changes in the market or economic conditions, and may not necessarily come to pass. Information and data presented has been developed internally and/or obtained from sources believed to be reliable. Aristotle Boston does not guarantee the accuracy, adequacy or completeness of such information.
Past performance is not indicative of future results. The information provided in this report should not be considered financial advice or a recommendation to purchase or sell any particular security.
The Russell 2000® Index measures the performance of the small cap segment of the U.S. equity universe. The Russell 2000 Index is a subset of the Russell 3000® Index representing approximately 10% of the total market capitalization of that index. It includes approximately 2000 of the smallest securities based on a combination of their market cap and current index membership. The Russell 2000 Growth® Index measures the performance of the small cap companies located in the United States that also exhibit a growth probability. The Russell 2000 Value® Index measures the performance of the small cap companies located in the United States that also exhibit a value probability. The Russell 1000 Index is a subset of the Russell 3000® Index. It includes approximately 1000 of the largest securities based on a combination of their market cap and current index membership. The volatility (beta) of the portfolios may be greater or less than the benchmarks. It is not possible to invest directly in these indices.
Aristotle Capital Boston, LLC is an independent investment adviser registered under the Investment Advisers Act of 1940, as amended. Registration does not imply a certain level of skill or training. More information about Aristotle Boston, including our investment strategies, fees and objectives, can be found in Form ADV Part 2, which is available upon request. ACB-2603-8


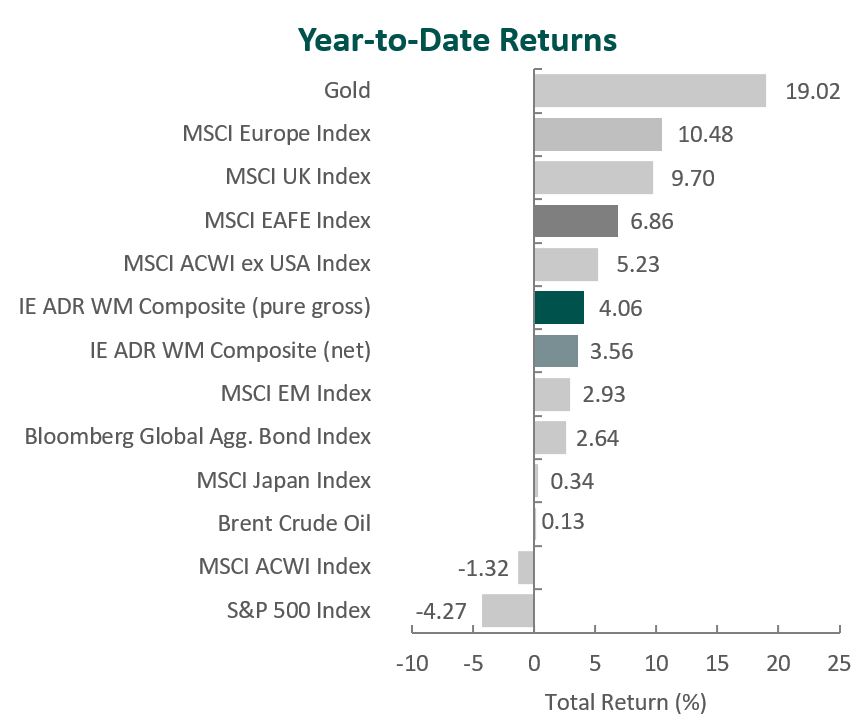
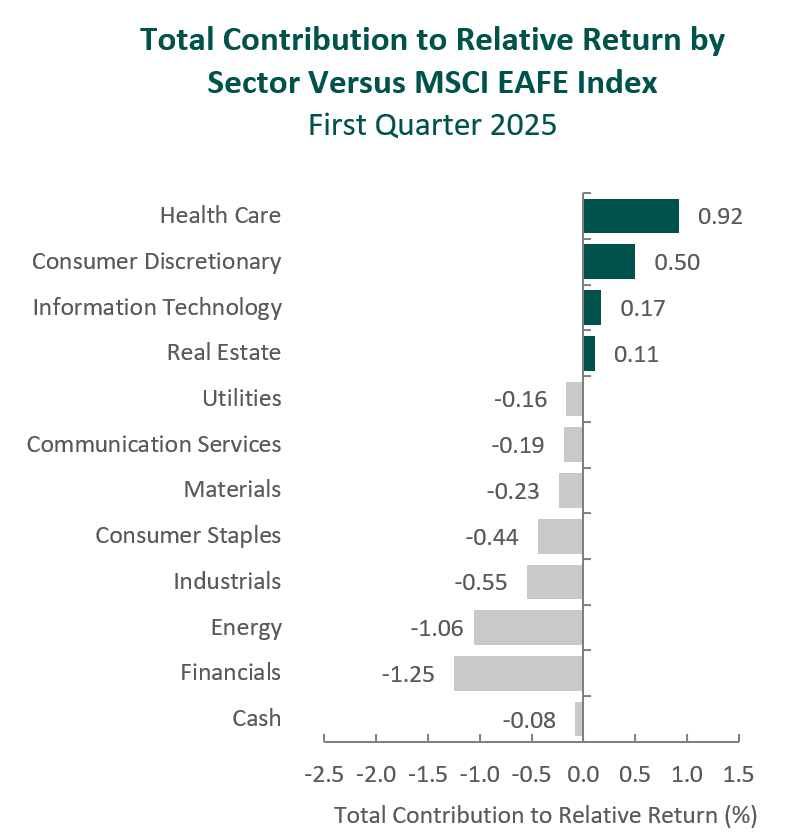
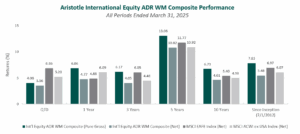
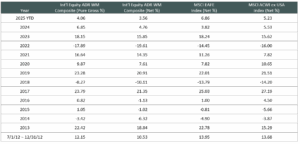
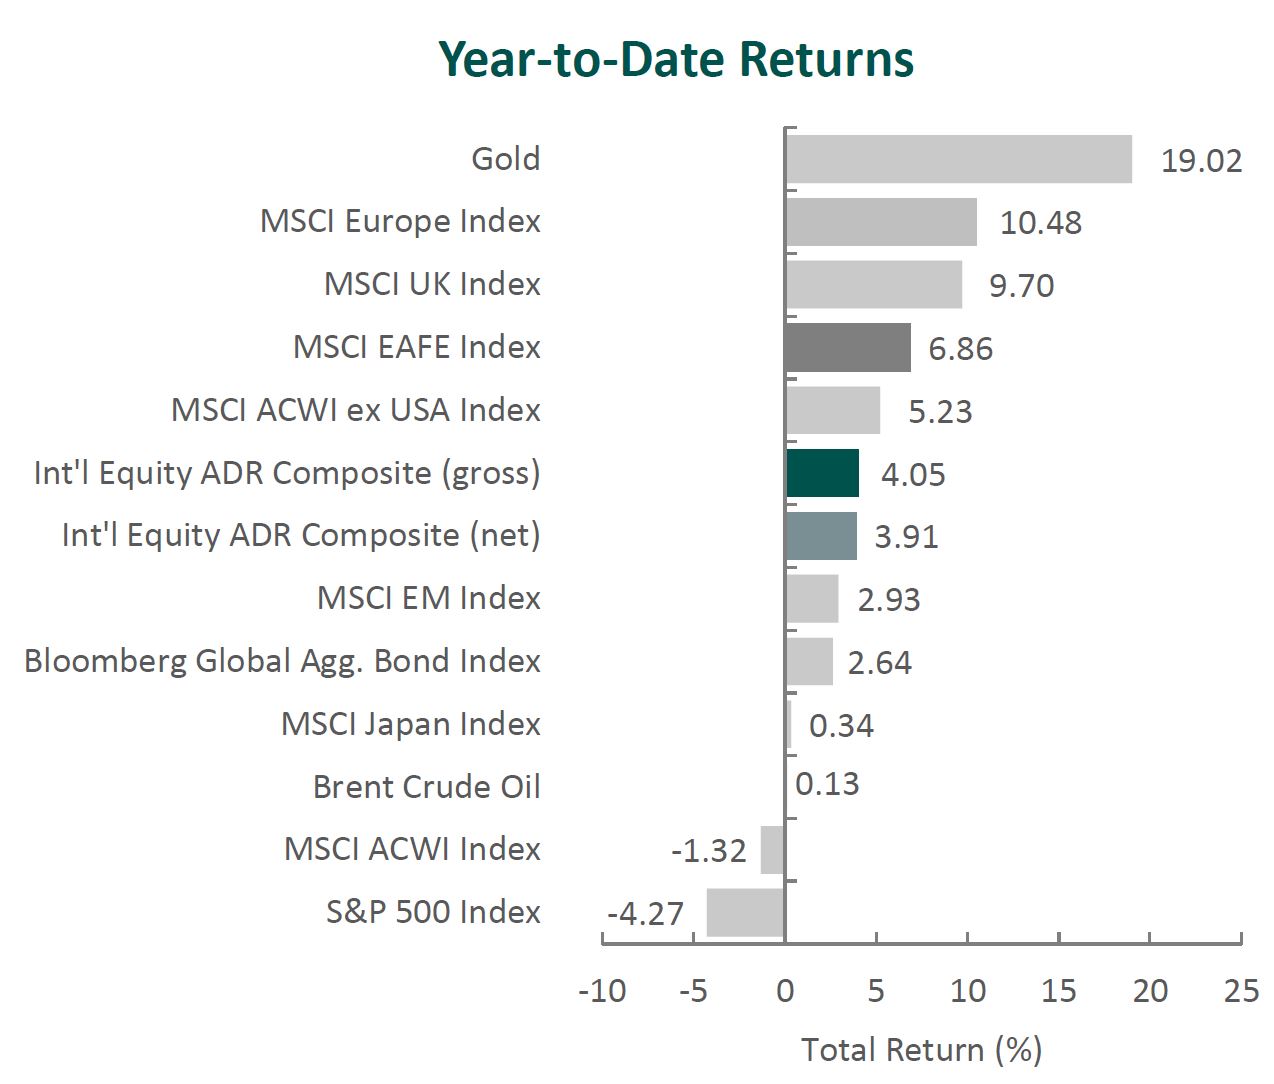
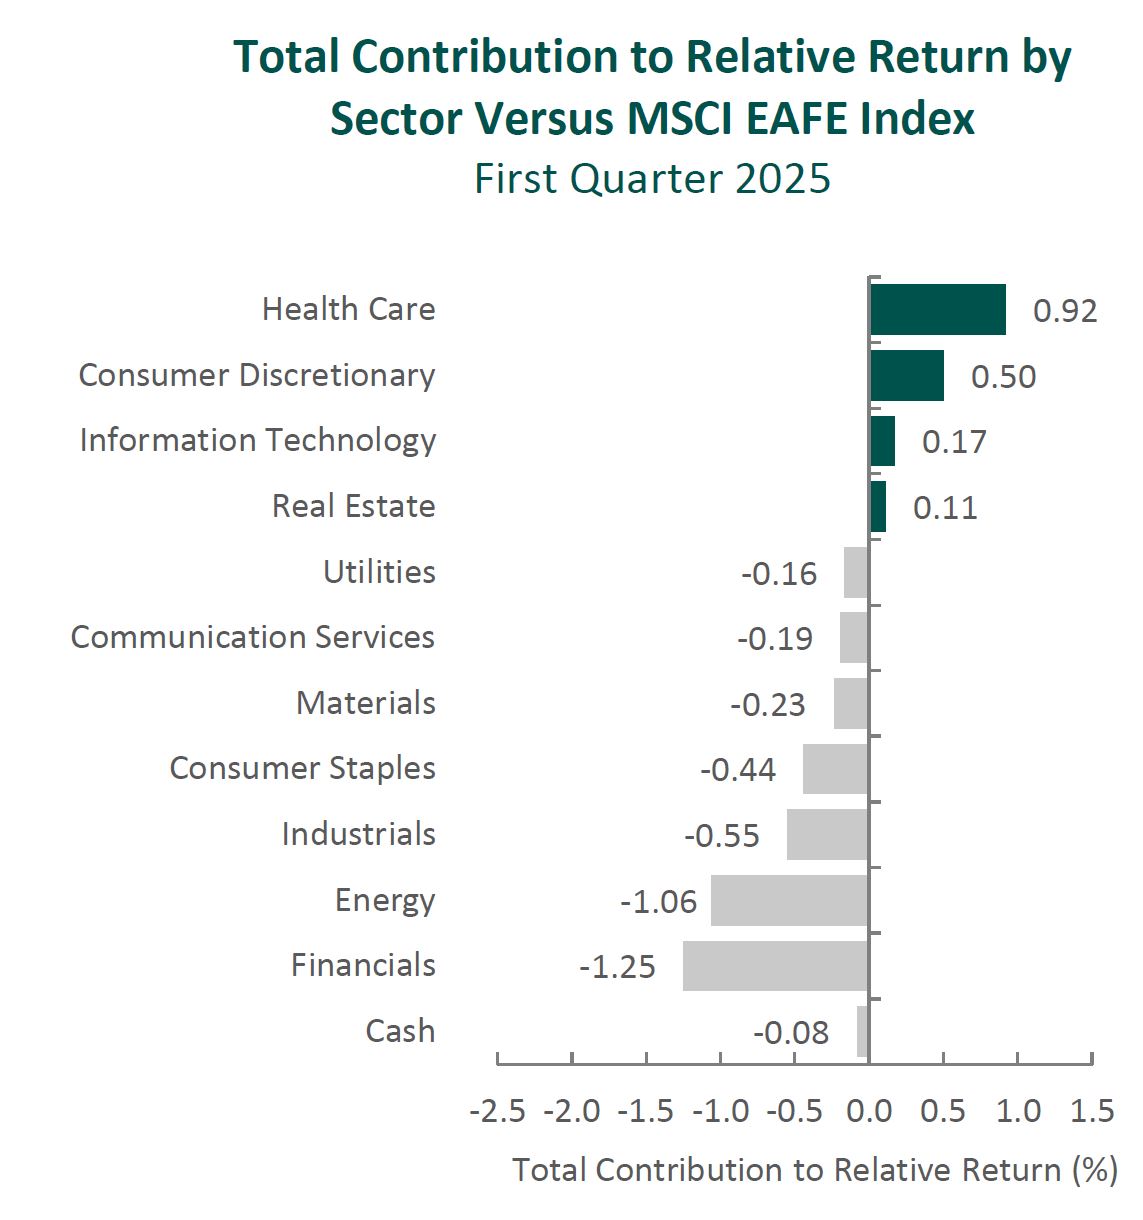
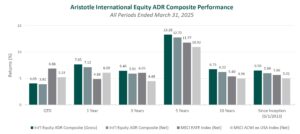
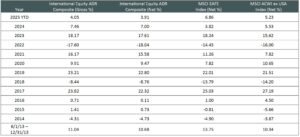


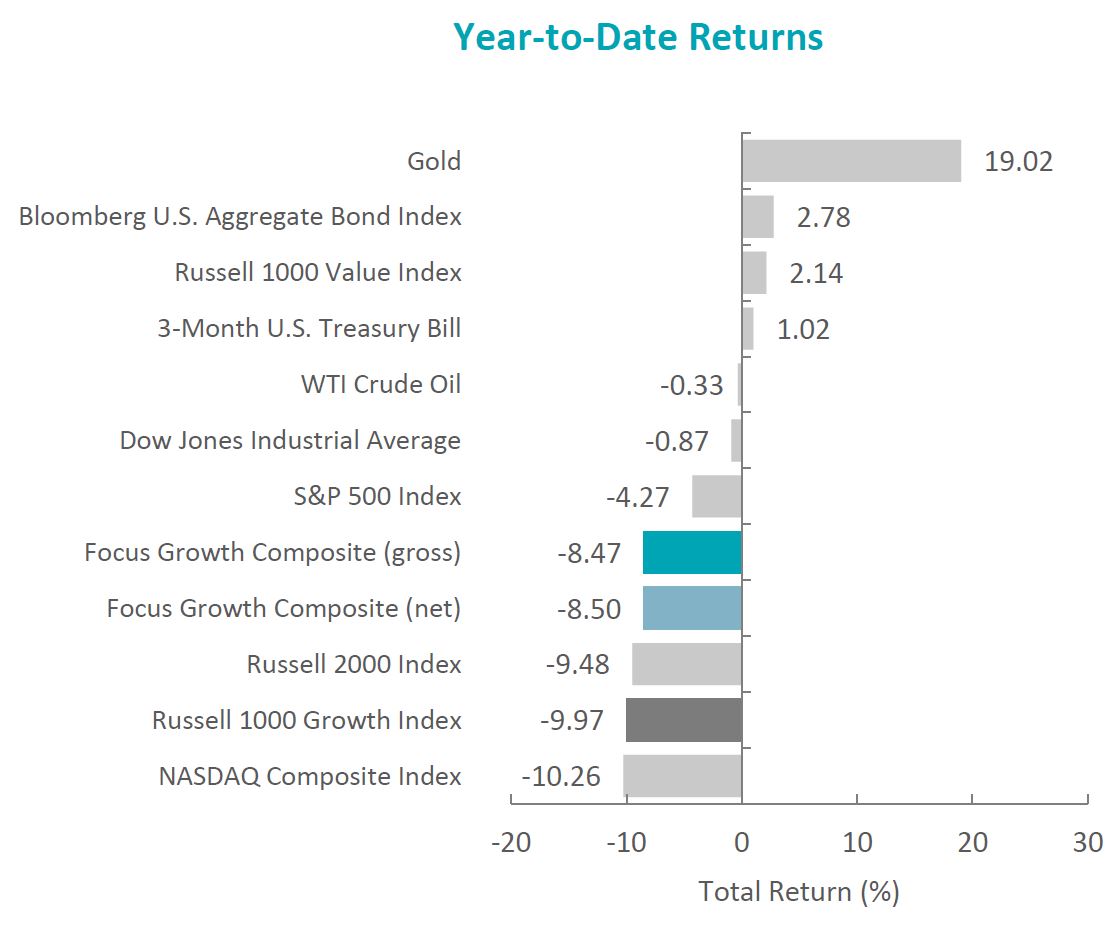
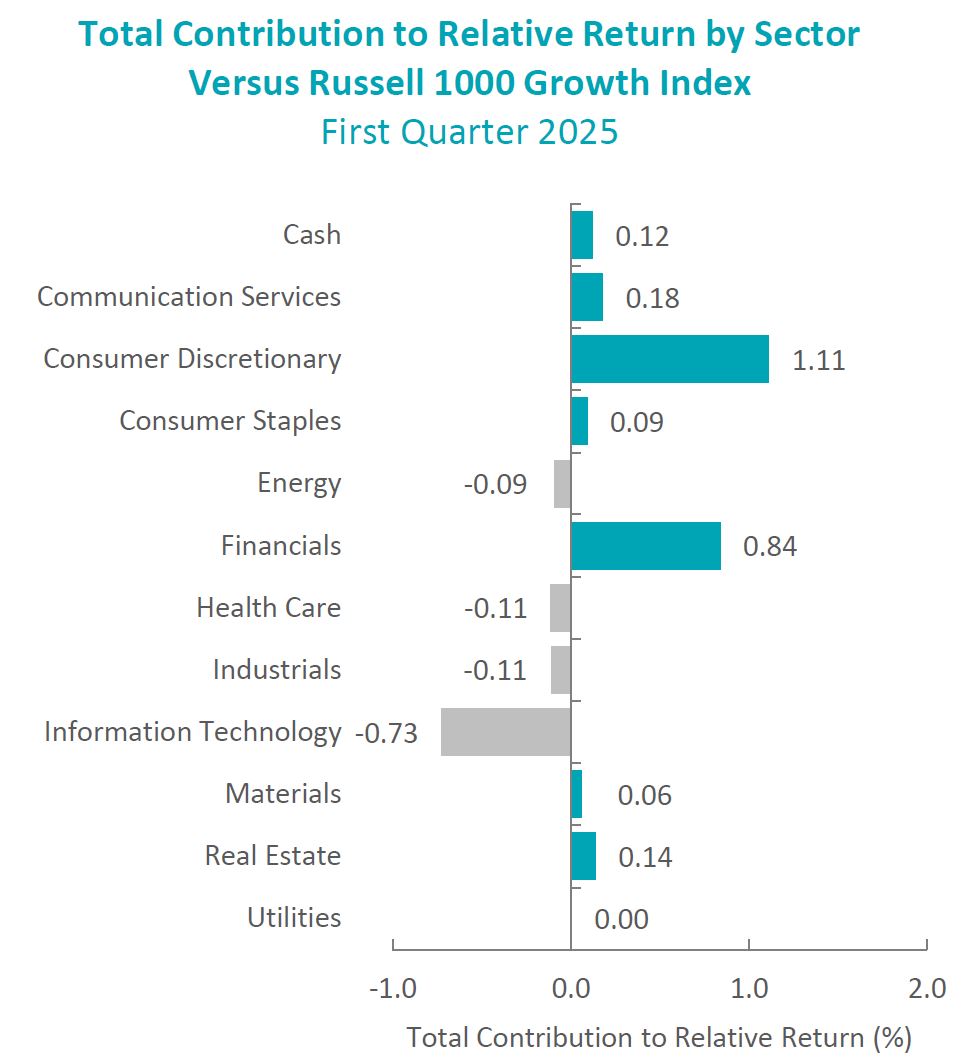
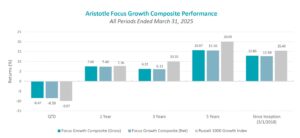
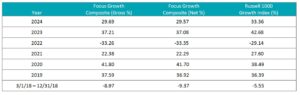 Sources: CAPS CompositeHubTM


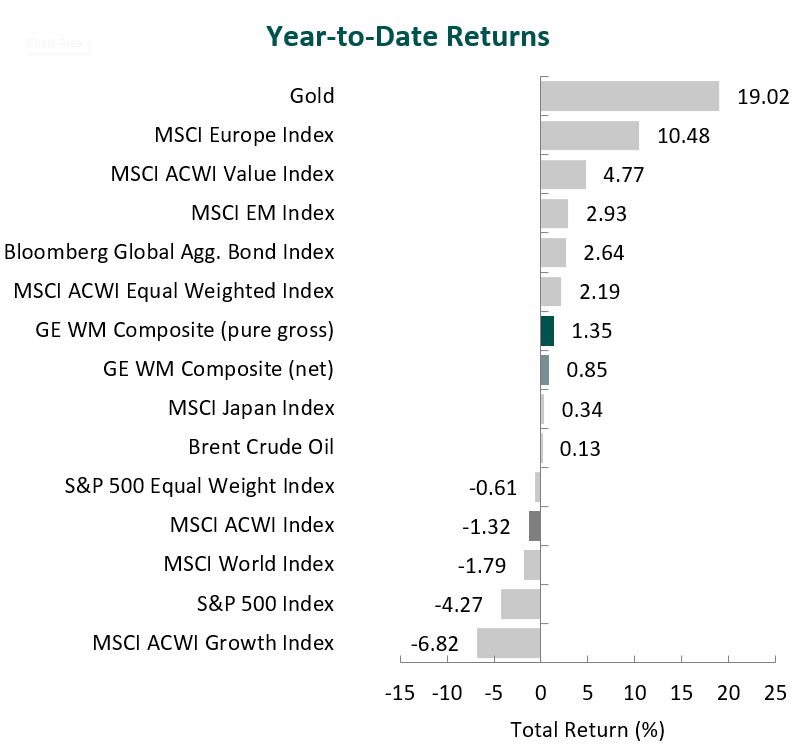
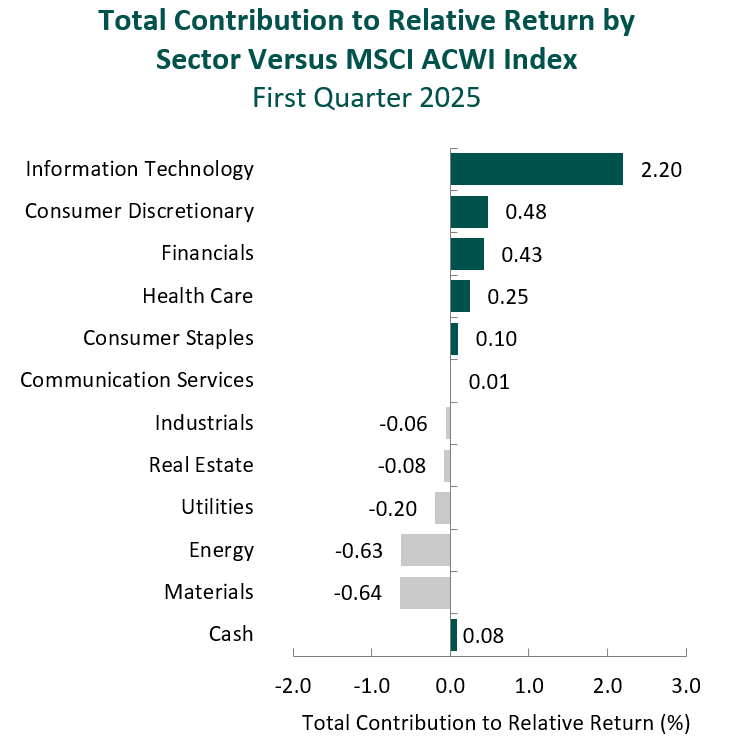
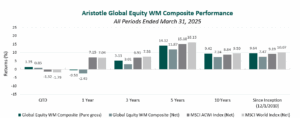
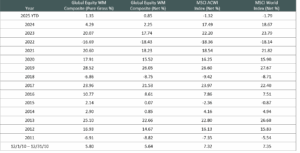

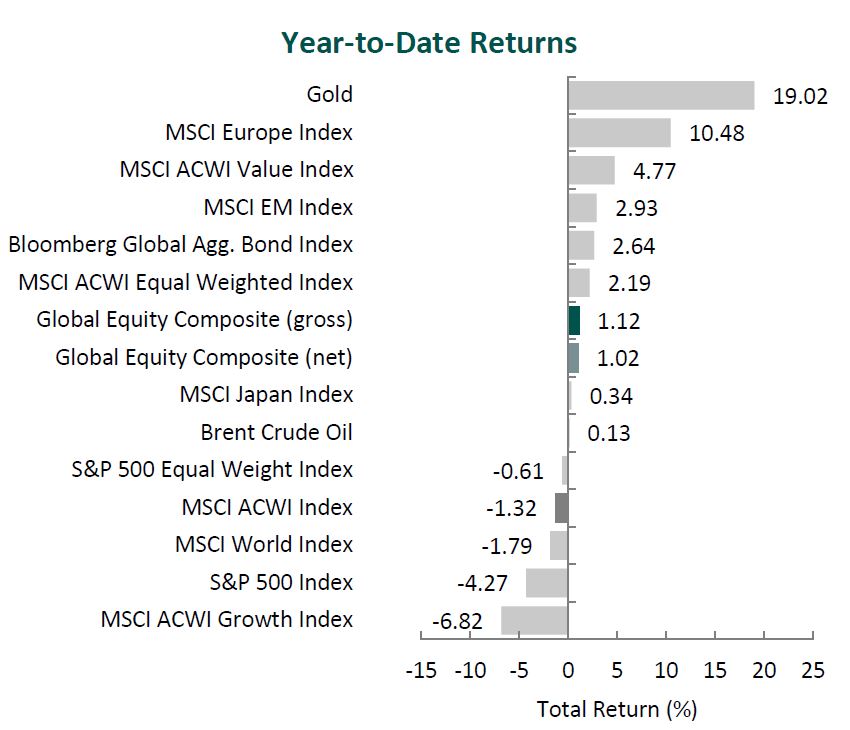
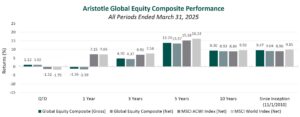
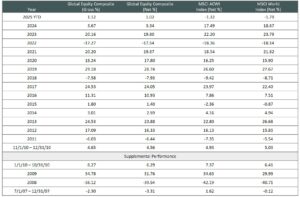 Composite returns for all periods ended March 31, 2025 are preliminary pending final account reconciliation. MSCI ACWI (Net) was stated as the primary benchmark on June 1, 2024 and MSCI World (Net) became the secondary benchmark. The Aristotle Global Equity Composite has an inception date of November 1, 2010; however, the strategy initially began at Howard Gleicher’s predecessor firm in July 2007. A supplemental performance track record from January 1, 2008 through October 31, 2010 is provided on this page and complements the Global Equity Composite presentation that is located at the end of this presentation. The performance results were achieved while Mr. Gleicher managed the strategy at a prior firm. The returns are those of a publicly available mutual fund from the fund’s inception through Mr. Gleicher’s departure from the firm. During that time, Mr. Gleicher had primary responsibility for managing the fund.


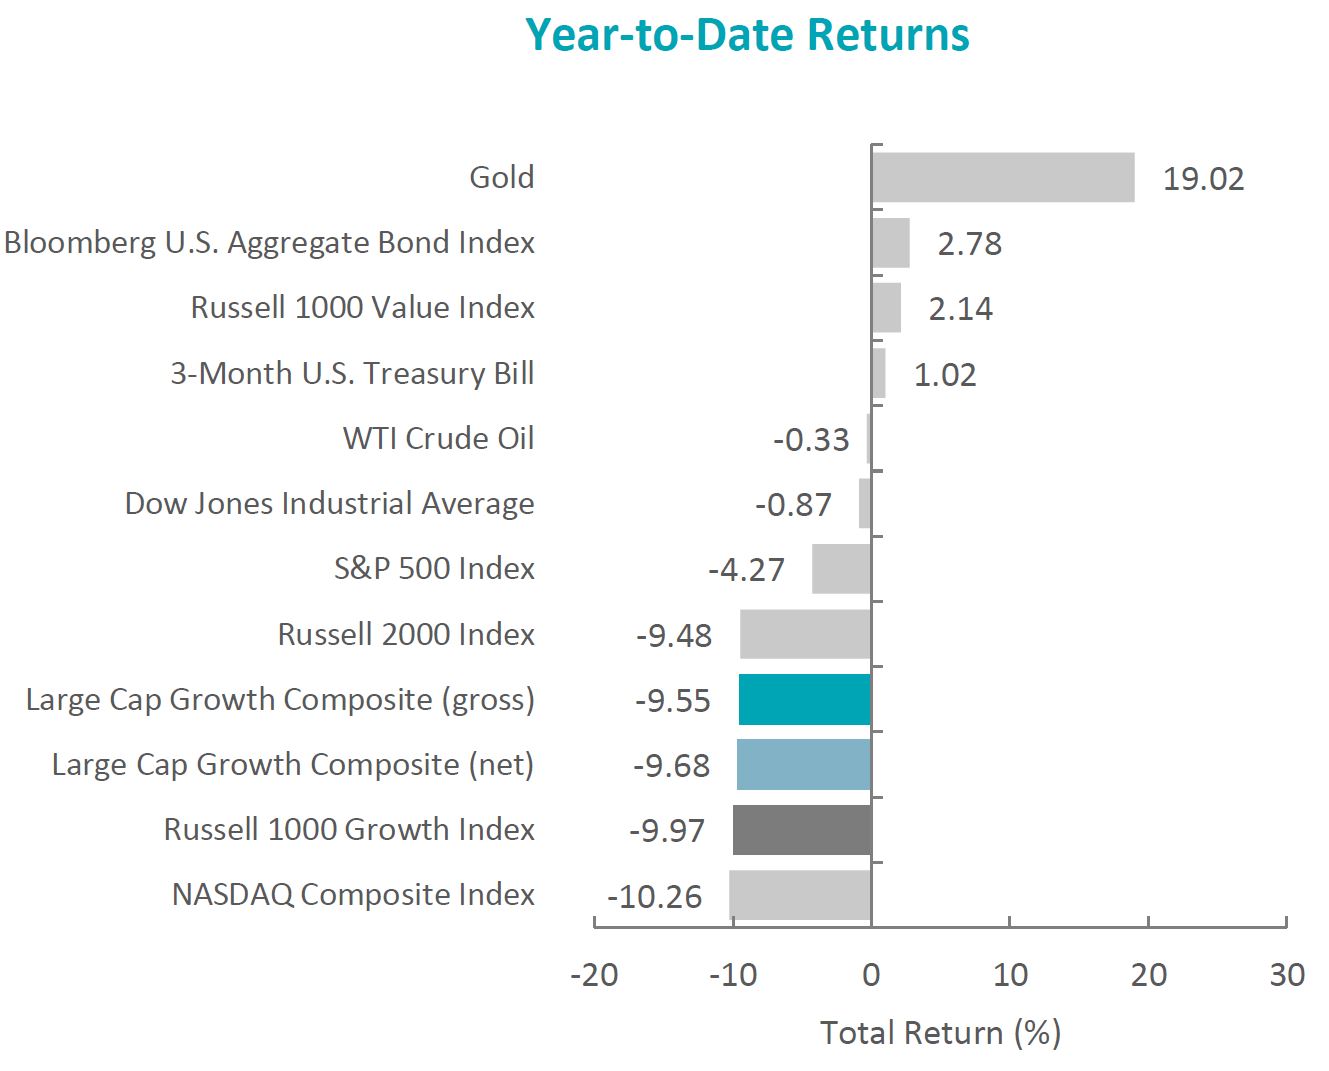
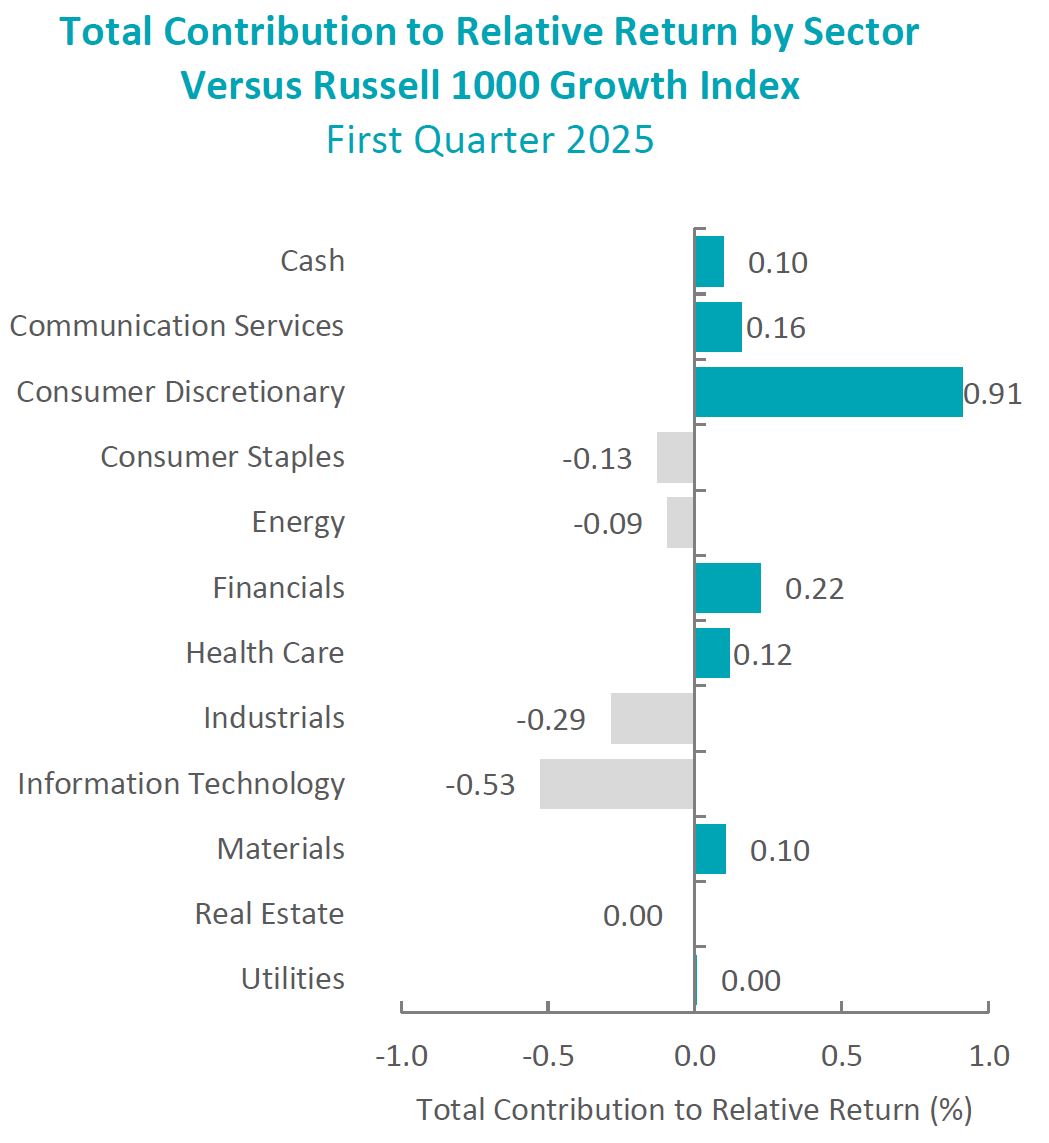
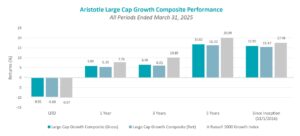
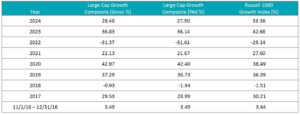 Sources: CAPS CompositeHubTM


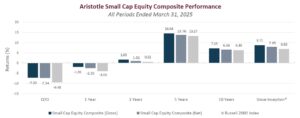
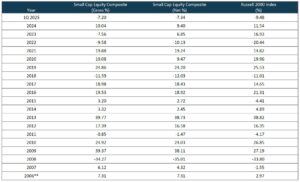 Sources: CAPS Composite Hub, Russell Investments