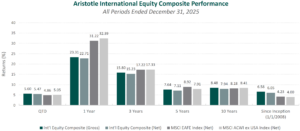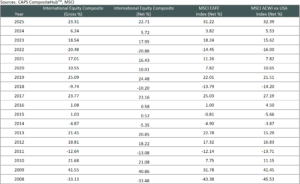
Markets Review

Sources: CAPS CompositeHubTM, Bloomberg
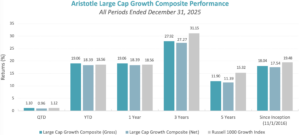
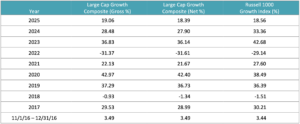
Past performance is not indicative of future results. Aristotle Value Equity Composite returns are presented gross and net of investment advisory fees and include the reinvestment of all income. Gross returns will be reduced by fees and other expenses that may be incurred in the management of the account. Net returns are presented net of model fees. Net returns are calculated by subtracting a model fee of 0.50% on an annual basis or 0.04167% on a monthly basis, which includes trading costs and the reinvestment of all income. Aristotle Capital Composite returns are preliminary pending final account reconciliation. Please see important disclosures at the end of this document.

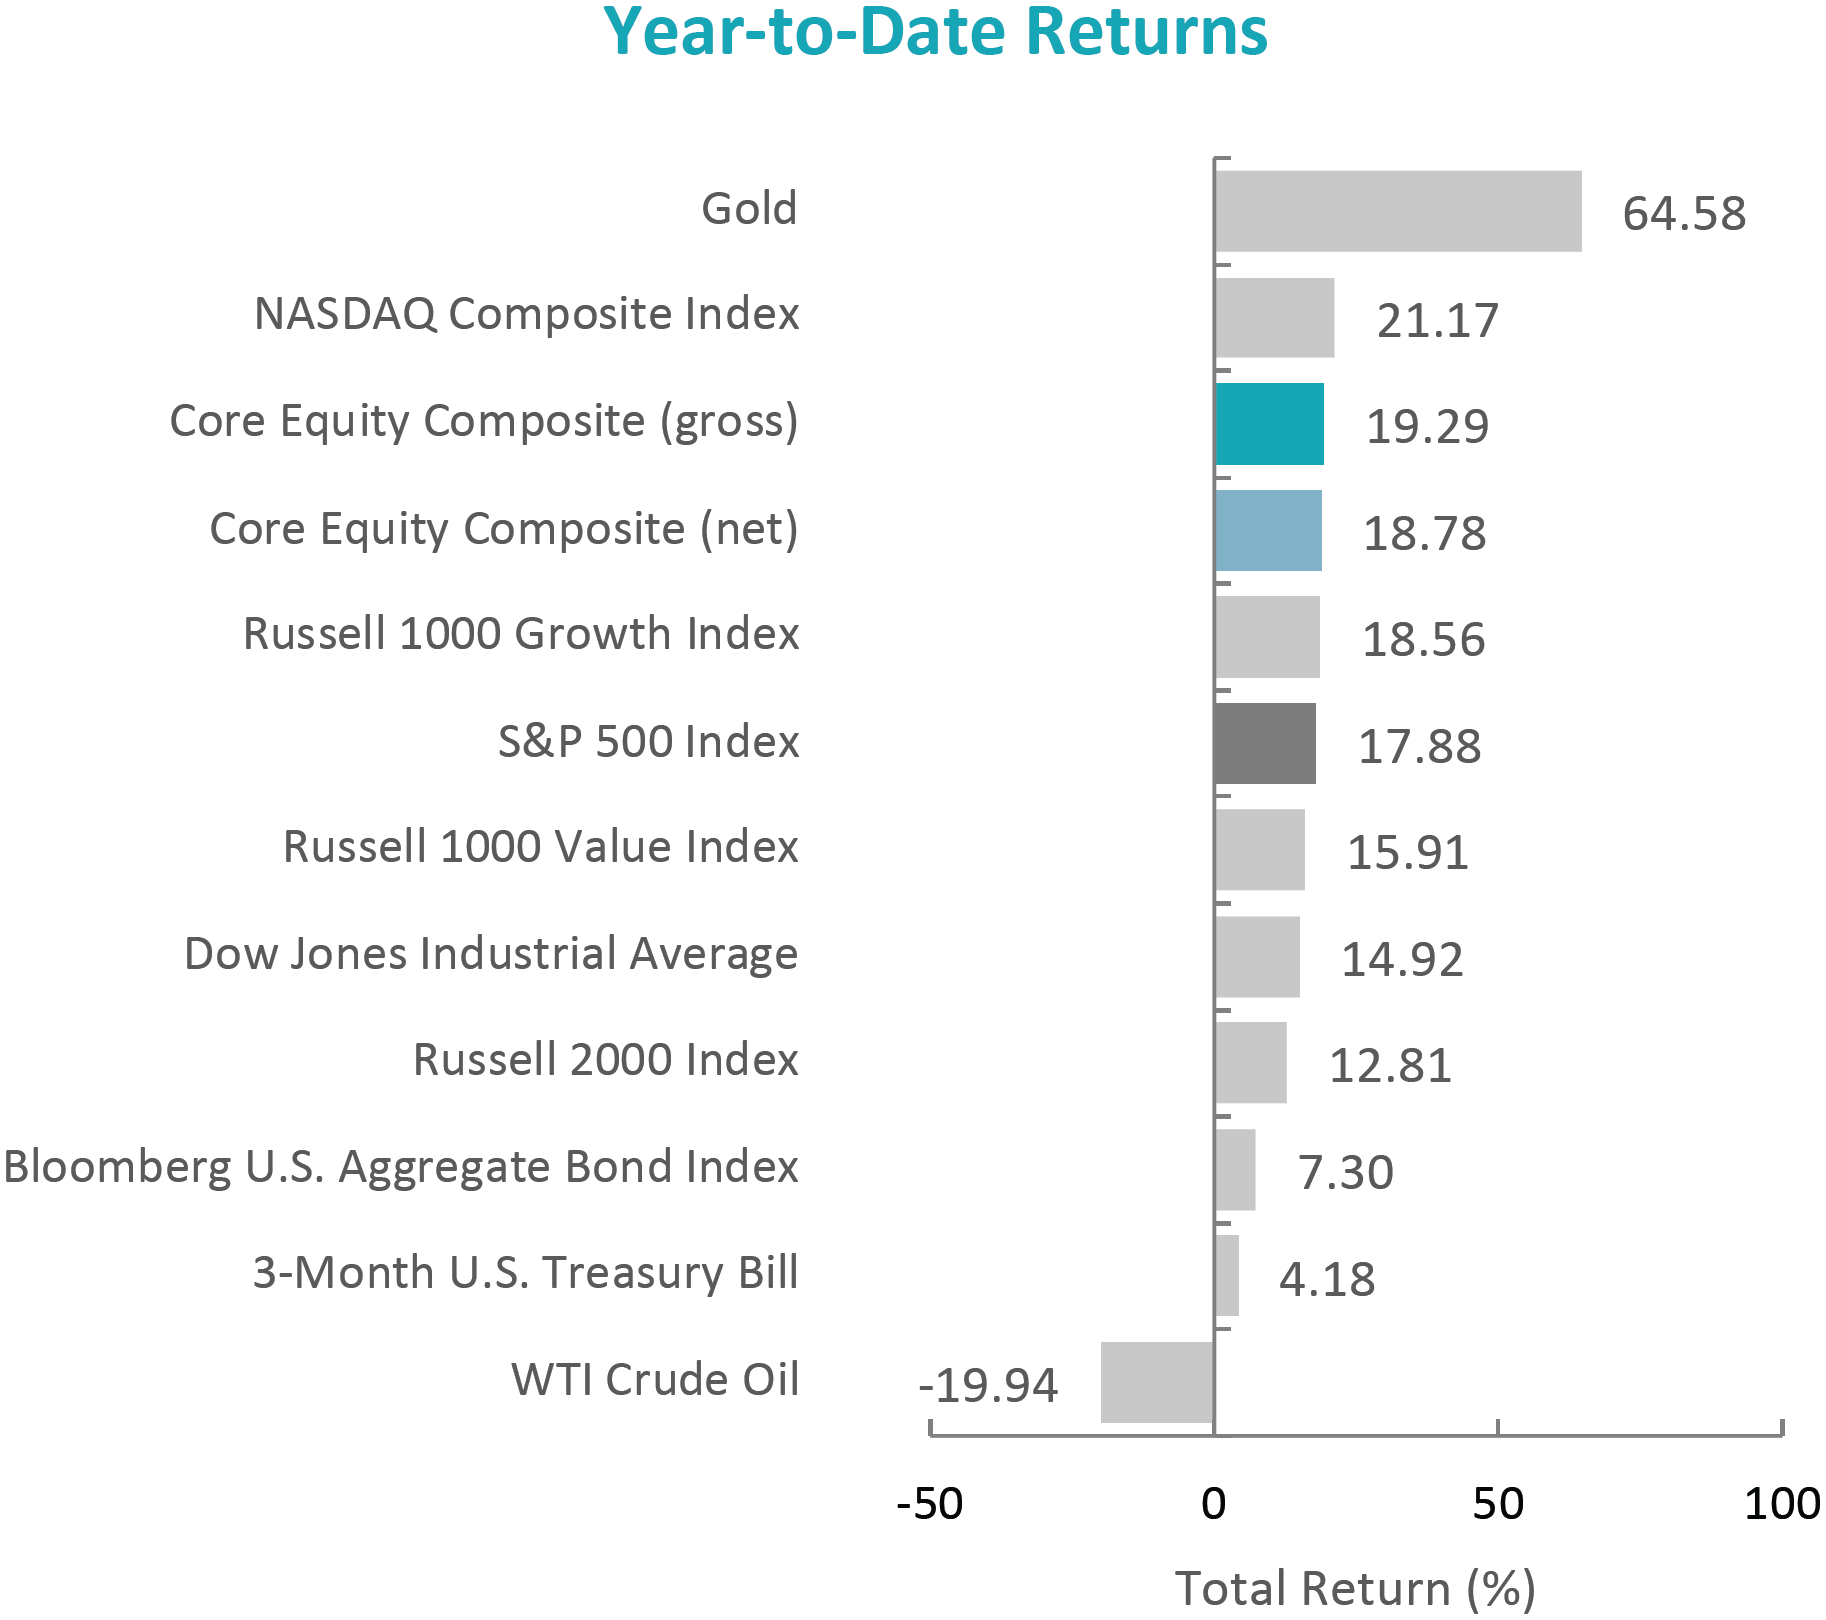
U.S. equity markets reached new all-time highs in the fourth quarter of 2025. The S&P 500 Index rose 2.66%, while fixed income markets also finished higher, with the Bloomberg U.S. Aggregate Bond Index up 1.10% for the quarter. Value stocks handily outperformed growth stocks—the Russell 1000 Value Index outperformed its Growth counterpart by 2.69%. Within the Russell 1000 Value Index, eight out of the eleven sectors posted positive returns. The best-performing sectors were Information Technology, Communication Services and Health Care, whereas Real Estate, Utilities and Consumer Discretionary were the weakest segments.

The U.S. economy continued to demonstrate resilience. Data released during the period showed that real GDP surged at a 4.3% annualized rate in the third quarter—the fastest quarterly growth in two years—driven primarily by robust consumer spending, with additional contributions from rising exports and increased government outlays. Despite this strength, consumer confidence deteriorated toward year-end; economists projected a moderation in spending, and concerns about the labor market persisted. The unemployment rate ticked up to 4.6% in November (a four-year high), though this level remains low by historical standards and is still consistent with an economy operating near full employment. Meanwhile, inflation moderated—the Consumer Price Index was up just 2.7% year-over-year in November, reaching its lowest level since July. Economists cautioned that recent unemployment and inflation figures were likely skewed by technical factors related to the 43-day government shutdown, which disrupted data reporting. This shutdown—the longest in U.S. history—forced approximately 1.4 million federal employees to go without pay and even led to temporary layoffs at some agencies before Congress passed a continuing resolution to reopen on November 12.
Given the mixed economic signals and uncertainty around the data, the Federal Reserve took a cautious stance. The Fed implemented two 0.25% interest rate cuts during the quarter, lowering the federal funds target range to 3.50%-3.75%. Fed Chair Powell emphasized a data-dependent approach, acknowledging risks to both sides of the Fed’s dual mandate. He noted the need to carefully assess incoming information, highlighting that policy would remain cautious and measured going into 2026.

Trade relations between the U.S. and China remained a key focus for markets. Early in the fourth quarter, tensions flared with tariff escalations and export controls. (China had dramatically expanded export controls on rare earth minerals, and the U.S. threatened 100% tariffs in retaliation.) Ultimately, President Trump and President Xi met at the Asia-Pacific Economic Cooperation (APEC) summit in South Korea and reached a one-year trade truce.

Corporate earnings remained robust. S&P 500 companies reported earnings growth of 13.6%, marking the fourth consecutive quarter of double-digit expansion. Of the 11 sectors within the S&P 500 Index, Information Technology recorded the strongest earnings growth of 29%. Artificial intelligence continued to be a major theme—more than 300 S&P 500 companies mentioned “AI” on their earnings calls during the fall. This enthusiasm helped propel mega-cap tech stocks higher and drive the market’s gains. However, as the quarter progressed, scrutiny increased around AI-related revenue circularity (companies buying AI services from each other to boost sales), the massive scale of AI-related capital spending, and the durability of longer-term returns on investment.

Annual Markets Review

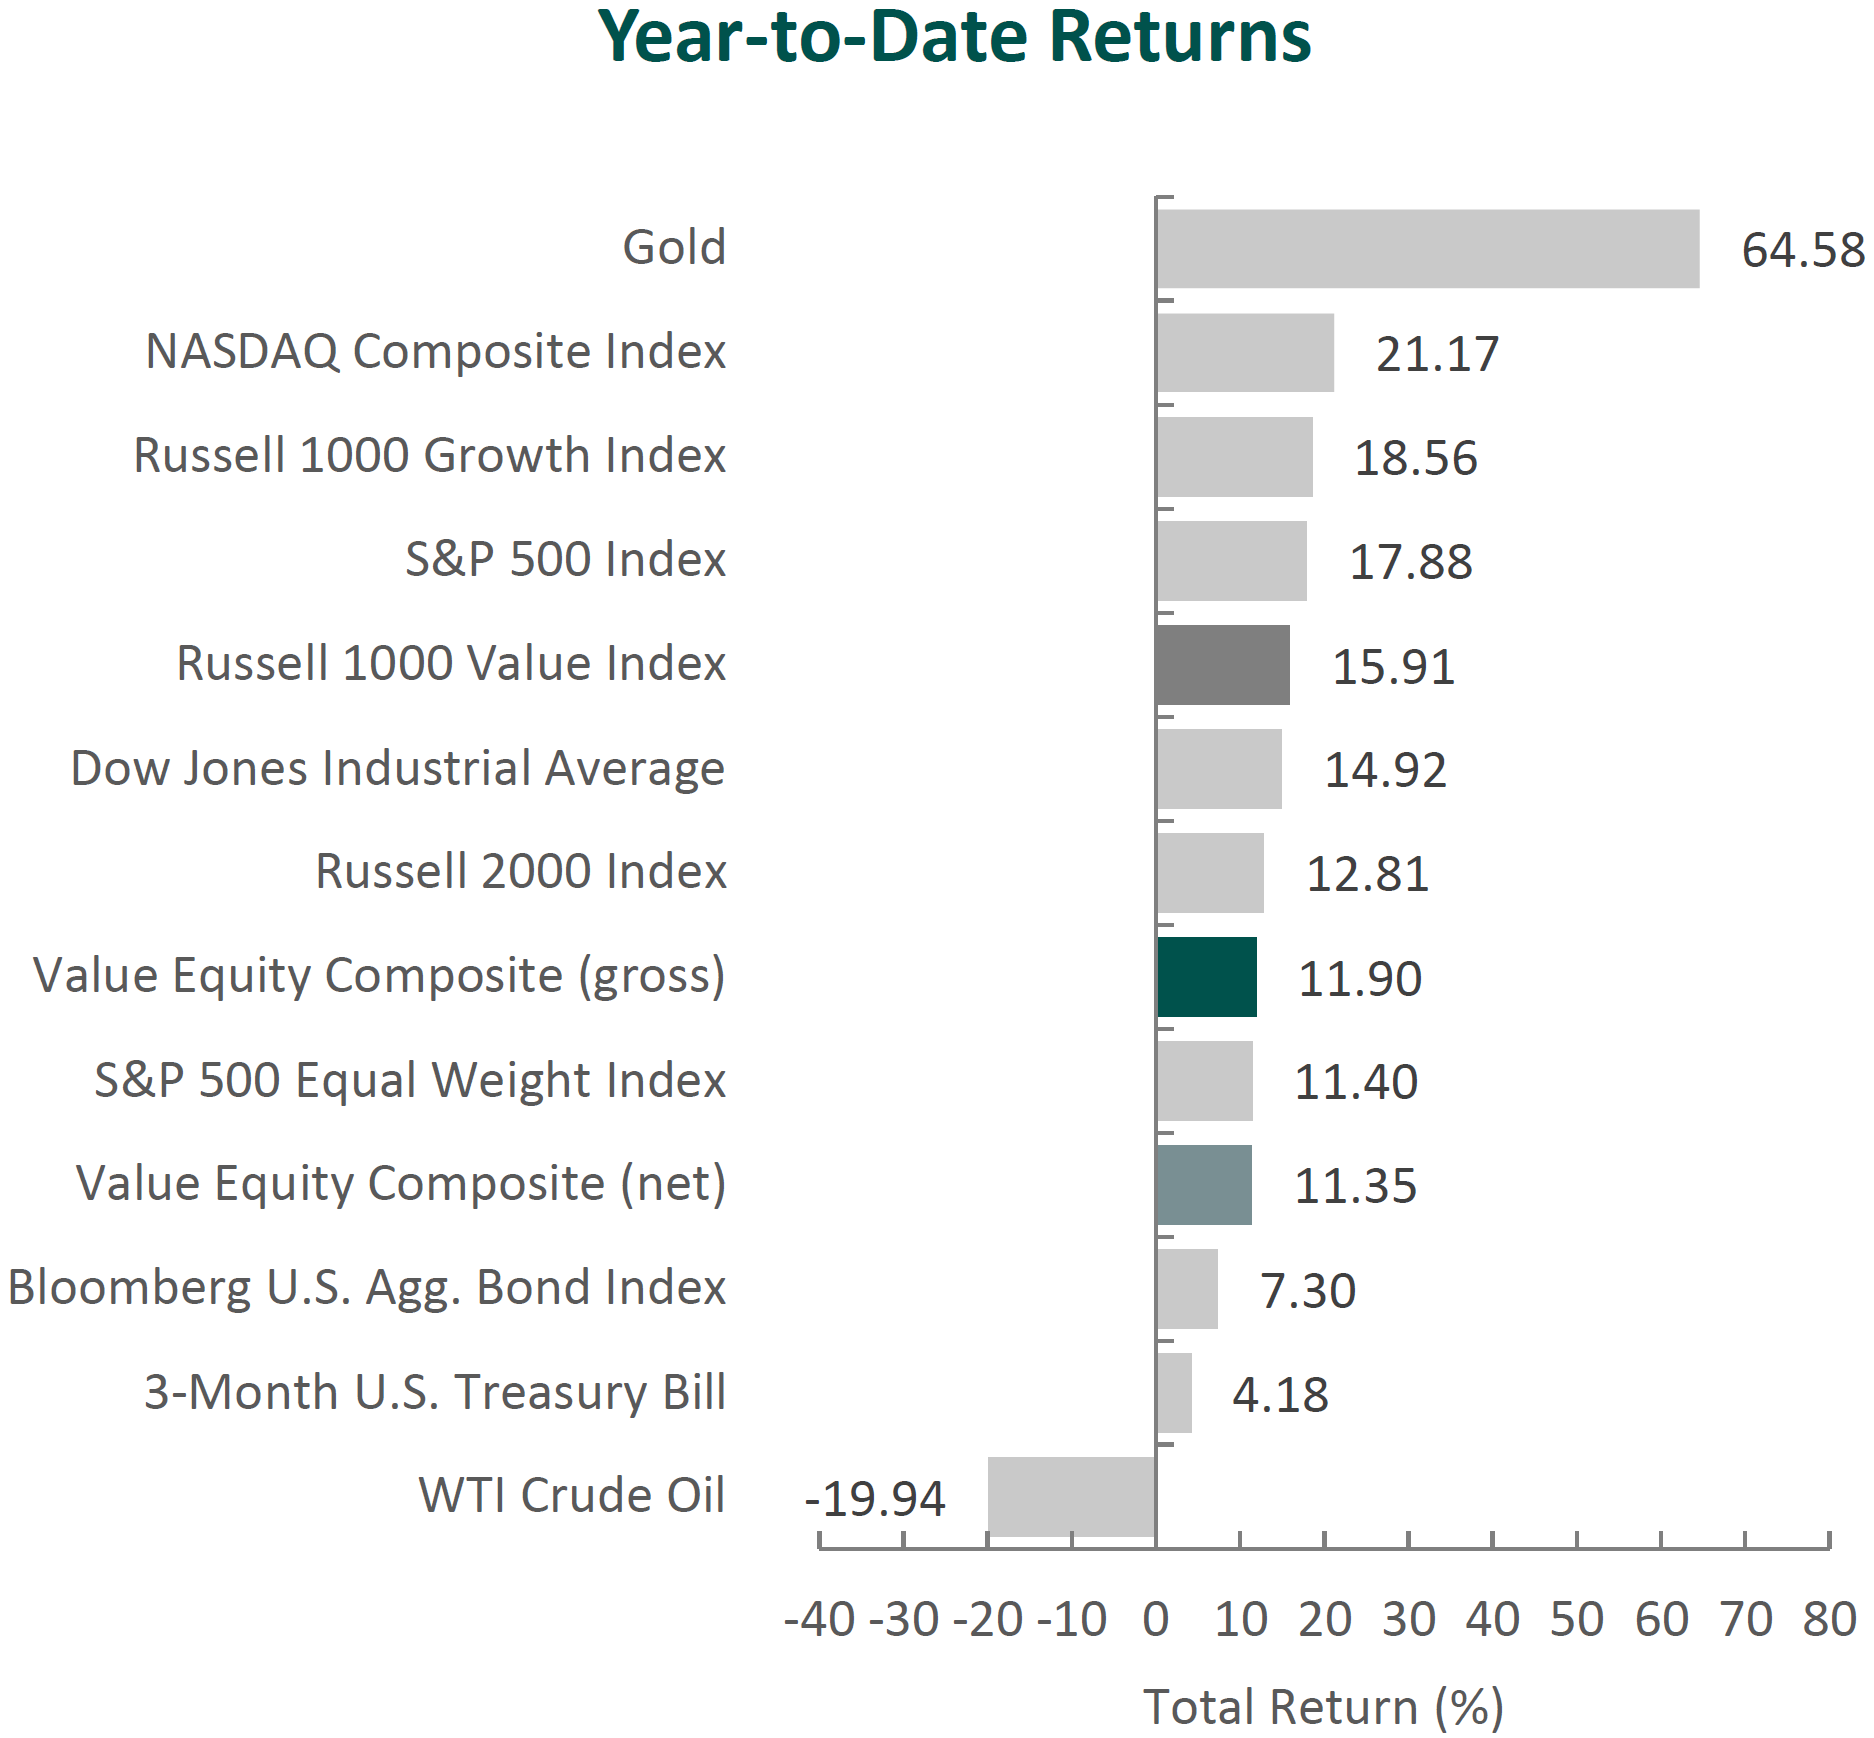
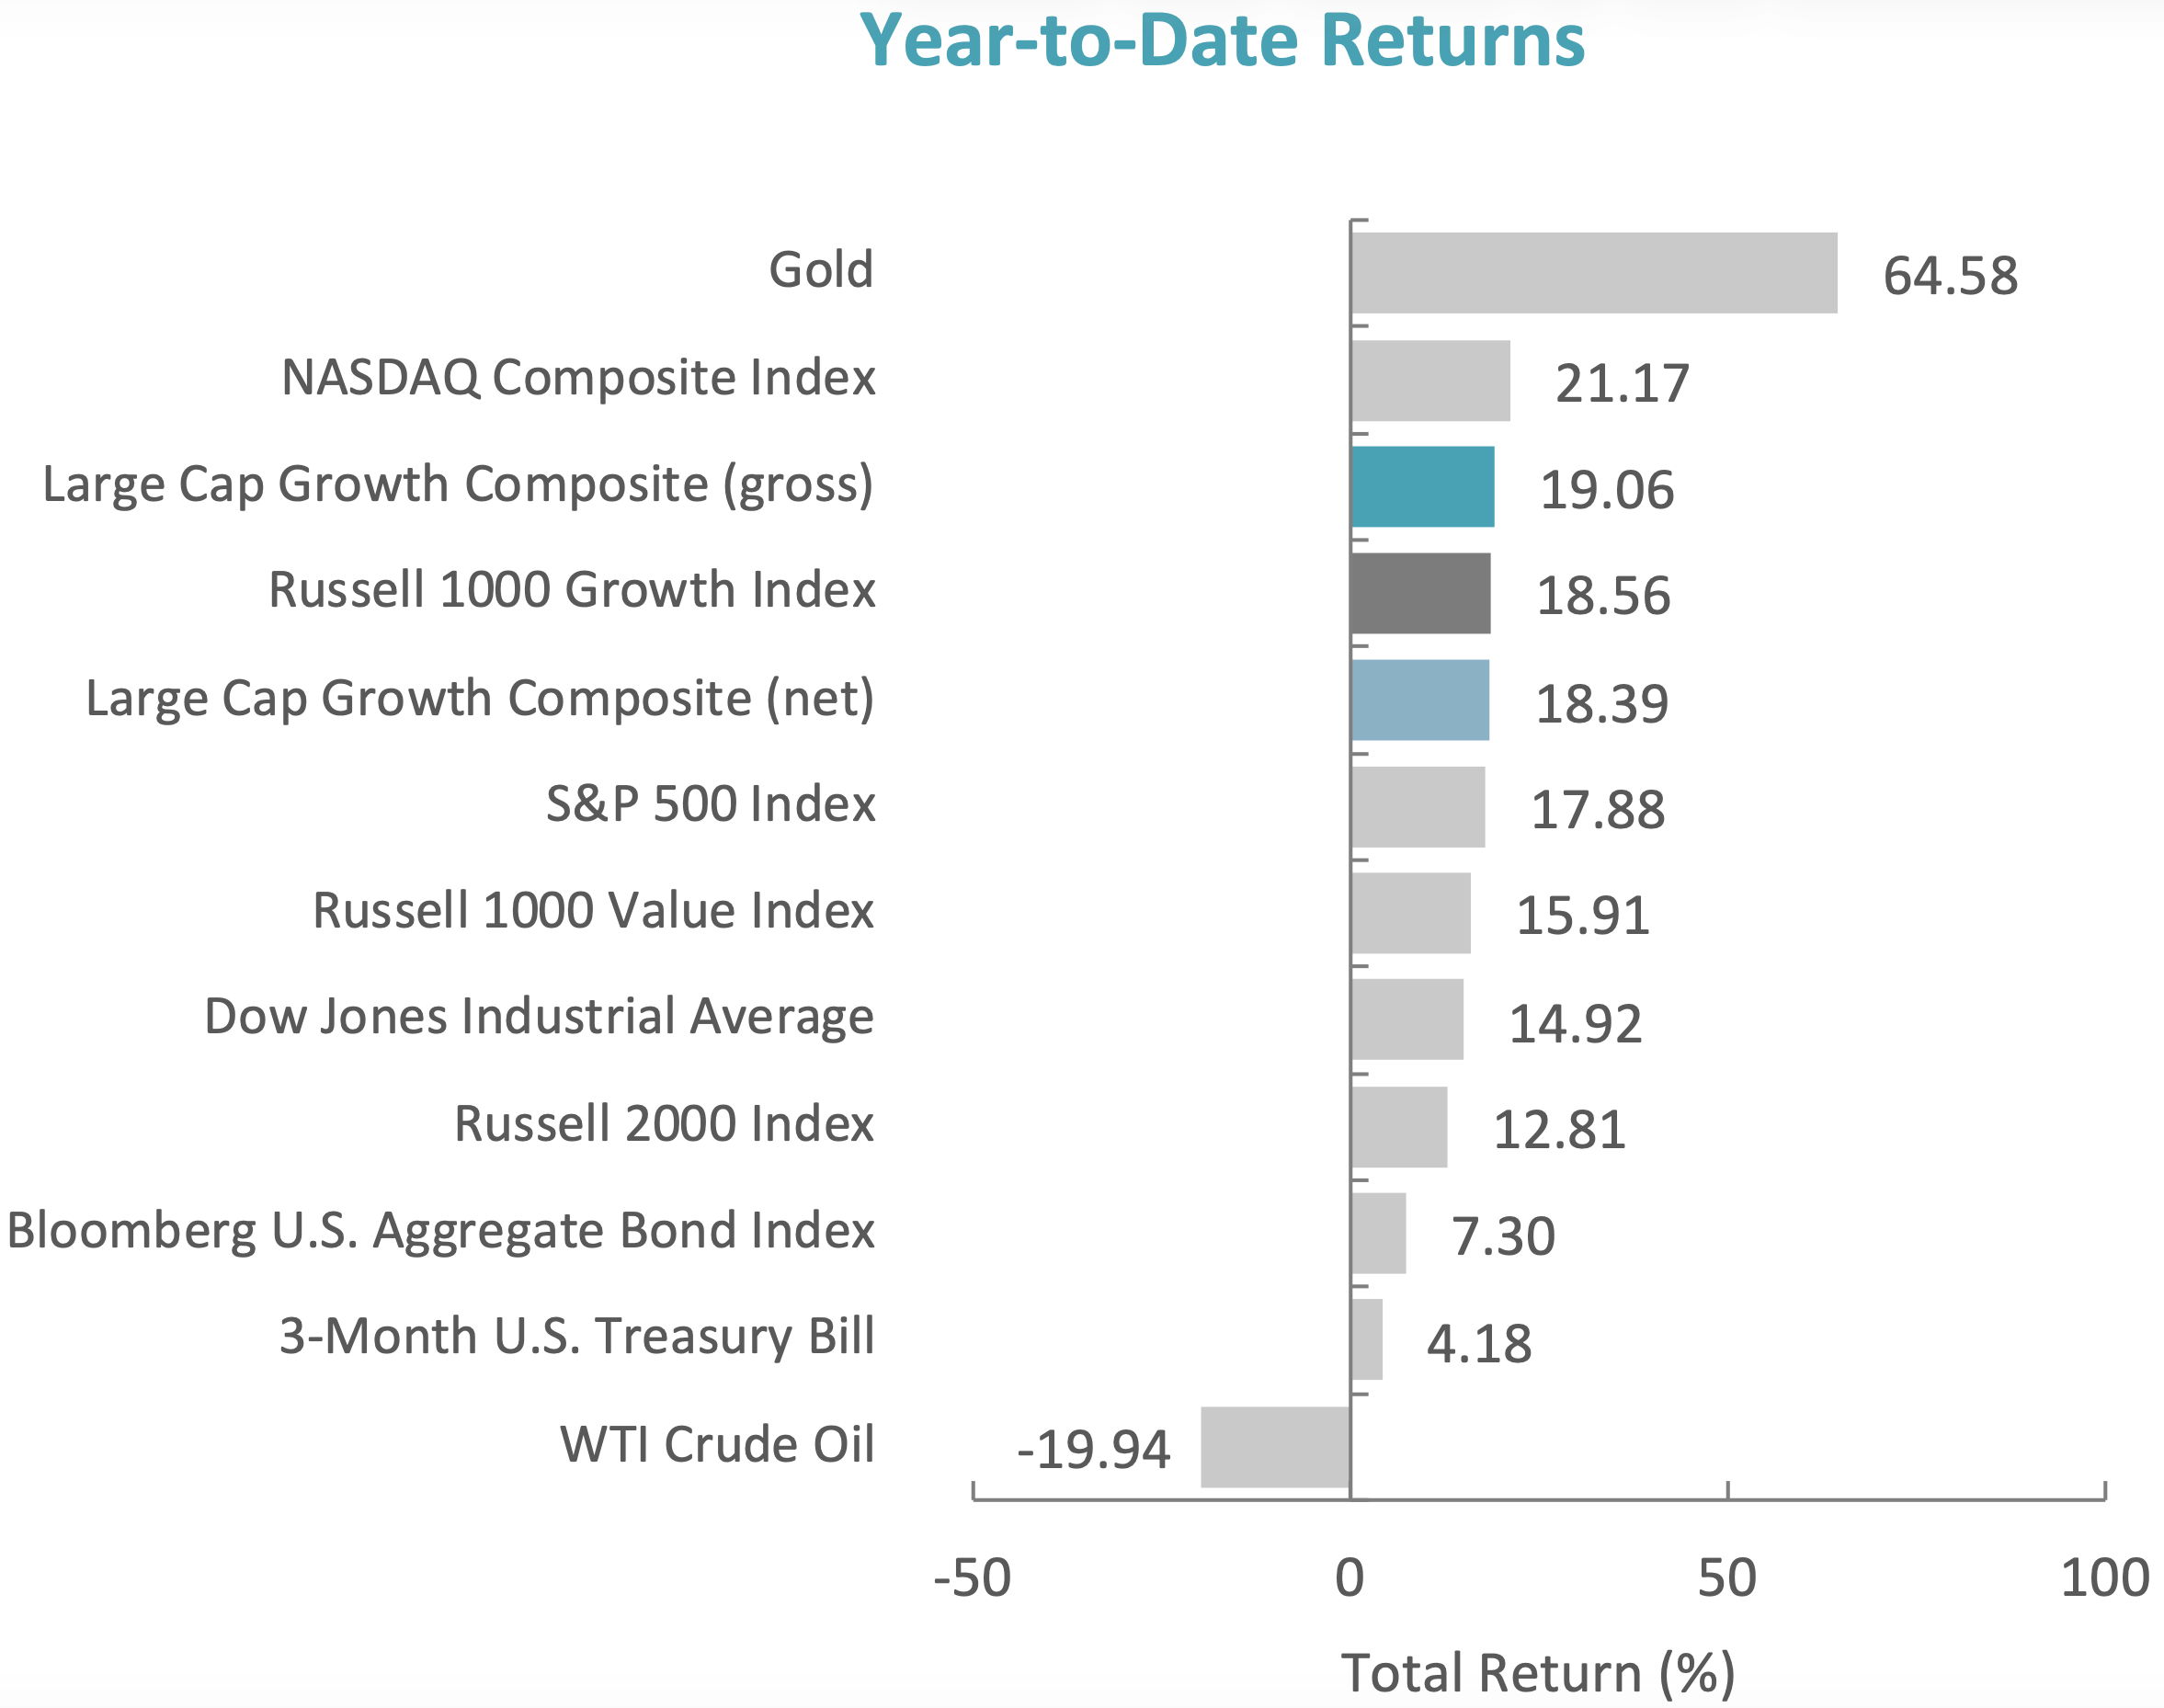
The U.S. equity markets extended their momentum in 2025, with the S&P 500 Index posting a full-year return of 17.88%. Similar to recent years, Communication Services and Information Technology were the strongest-performing sectors, rising 33.65% and 24.04%, respectively, as enthusiasm around AI remained a dominant market theme. Reflecting this leadership, the Russell 1000 Growth Index outperformed the Russell 1000 Value Index by 2.65% for the year.

Fixed income markets also delivered strong performance, with the Bloomberg U.S. Aggregate Bond Index advancing 7.30% over the period.

While trends such as AI continued to propel markets forward, 2025 was not without challenges, both new and existing. President Trump’s tariffs, ongoing geopolitical conflicts, mixed economic data and a government shutdown all contributed to heightened uncertainty.

Factors such as momentum and volatility outperformed quality, and while the economic and earnings backdrop was generally supportive, both the Fed and corporate management teams adopted a more cautious tone heading into 2026.

Given the risks and uncertainties surrounding macroeconomic conditions and market narratives, we believe it remains prudent to focus on individual businesses and their long-term fundamentals. By concentrating on what is analyzable, we believe our approach is well suited to navigating a range of market environments while remaining disciplined through full market cycles.

Performance and Attribution Summary

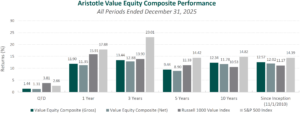
For the fourth quarter of 2025, Aristotle Capital’s Value Equity Composite posted a total return of 1.44% gross of fees (1.31% net of fees), underperforming the 3.81% return of the Russell 1000 Value Index and the 2.66% return of the S&P 500 Index. Please refer to the table for detailed performance.

Performance (%) 4Q251 Year3 Years5 Years10 Years
Value Equity Composite (gross)1.4411.9013.449.4412.34
Value Equity Composite (net)1.3111.3512.888.9011.78
Russell 1000 Value Index3.8115.9113.9011.3310.53
S&P 500 Index2.6617.8823.0114.4214.82
Past performance is not indicative of future results. Aristotle Value Equity Composite returns are presented gross and net of model fees and include the reinvestment of all income. Gross returns will be reduced by fees and other expenses that may be incurred in the management of the account. Net returns are presented net of model fees. Net returns are calculated by subtracting a model fee of .50% on an annual basis or .04167% on a monthly basis, which includes trading costs and the reinvestment of all income. Aristotle Capital Composite returns are preliminary pending final account reconciliation. Please see important disclosures at the end of this document.
Source: FactSet
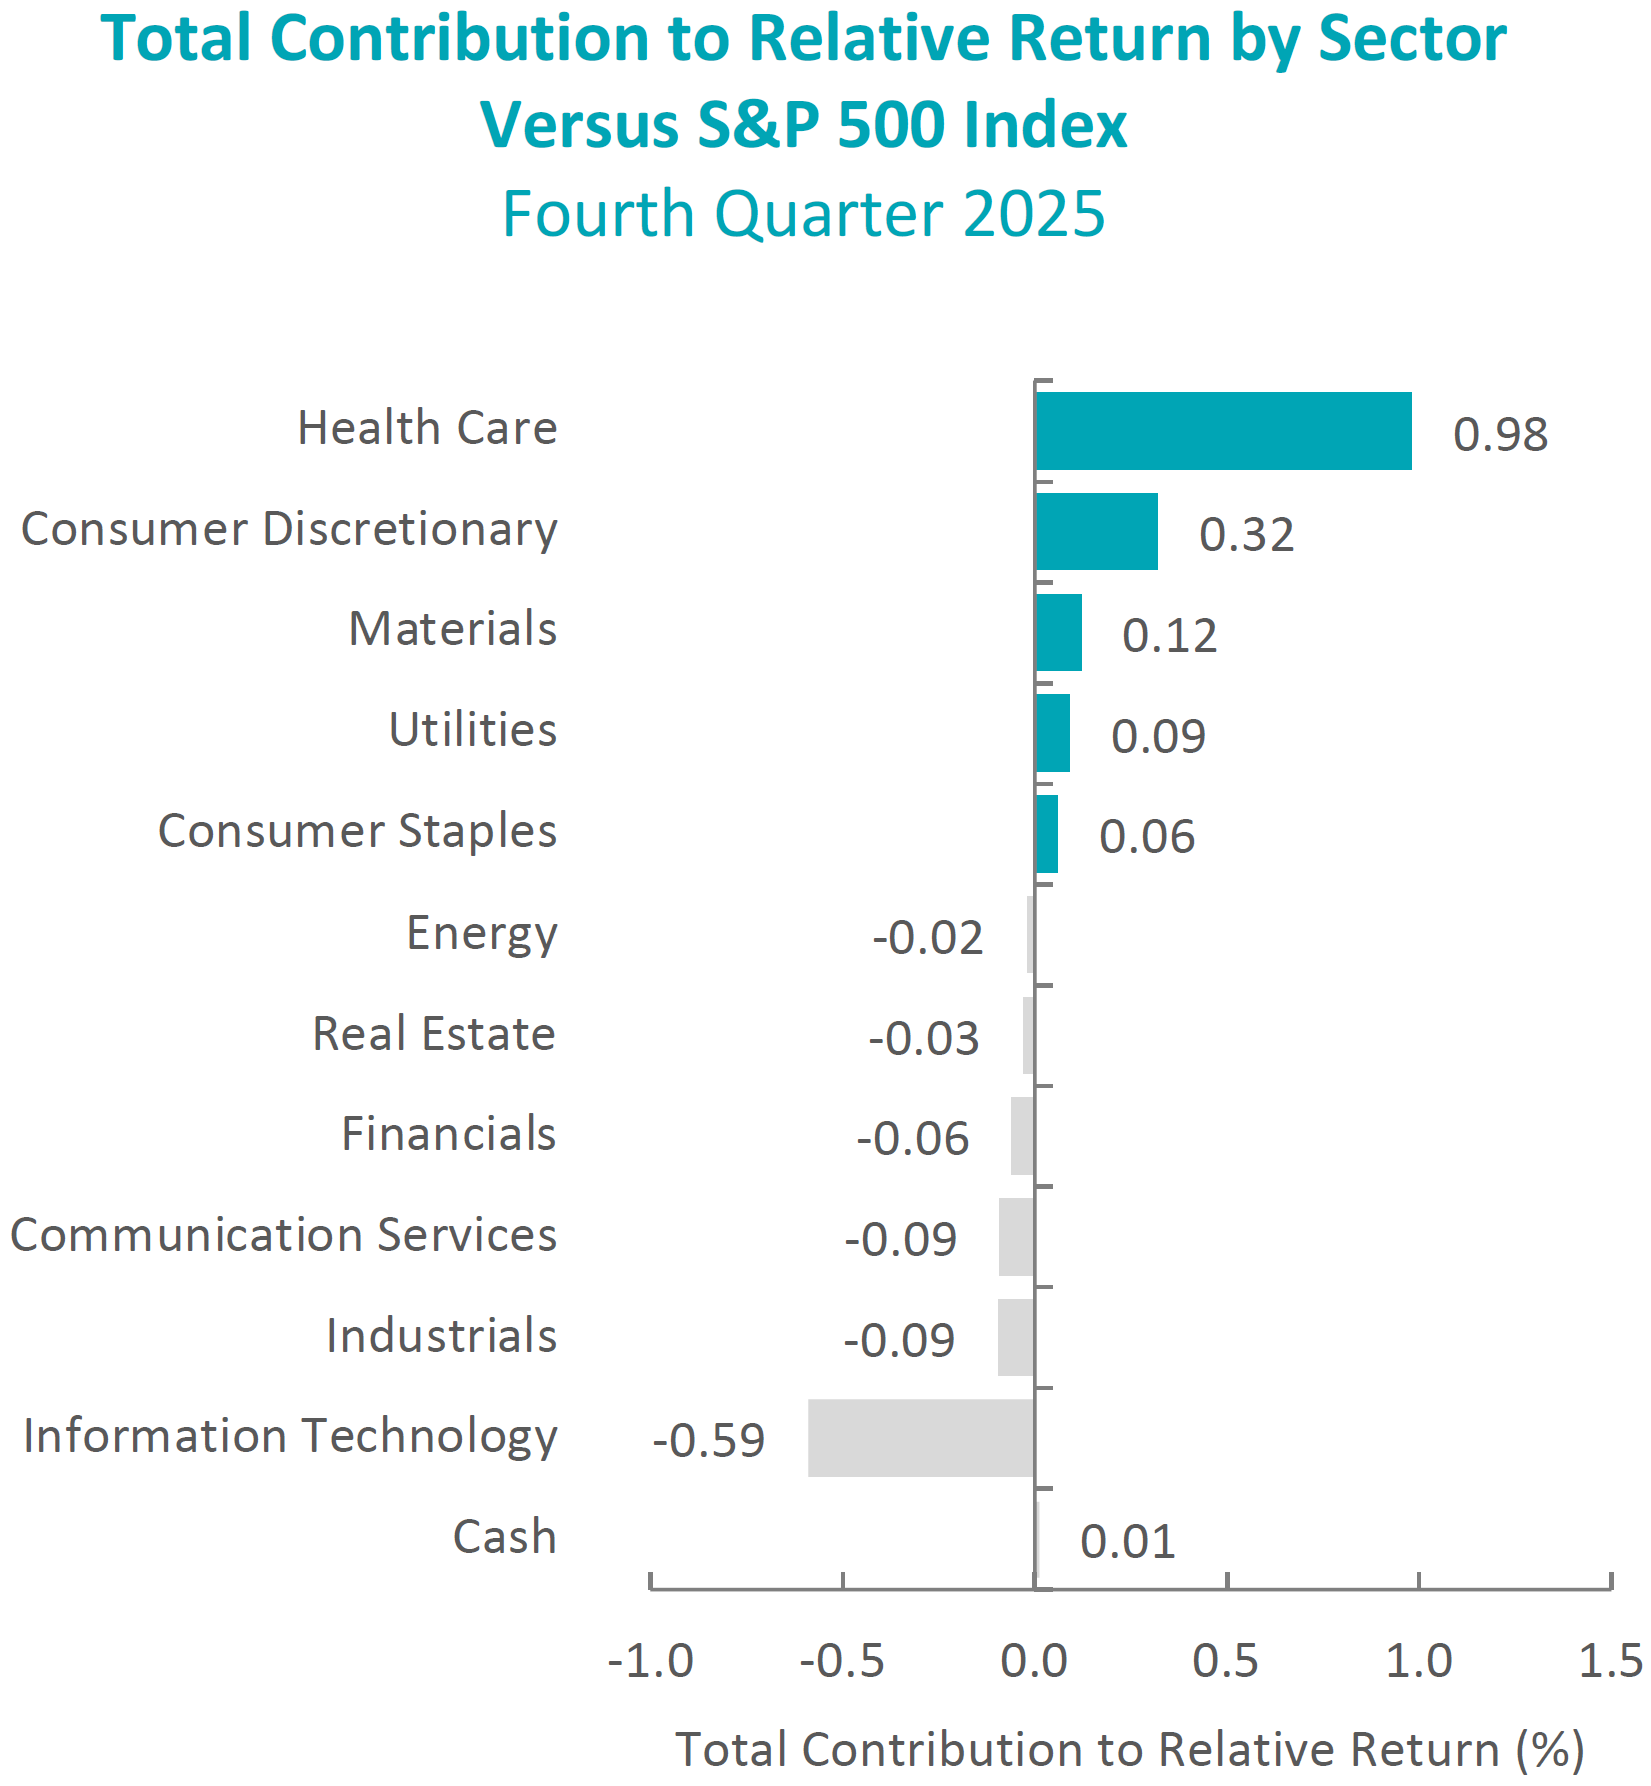
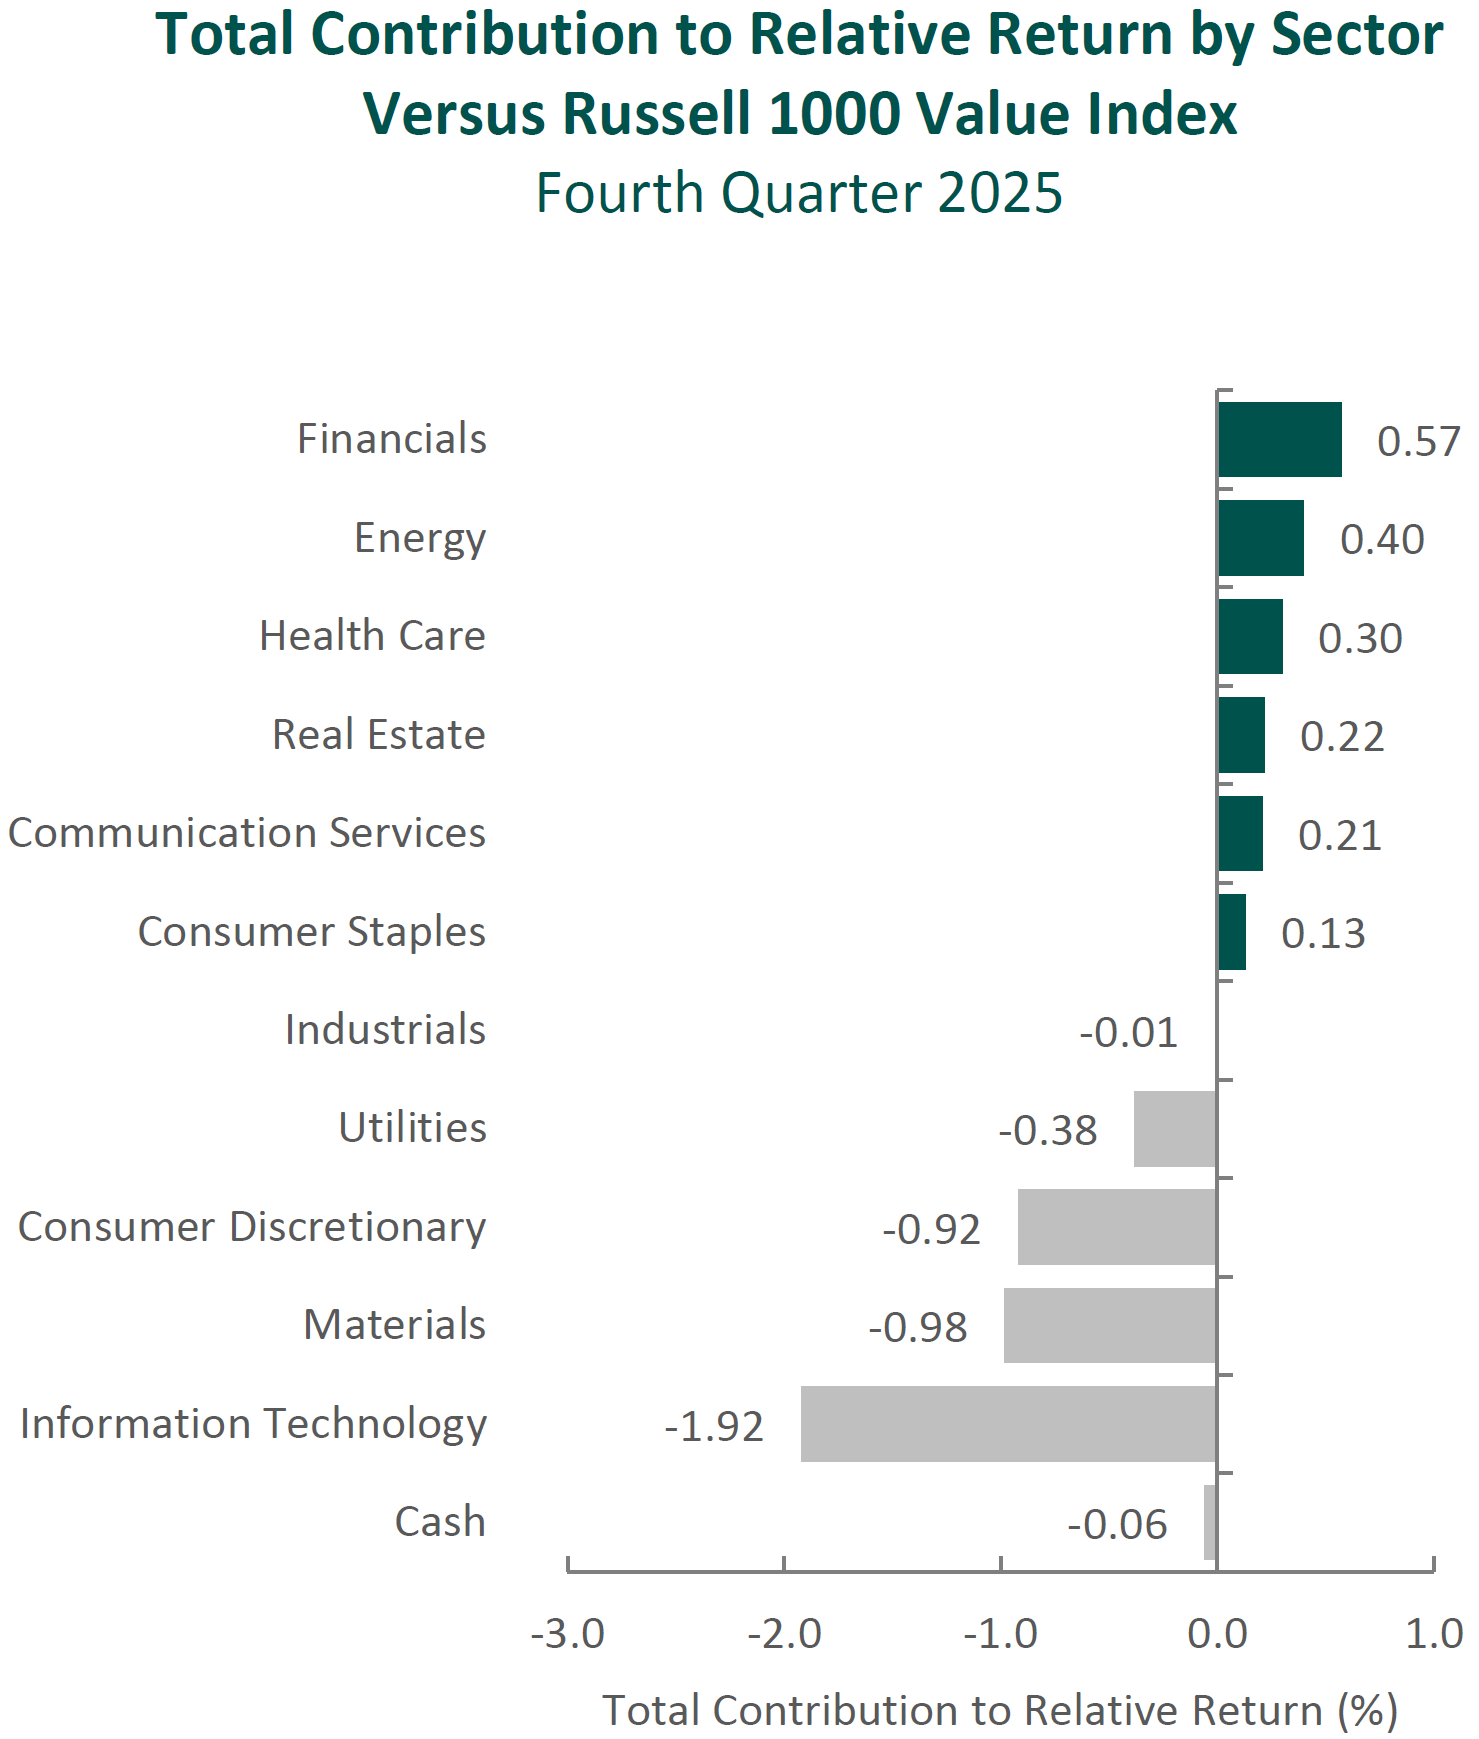
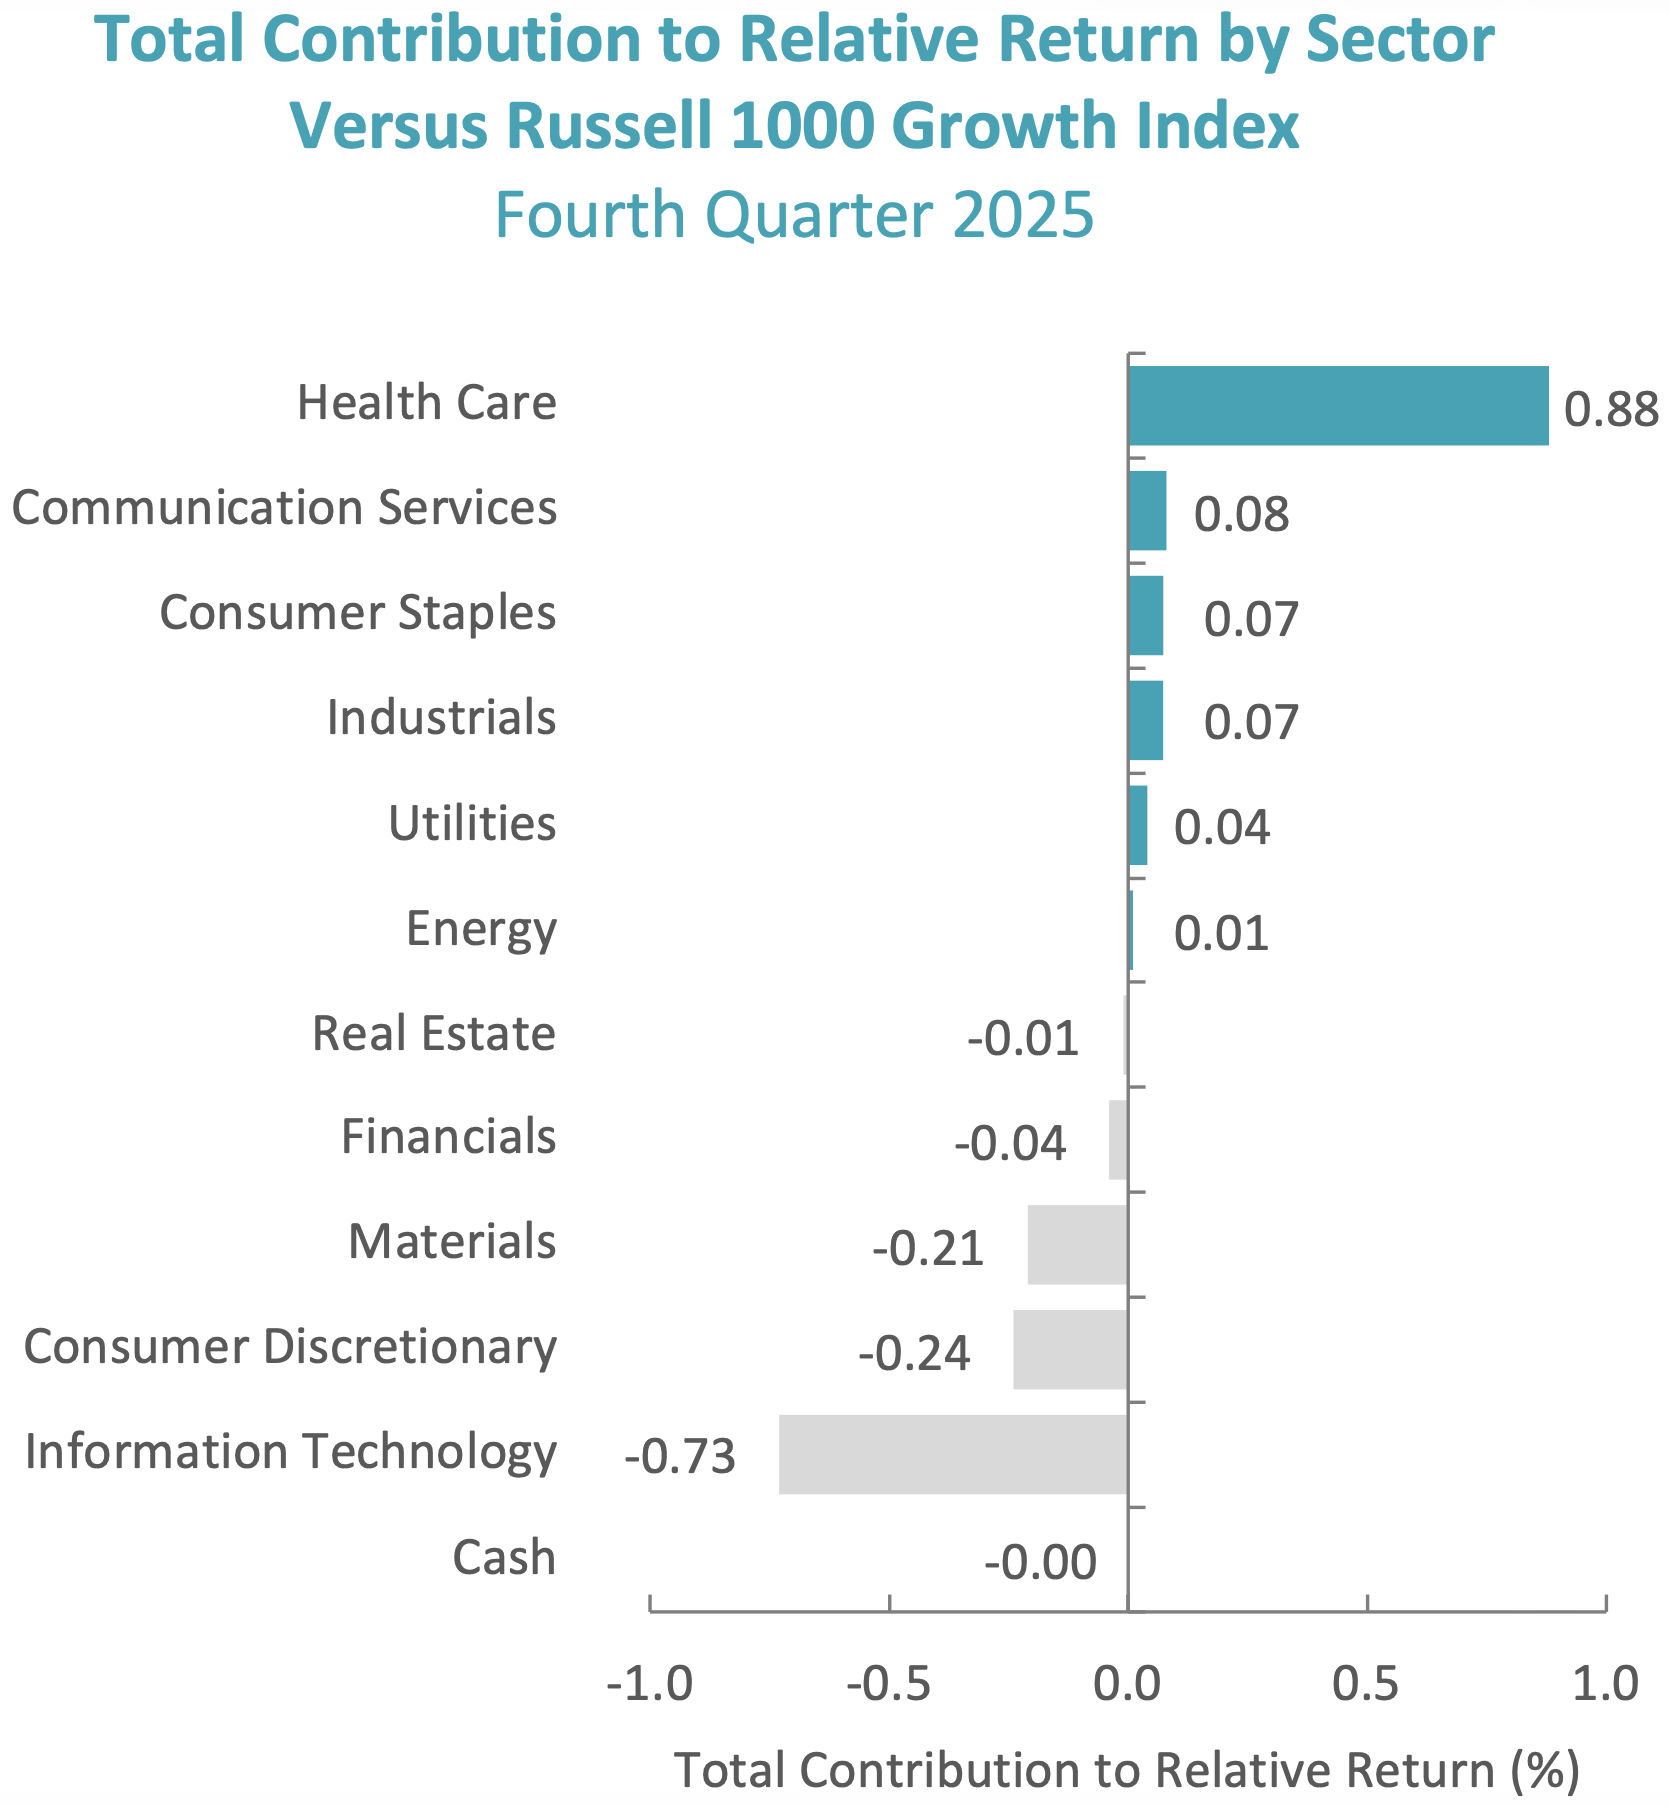
Past performance is not indicative of future results. Sector attribution shows how much of a portfolio’s overall return is directly attributable to stock selection and asset allocation decisions within the portfolio, highlighting which sectors contributed or detracted to the total return. Attribution includes the reinvestment of income. Attribution is presented gross of fees and does not include the deduction of all fees and expenses that a client or investor has paid or would have paid. Please refer to the gross and net composite returns included within to understand the overall impact of fees.

The portfolio’s underperformance relative to the Russell 1000 Value Index in the fourth quarter can be attributed to security selection, while allocation effects contributed. Security selection in Information Technology, Consumer Discretionary and Materials detracted the most from relative performance. Conversely, security selection in Financials, Health Care and Energy contributed. (Relative weights are the result of bottom-up security selection.)

Contributors and Detractors for 4Q 2025

Relative ContributorsRelative Detractors
Parker HannifinLennar
Capital One FinancialSony
AmgenUber
MerckMicrosoft
U.S. BancorpTeledyne Technologies

Sony, the global leader in video games, image sensors, music and movies, was a primary detractor for the period. Shares declined following the recognition of a one-time, non-cash charge of approximately ¥50 billion in the Game & Network Services segment related to an impairment and accounting correction of previously capitalized development costs. Importantly, this charge was not recurring and did not reflect a deterioration in underlying operating performance. Excluding this item, operating income would have increased approximately 23% year-over-year, supported by healthy gaming engagement, continued growth in network services and software sales, and strong results in the Music segment driven by streaming growth and recent theatrical releases. The company’s image sensor business also benefited from a favorable product mix and steady end-market demand. Looking ahead, we continue to see opportunity for Sony to capitalize on its unique position as both a content creator and platform owner. The company’s ability to integrate gaming, music, anime and film—and to leverage IP across its ecosystem—supports sustained engagement and recurring revenue. In addition, the recent spinoff of Sony’s Financial Services segment further sharpens management’s focus on its core content, technology and entertainment operations. We believe Sony’s industry leadership and continued focus on operational execution position the company well for long-term value creation.

Uber, a leading rideshare, delivery and shipping technology platform, was one of the largest detractors during the period. Trip volumes reached record levels, and gross bookings grew significantly year-over-year, yet the stock underperformed as investor focus shifted from growth to margin trajectory, regulatory risk and autonomous vehicle (AV) uncertainty. The primary near-term concern among market participants was management’s guidance around profitability. While results exceeded expectations on bookings and FREE cash flow, Uber signaled a deliberate moderation in margin expansion, as incremental profits are reinvested into affordability, cross-platform engagement and early AV initiatives. Regulatory concerns also resurfaced, particularly in Europe, where ongoing debates around driver classification and data protection continue to pose potential cost (and therefore margin) headwinds. At the same time, competitive anxiety around AVs intensified following Lyft’s expanded partnership with Waymo and continued investor focus on Tesla’s long-term robotaxi ambitions. Management acknowledged that autonomous initiatives will pressure near-term margins, as Uber invests to build supply and data infrastructure, even as utilization in early AV markets has been encouraging. Over the long term, however, our thesis remains intact. Uber’s global scale, deepening network effects, growing FREE cash flow and expanding cross-platform ecosystem position the company to compound value as profitability improves and new mobility technologies mature.

Parker Hannifin, the manufacturer of motion and control technologies, was the top contributor during the quarter. The company continues to benefit from strength in its aerospace business, where demand for original equipment and aftermarket services has driven organic growth and margin expansion. The ongoing integration of Meggitt, which Parker Hannifin acquired in 2022, has further expanded the company’s aerospace and defense capabilities while increasing exposure to higher-margin aftermarket revenue—a catalyst we previously identified. Alongside this progress, management has continued to strengthen the company’s balance sheet following a period of elevated acquisition activity, with net debt-to-EBITDA trending lower. In addition, Parker Hannifin’s broad portfolio of motion and control technologies positions the company to benefit from secular trends such as factory automation, electrification of industrial equipment, digitization, and increased complexity and modernization across commercial and defense aerospace platforms. The company continues to execute its Win Strategy, driving operational excellence, pricing discipline and strong cash flow generation. We believe these catalysts support a more resilient earnings profile and will allow Parker Hannifin to continue improving profitability and FREE cash flow generation over time.

Capital One Financial was a primary contributor during the quarter. Following the completion of its all-stock acquisition of Discover, the company reported strong results in its first full quarter post-transaction, including net interest margin expansion driven primarily by the addition of Discover’s credit card portfolio. The acquisition positions Capital One as one of the largest U.S. credit card issuers and adds ownership of the Discover payment network, which we believe has the potential to improve payment economics and enhance operating leverage over time. During the quarter, the company also announced increased capital returns through a new share buyback program and a higher quarterly dividend, reflecting confidence in its balance sheet and earnings power. In addition, resilient consumer spending, stable credit quality and a strengthening deposit base contributed to performance. We believe Capital One’s scale and integrated payments capabilities support a more resilient earnings profile and position the company to continue generating attractive returns over time.

Recent Portfolio Activity

BuysSells
NoneCommerce Bancshares
Constellation Brands
Sony Financial

During the quarter, we sold our positions in Commerce Bancshares, Constellation Brands and Sony Financial.

We first invested in Commerce Bancshares, the Kansas City-based bank, in the fourth quarter of 2019. We were attracted to the bank’s conservatively run franchise, disciplined approach to credit, well-diversified revenue mix with a meaningful contribution from fee-based businesses, and long-tenured management team that has historically operated with a “private company” mindset. At the time of purchase, we identified several catalysts, including continued loan growth—particularly in core Kansas markets—prudent expense management, sustained strong credit underwriting, and the accretive deployment of excess capital through dividends and share repurchases. Over our holding period, Commerce executed consistently against these objectives, demonstrating resilience through multiple operating environments while maintaining strong credit quality, disciplined cost control and steady capital returns, including a long history of dividend increases. As these catalysts played out, we chose to sell our position and redeployed the proceeds into what we view as a more attractive investment opportunity in Wells Fargo, which we purchased in the third quarter of 2025.

We first invested in Constellation Brands, the premium beer, wine and spirits company, in the fourth quarter of 2021. At the time, we believed the company was well positioned to benefit from its dominant share of the fast-growing Mexican imports segment of U.S. beer, supported by iconic brands such as Modelo, Corona and Pacifico, hard-to-replicate production assets in Mexico, and a management team with a strong track record of building brands and marketing imported brands to mainstream U.S. consumers and expanding  distribution. Over our holding period, Constellation continued to benefit from the growing popularity of Mexican beer in the U.S and its core beer segment remained a clear source of strength.  However, the timing and magnitude of several key catalysts evolved. Expansion of shelf space and overall distribution progressed more slowly than expected, while improvement in the Wine & Spirits segment proved more challenging, pushing meaningful margin recovery further into the future. As a result, while the long-term strategic rationale for the business remains intact, we determined that Constellation was the most appropriate candidate for sale to fund a new investment in the first quarter of 2026, to be discussed in greater detail next quarter.

We received shares of Sony Financial following its spinoff from our long-term holding Sony in October 2025. Sony Financial is a Japan-based financial services company with operations in life insurance, banking and digital payments. While we view Sony Financial as an attractive, well-managed business, its operations are focused primarily on the Japanese market. Given this focus, we elected to sell the shares received in the spinoff.

Conclusion

Markets and economic conditions will continue to evolve, often in ways that are difficult to anticipate. While we remain attentive to these developments, our work is ultimately centered on understanding individual businesses—how they compete, how they allocate capital and how their economics change over time. We recognize that progress in business fundamentals and investment outcomes do not always align over shorter periods. Thus, we approach our investment process with patience and a willingness to reassess our views as circumstances change. Rather than react impulsively to every macro headline or try to time short-term market moves, we focus on what is analyzable and enduring: the long-term fundamentals of the companies we own. We believe this careful, fundamental approach remains the most reliable way to add value for our clients over the long run, across a wide range of market environments.

Disclosures

The opinions expressed herein are those of Aristotle Capital Management, LLC (Aristotle Capital) and are subject to change without notice. Past performance is not a guarantee or indicator of future results. This material is not financial advice or an offer to purchase or sell any product. You should not assume that any of the securities transactions, sectors or holdings discussed in this report were or will be profitable, or that recommendations Aristotle Capital makes in the future will be profitable or equal the performance of the securities listed in this report. The portfolio characteristics shown relate to the Aristotle Value Equity strategy. Not every client’s account will have these characteristics. Aristotle Capital reserves the right to modify its current investment strategies and techniques based on changing market dynamics or client needs. There is no assurance that any securities discussed herein will remain in an account’s portfolio at the time you receive this report or that securities sold have not been repurchased. The securities discussed may not represent an account’s entire portfolio and, in the aggregate, may represent only a small percentage of an account’s portfolio holdings. The performance attribution presented is of a representative account from Aristotle Capital’s Value Equity Composite. The representative account is a discretionary client account which was chosen to most closely reflect the investment style of the strategy. The criteria used for representative account selection is based on the account’s period of time under management and its similarity of holdings in relation to the strategy. Recommendations made in the last 12 months are available upon request.

Returns are presented gross and net of model fees and include the reinvestment of all income. Gross returns will be reduced by fees and other expenses that may be incurred in the management of the account. Net returns are presented net of model fees. Net returns are calculated by subtracting a model fee of .50% on an annual basis or .04167% on a monthly basis, which includes trading costs and the reinvestment of all income.

All investments carry a certain degree of risk, including the possible loss of principal. Investments are also subject to political, market, currency and regulatory risks or economic developments. International investments involve special risks that may in particular cause a loss in principal, including currency fluctuation, lower liquidity, different accounting methods and economic and political systems, and higher transaction costs. These risks typically are greater in emerging markets. While Large-capitalization companies may have more stable prices than smaller, less established companies, they are still subject to equity securities risk. In addition, large-capitalization equity security prices may not rise as much as prices of equity securities of small-capitalization companies. Securities of small- and medium-sized companies tend to have a shorter history of operations and be more volatile and less liquid. Value stocks can perform differently from the market as a whole and other types of stocks. The material is provided for informational and/or educational purposes only and is not intended to be and should not be construed as investment, legal or tax advice and/or a legal opinion. Investors should consult their financial and tax adviser before making investments. The opinions referenced are as of the date of publication, may be modified due to changes in the market or economic conditions, and may not necessarily come to pass. Information and data presented has been developed internally and/or obtained from sources believed to be reliable. Aristotle Capital does not guarantee the accuracy, adequacy or completeness of such information.

Aristotle Capital Management, LLC is an independent registered investment adviser under the Advisers Act of 1940, as amended. Registration does not imply a certain level of skill or training. More information about Aristotle Capital, including our investment strategies, fees and objectives, can be found in our ADV Part 2, which is available upon request. ACM-2601-23

Performance Disclosures


Sources: CAPS CompositeHubTM, Russell Investments, Standard & Poor’s

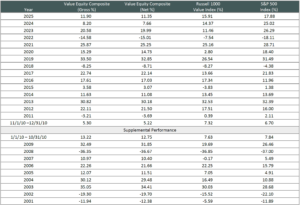
Past performance is not indicative of future results. The information provided should not be considered financial advice or a recommendation to purchase or sell any particular security or product. Performance results for periods greater than one year have been annualized. The Aristotle Value Equity strategy has an inception date of November 1, 2010; however, the strategy initially began at Mr. Gleicher’s predecessor firm in October 1997. A supplemental performance track record from January 1, 2001 through October 31, 2010 is provided above. The returns are based on two separate accounts and performance results are based on custodian data. During this time, Mr. Gleicher had primary responsibility for managing the two accounts, one account starting in November 2000 and the other in December 2000.

Composite and supplemental returns are presented gross and net of model fees and include the reinvestment of all income. Gross returns will be reduced by fees and other expenses that may be incurred in the management of the account. Net returns are presented net of model fees. Net returns are calculated by subtracting a model fee of .50% on an annual basis or .04167% on a monthly basis, which includes trading costs and the reinvestment of all income.

Index Disclosures

The Russell 1000® Value Index measures the performance of the large cap value segment of the U.S. equity universe. It includes those Russell 1000 Index companies with lower price-to-book ratios and lower expected growth values. The S&P 500® Index is the Standard & Poor’s Composite Index of 500 stocks and is a widely recognized, unmanaged index of common stock prices. The S&P 500 Equal Weight Index is designed to be the size-neutral version of the S&P 500. It includes the same constituents as the cap-weighted S&P 500, but each company in the S&P 500 Equal Weight Index is allocated the same weight at each quarterly rebalance. The Russell 1000® Growth Index measures the performance of the large cap growth segment of the U.S. equity universe. It includes those Russell 1000 companies with higher price-to-book ratios and higher forecasted growth values. The Russell 2000® Index measures the performance of the small cap segment of the U.S. equity universe. The Russell 2000 Index is a subset of the Russell 3000® Index representing approximately 10% of the total market capitalization of that index. It includes approximately 2,000 of the smallest securities based on a combination of their market cap and current index membership. The Dow Jones Industrial Average® is a price-weighted measure of 30 U.S. blue-chip companies. The Index covers all industries except transportation and utilities. The NASDAQ Composite Index measures all NASDAQ domestic and international based common type stocks listed on The NASDAQ Stock Market. The NASDAQ Composite includes over 3,000 companies, more than most other stock market indexes. The Bloomberg U.S. Aggregate Bond Index is an unmanaged index of domestic investment grade bonds, including corporate, government and mortgage-backed securities. The WTI Crude Oil Index is a major trading classification of sweet light crude oil that serves as a major benchmark price for oil consumed in the United States. The 3-Month U.S. Treasury Bill is a short-term debt obligation backed by the U.S. Treasury Department with a maturity of three months. The Consumer Price Index is a measure of the average change over time in the prices paid by urban consumers for a market basket of consumer goods and services. The volatility (beta) of the Composite may be greater or less than its respective benchmarks. It is not possible to invest directly in these indices.


One of our Portfolio Managers has a beloved brother and family. The PM tries to spend quality time with them on every occasion. Birthdays are a good time to hang out and celebrate. Recently, on the brother’s birthday, the family was all together, early one Saturday.

What shall we do today, to make it special?” asked our PM.

The brother replied … “Of course, we need to begin by going to IHOP for breakfast. You get free pancakes on your birthday!

Um, pancakes, OK for a start. Then what?

You can then come with me to that car dealer I told you of, the one that gives away free pens for each test drive.

Oh, you’re buying a new car? Great day for that!

To read the full article, please use the link below.

As we reflect on our journey and the progress made since the inception of our Council, we are proud of the strides we have made to expand our Diversity, Equity and Inclusion efforts. In 2024, we emphasized this expansion by strengthening our partnership with Human Resources and together adding depth to our employee programs and community engagement. We believe embracing diverse experiences and perspectives enhances decision-making and ultimately leads to better outcomes for our clients, employees and communities.

Robotics marks a foundational shift in how industries perform physical work, blending mechanical systems with intelligent software to automate tasks once reserved for humans. As automation scales from factory floors to hospitals, farms, highways and defense systems, demand is accelerating in response to long-term shifts in labor availability, sustainability priorities and technological capability. The rapid evolution of robotics is no longer theoretical—it is now an investable reality. We estimate that the total addressable market (TAM) for robotics in 2025 was $107 billion and project it to grow to $711 billion in 2035, implying a compound annual growth rate (CAGR) of 21% (see Appendix). While estimates differ depending on how broadly or narrowly robotics is defined, this forecast illustrates the substantial long-term market growth potential and underscores the scale of opportunity for investors. Companies that integrate robotics into their operations are gaining competitive advantages through efficiency and scalable growth models. While deployment challenges and regulatory considerations remain, we believe robotics is positioned to become one of the most important enablers of economic transformation in the decades ahead.

To read the full thought piece, please use the link below. 

To view the full presentation click here


Presenters

Dustin Haygood

Client Portfolio Manager

INVESTMENT TEAM,
CLIENT SERVICE

Yili Xiong

Client Portfolio Analyst

INVESTMENT TEAM,
CLIENT SERVICE

About Aristotle Capital Management

Aristotle Capital Management, LLC is a privately owned, registered investment advisor that specializes in equity portfolio management for institutional and individual clients worldwide. We are one of four independent investment teams which collectively operate under a unified platform known as Aristotle. Our mission is to add value with active portfolio management to help our clients reach their long-term financial goals.

Learn More

For more on Aristotle Capital, access the latest resources.

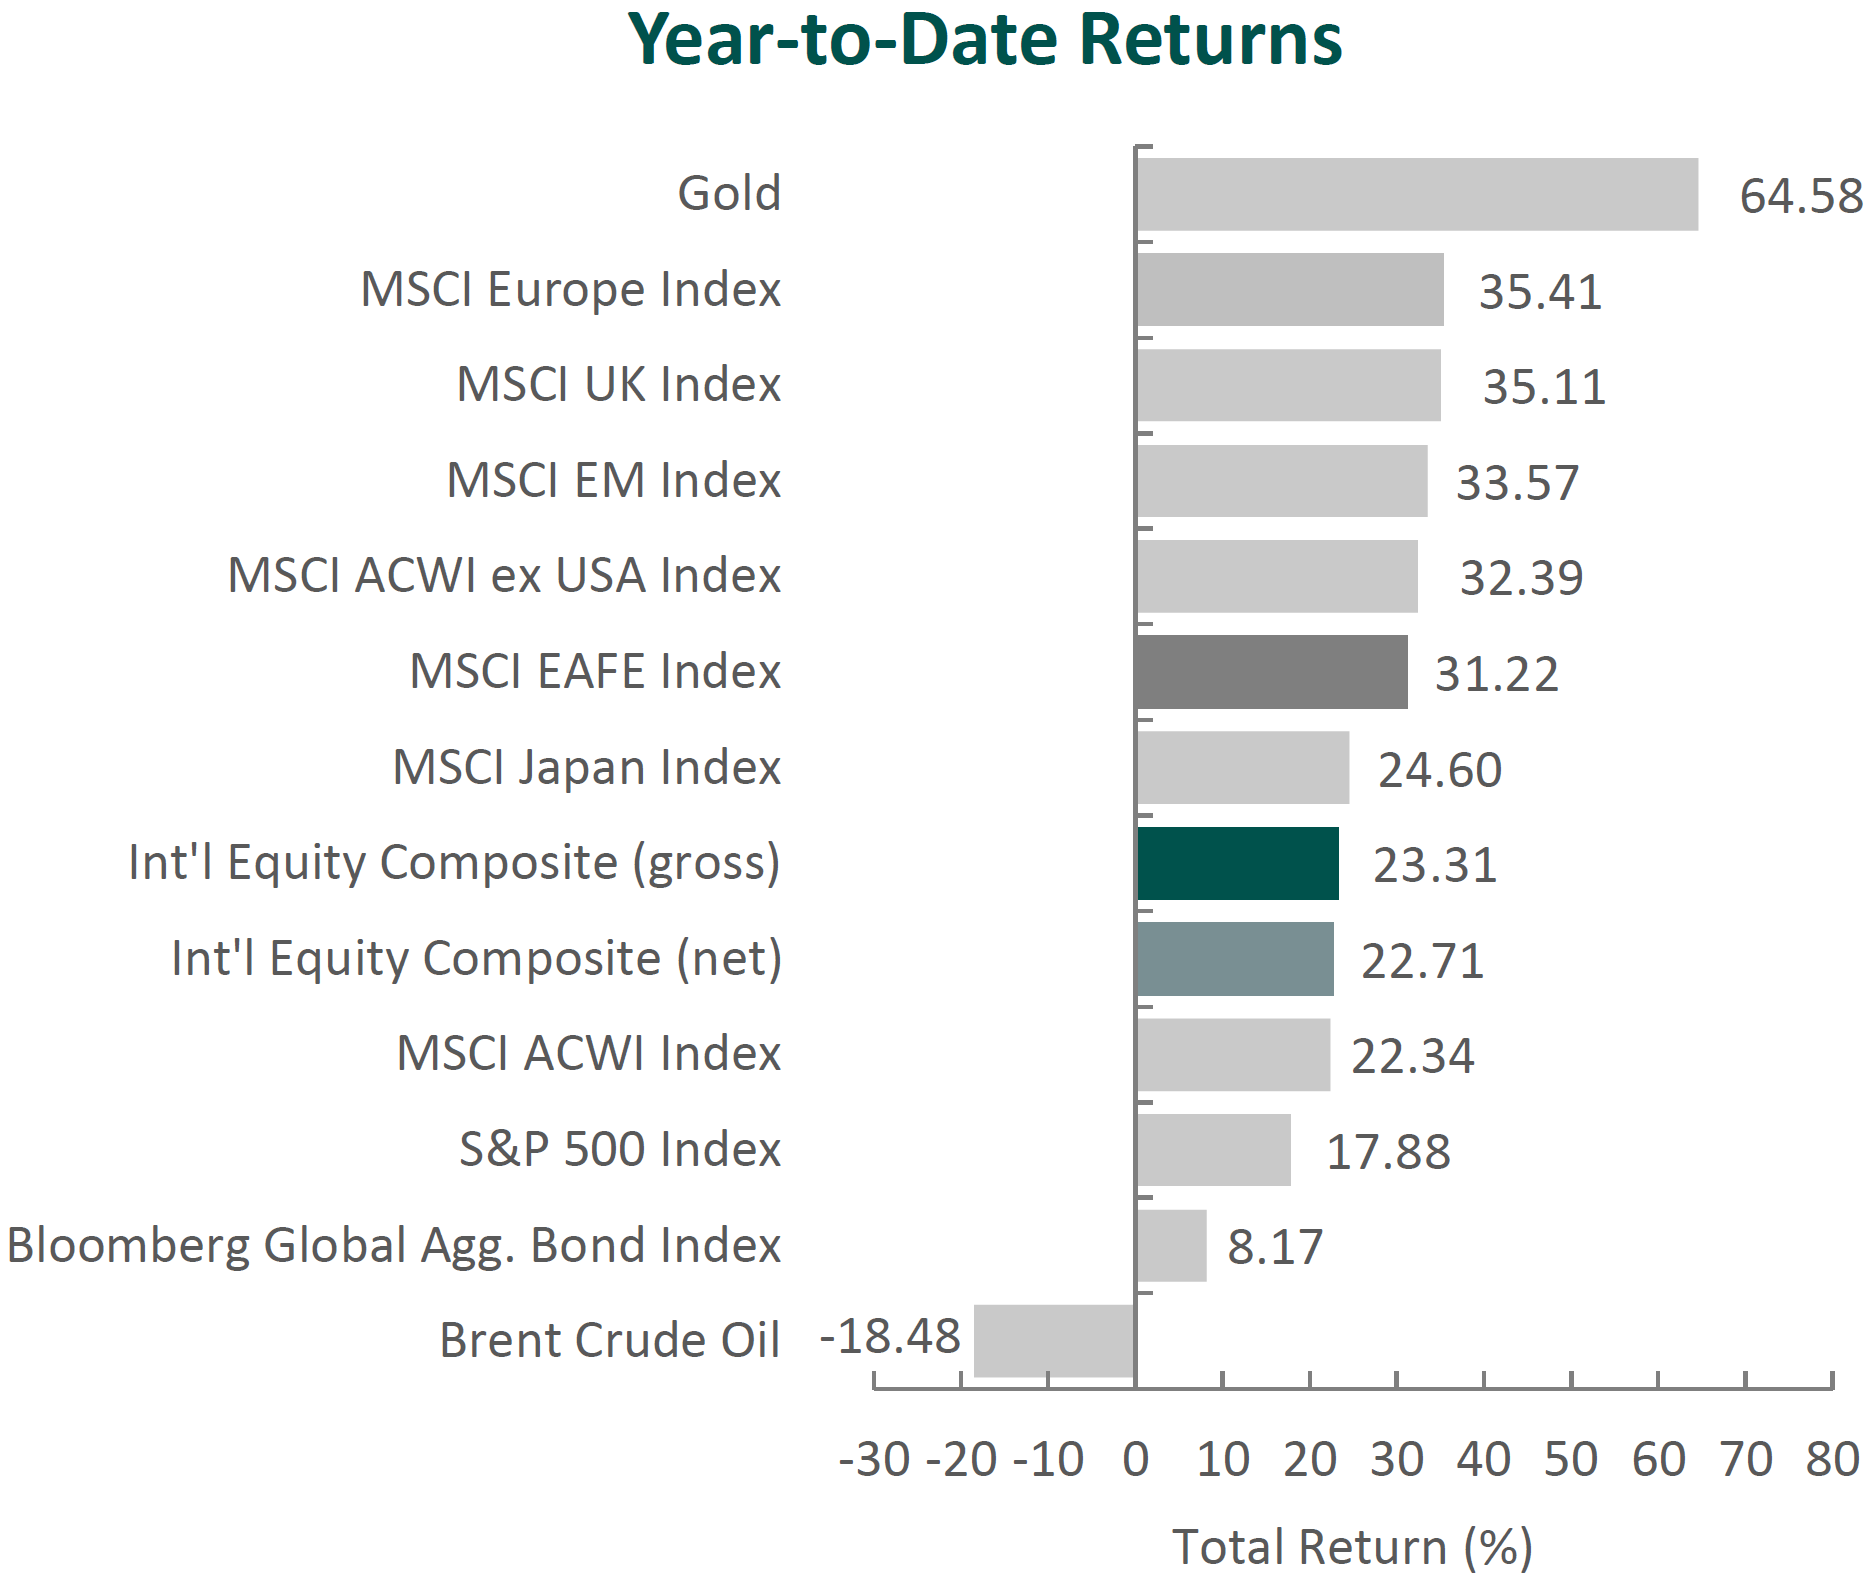
(All MSCI index returns are shown net and in U.S. dollars unless otherwise noted.)

Markets Review

Sources: CAPS CompositeHubTM, Bloomberg
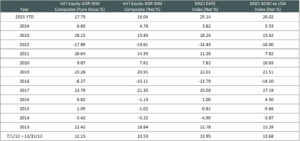
Past performance is not indicative of future results. Aristotle International Equity ADR WM Composite returns are presented pure gross and net of the maximum wrap fee and include the reinvestment of all income. Pure gross returns do not reflect the deduction of any trading costs or other fees and are supplemental to the net returns. Net returns are calculated by subtracting the highest applicable wrap/SMA fee, which includes trading costs and custodial fees, from the pure gross composite return. (From inception to 12/31/2015, the highest applicable wrap/SMA fee is 3.00% on an annual basis, or 0.75% quarterly. From 1/1/2016 to 12/31/2023, the highest applicable wrap/SMA fee is 2.00% on an annual basis, or 0.50% quarterly and 0.17% monthly from 1/1/2024 to present.) Aristotle Capital Composite returns are preliminary pending final account reconciliation. Please see important disclosures at the end of this document.

Global equity markets continued to surge, with the MSCI ACWI Index returning 7.62% for the third quarter. Concurrently, global fixed income markets also advanced, as the Bloomberg Global Aggregate Bond Index increased 0.60%. Value stocks underperformed growth stocks over the quarter, with the MSCI ACWI Value Index trailing the MSCI ACWI Growth Index by 2.85%.

The MSCI EAFE Index gained 4.77% during the period, while the MSCI ACWI ex USA Index rose 6.89%. Within the MSCI EAFE Index, Asia and the U.K. were the strongest performers, while Europe & Middle East increased the least. On a sector basis, ten out of the eleven sectors within the MSCI EAFE Index posted positive returns, with Financials, Consumer Discretionary and Energy generating the largest gains. Conversely, Consumer Staples, Health Care and Communication Services performed the worst.

Global growth projections improved, supported by fiscal expansion in major economies and a trade environment that, while still strained, has shown some stabilization compared to earlier this year. The IMF now forecasts global GDP growth of 3.0% in 2025 and 3.1% in 2026, both higher than prior estimates. While uncertainties remain—ranging from trade negotiations and tariff changes to fiscal deficits and geopolitical tensions—financial conditions have strengthened. A notable factor has been the ~14% depreciation of the U.S. dollar against the euro this year, which has helped flatten implied policy paths and provided monetary policy flexibility for developing economies. Meanwhile, global inflation readings were mixed, as headline inflation edged slightly higher, while core inflation declined below 2%, with varying levels on a regional basis.

Europe and the U.S. reached an agreement under which the EU said it would eliminate tariffs on all U.S. industrial goods and expand access to its agricultural market, while the U.S. set a 15% tariff on most EU imports, a rate that was much lower than initially proposed. The EU also pledged $600 billion of investment in the U.S. and committed to purchase $750 billion in U.S. energy products through 2028. Although the scale of these commitments has been met with skepticism, the deal eased near-term pressure on the European Central Bank, which left interest rates unchanged amid volatile trade policy conditions. Similarly, the Bank of England kept rates steady at its September meeting, despite a weakening labor market and slowing economic growth, as U.K. CPI rose 3.8% year-over-year in August. Separately, the U.K. struck a technology agreement with the U.S. under which major U.S. firms will invest in U.K. data centers and AI infrastructure.

In Asia, trade developments were mixed. Japan’s July agreement with the U.S. faces potential renegotiation following Prime Minister Shigeru Ishiba’s resignation after electoral losses. U.S. negotiations with South Korea also remain unresolved, particularly around investment commitments and visa policies. Furthermore, U.S.-India trade relations deteriorated as the Trump administration imposed an additional 25% tariff on Indian imports over continued Russian oil purchases, along with a $100,000 H-1B visa fee disproportionately affecting Indian professionals, who represent more than 70% of recipients. Meanwhile, relations with China steadied as President Trump extended the China tariff deadline by another 90 days and U.S. lawmakers visited Beijing for the first time since 2019. Across Asia, monetary policy generally remained stable, with major central banks keeping interest rates unchanged.

While much of the market’s attention has been fixated on trade policy, geopolitics also garnered headlines as President Putin visited the U.S. for the first time since 2015. While prospects of a ceasefire were tempered, President Trump expressed hopes for a second summit to include Ukrainian President Volodymyr Zelensky. Nevertheless, major hurdles remain, as President Zelensky has rejected any proposal involving territorial concessions in the Donbas region, and Russian media has downplayed the likelihood of a meeting.

Performance and Attribution Summary

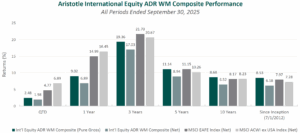
For the third quarter of 2025, Aristotle Capital’s International Equity ADR WM Composite posted a total return of 2.48% pure gross of fees (1.98% net of fees), underperforming the MSCI EAFE Index, which returned 4.77%, and the MSCI ACWI ex USA Index, which returned 6.89%. Please refer to the table below for detailed performance.

Performance (%) 3Q25YTD1 Year3 Years5 Years10 Years Since Inception*
International Equity ADR WM Composite (pure gross)2.4817.759.0219.3611.148.688.53
International Equity ADR WM Composite (net)1.9816.046.8917.038.946.526.18
MSCI EAFE Index (net)4.7725.1414.9921.7011.158.177.97
MSCI ACWI ex USA Index (net)6.8926.0216.4520.6710.268.237.28
*The inception date for the International Equity ADR WM Composite is 7/1/2012. Past performance is not indicative of future results. Aristotle International Equity ADR WM Composite returns are presented pure gross and net of the maximum wrap fee and include the reinvestment of all income. Pure gross returns do not reflect the deduction of any trading costs or other fees and are supplemental to the net returns. Net returns are calculated by subtracting the highest applicable wrap/SMA fee, which includes trading costs and custodial fees, from the pure gross composite return. (From inception to 12/31/2015, the highest applicable wrap/SMA fee is 3.00% on an annual basis, or 0.75% quarterly. From 1/1/2016 to 12/31/2023, the highest applicable wrap/SMA fee is 2.00% on an annual basis, or 0.50% quarterly and 0.17% monthly from 1/1/2024 to present.) Aristotle Capital Composite returns are preliminary pending final account reconciliation. Please see important disclosures at the end of this document.

Source: FactSet
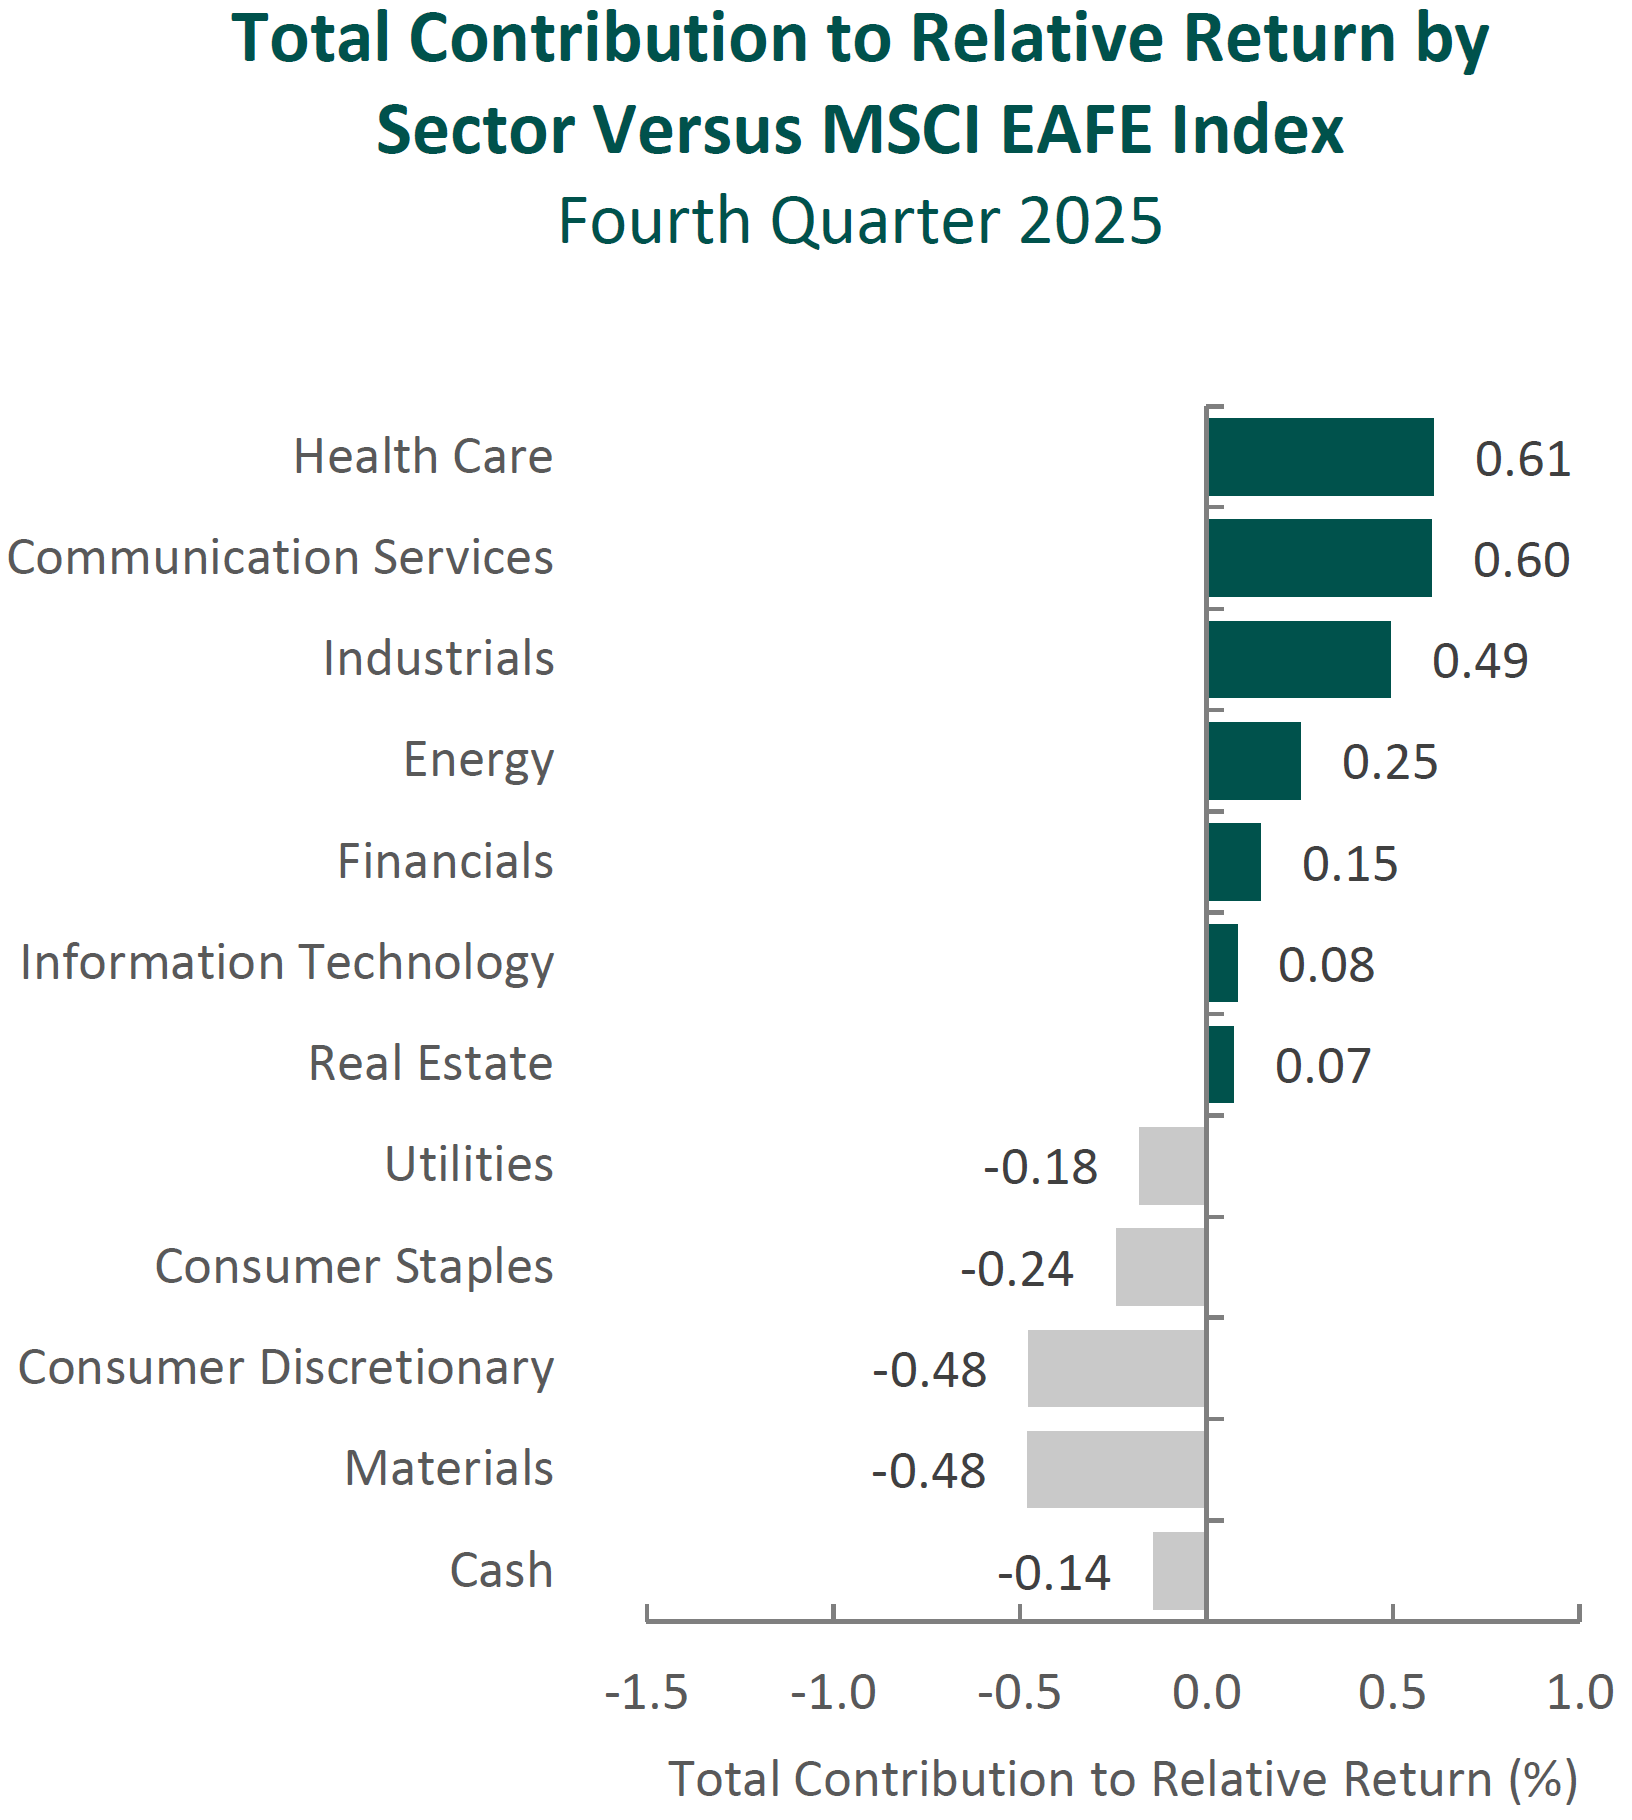
Past performance is not indicative of future results. Sector attribution shows how much of a portfolio’s overall return is directly attributable to stock selection and asset allocation decisions within the portfolio, highlighting which sectors contributed or detracted to the total return. Attribution includes the reinvestment of income. Attribution is presented gross of fees and does not include the deduction of all fees and expenses that a client or investor has paid or would have paid. Please refer to the gross and net composite returns included within to understand the overall impact of fees.

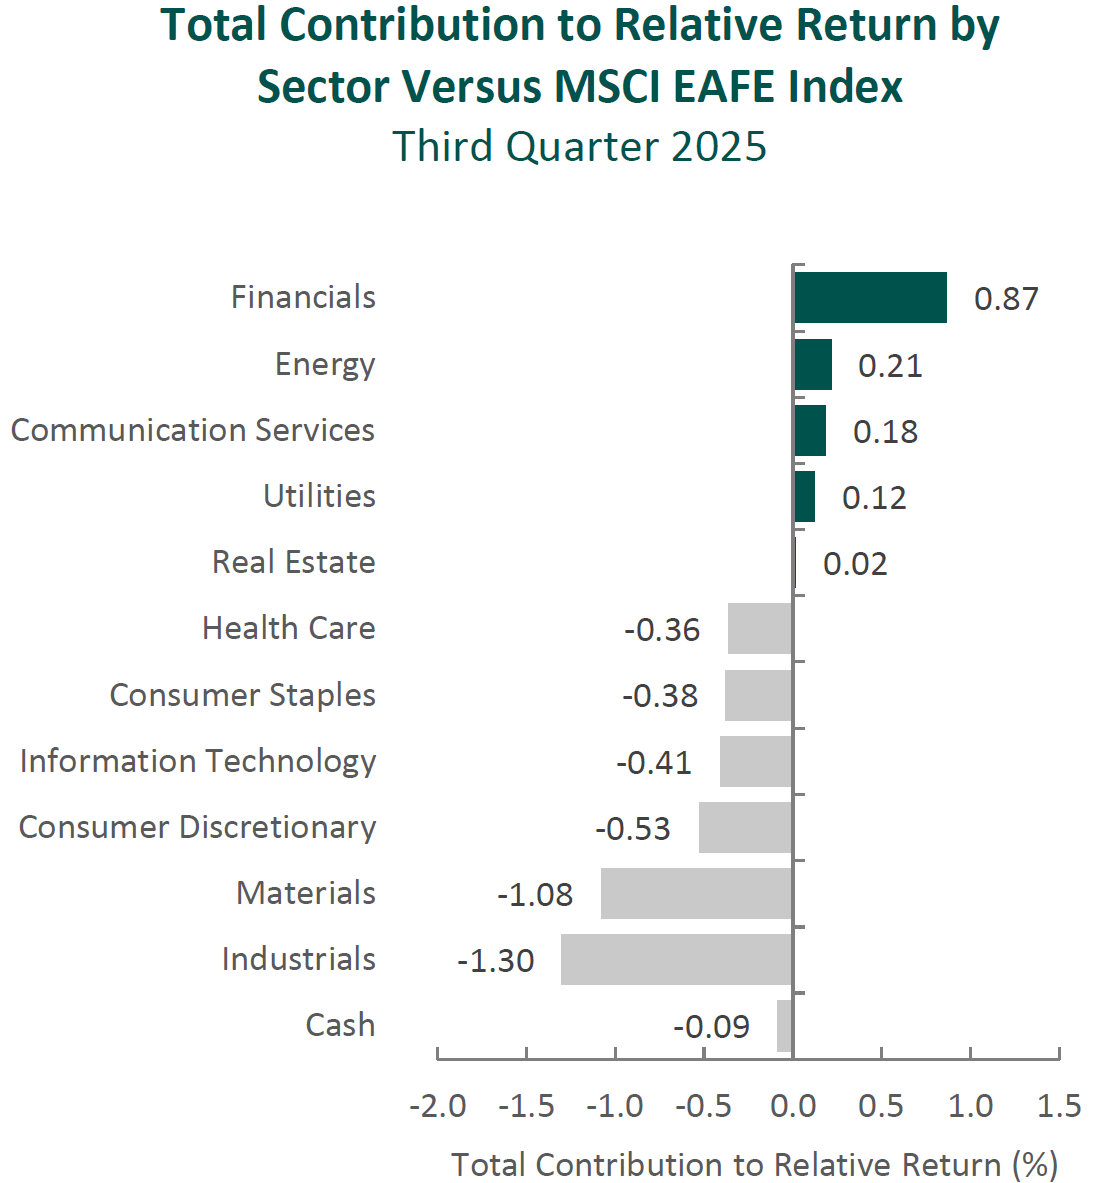
From a sector perspective, the portfolio’s underperformance relative to the MSCI EAFE Index can be attributed to security selection, while allocation effects had a positive impact. Security selection in Industrials, Materials and Consumer Discretionary detracted the most from the portfolio’s relative performance. Conversely, security selection in Financials and Energy, as well as a lack of exposure to Communication Services, contributed to relative returns.

Regionally, security selection was responsible for the portfolio’s underperformance, while allocation effects had a positive impact. Security selection in Asia and the U.K. detracted the most from relative performance, while exposure to Canada and Emerging Markets contributed.

Contributors and Detractors for 3Q 2025

Relative ContributorsRelative Detractors
ING GroepMonotaRO
CredicorpAccenture
Cameco DSM-Firmenich
SonyAlcon
Erste Group BankHaleon

MonotaRO, the Japanese business-to-business (B2B) e-commerce platform, was the largest detractor during the quarter. The company—which enables customers to source millions of maintenance, repair and operations (MRO) products through a centralized digital interface—reported a deceleration in sales growth, prompting downward revisions to full-year targets. Results were impacted by weaker-than-expected demand from industrial end markets, and we believe some of the share price weakness also reflected profit-taking following strong performance in prior periods. From our perspective, these short-term dynamics do not alter the structural advantages of MonotaRO’s business model. The company continues to gain traction with large enterprise customers, who now represent over 30% of sales. These clients typically have higher lifetime value and are more likely to adopt MonotaRO’s value-added services, such as purchase management systems, which enhance customer retention and deepen relationships. Importantly, we believe MonotaRO’s value proposition lies in convenience, execution and product curation—qualities that are difficult to replicate in Japan’s fragmented MRO market. With a high-margin, asset-light model, a scalable platform and a long runway to expand share across businesses of all sizes, we continue to view MonotaRO as a high-quality, competitively advantaged business.

Accenture, the global IT consultancy, was one of the largest detractors. The company’s operations are split roughly evenly between Consulting and Managed Services (outsourcing). While Accenture’s strategic pivot to AI in 2023 has driven a rapid increase in AI-related revenue and bookings (nearly doubling to $5.9 billion in fiscal 2025), investors have grown increasingly concerned about the longer-term impact of AI on its outsourcing business—revenue heavily reliant on billable hours. Moreover, the U.S. government’s DOGE initiative created a headwind, as federal contracts have historically represented about 8% of Accenture’s revenue. Despite these challenges, Accenture continues to grow, albeit at a below-normal rate in the recent period, while simultaneously investing in its workforce—now employing roughly 77,000 AI and data specialists, about 10% of its global staff—and returning billions of dollars to shareholders through double-digit increases in both dividends (+10% year-over-year) and share buybacks (+15%). While we acknowledge that market concerns about AI’s disruptive potential warrant consideration, we believe Accenture shares have been excessively punished (valuations are at 10-year lows). The stock has retreated to mid-2020 levels, even though earnings per share and FREE cash flow are more than 50% and 40% higher, respectively, than they were at that time.

Credicorp, the largest bank in Peru, was a leading contributor during the quarter. Results exceeded expectations, supported by robust loan growth—particularly in microfinance and retail segments—stable asset quality and disciplined cost management, even as Peru’s central bank cut rates. From our perspective, these outcomes represent the strength of a well-executed long-term strategy. Credicorp’s multi-pronged platform—anchored in banking, insurance and wealth management—offers durable advantages in an underpenetrated financial system. Its leading positions in microfinance (via Mibanco), pension fund management and investment advisory foster lasting customer relationships and recurring revenue through multi-product engagement. The company is also prudently expanding its digital ecosystem, enhancing efficiency and broadening access across income levels. Importantly, even amid macroeconomic uncertainty, management has consistently prioritized long-term value over volume, allocating capital conservatively and maintaining disciplined underwriting. We believe this enduring combination of diversification, market leadership and risk-aware culture supports our conviction in Credicorp as a resilient business with the ability to compound value over time.

Erste Group Bank, a leading retail and commercial bank in Central and Eastern Europe, was a primary contributor during the quarter. Shares rose following strong results, supported by healthy loan growth, stable deposits and solid fee income. Looking beyond near-term performance, Erste announced its intent to acquire a significant stake in Santander Bank Polska, one of Poland’s largest banks. This transaction would expand Erste’s geographic footprint into a structurally attractive market, adding scale and diversification while providing exposure to one of the fastest-growing economies in the region. As a retail-oriented bank with meaningful exposure to underbanked populations across Central and Eastern Europe, we believe Erste is well positioned to benefit as Central and Eastern economies grow, cross key income thresholds, and drive increasing demand for financial services. In addition, we believe ongoing cost efficiencies—particularly through increased use of technology—should further improve profitability. 

Recent Portfolio Activity

BuysSells
Wal-Mart de MexicoNone

During the quarter, we invested in Wal-Mart de Mexico.

Wal-Mart de Mexico SAB de CV

Founded in 1952 and headquartered in Mexico City, Wal-Mart de Mexico (Walmex) is the largest retailer in Mexico and Central America and a key subsidiary of Walmart Inc., which retains a majority ownership stake. Walmex operates more than 3,800 stores across multiple formats—Bodega Aurrerá (discount stores and the company’s fastest-growing format), Walmart Supercenter (big-box retail), Sam’s Club (membership warehouse), Walmart Express (small supermarkets) and other discount outlets—giving it a uniquely diversified presence across the consumer landscape.

This multi-format approach serves a wide spectrum of customers and shopping occasions—from everyday essentials and large family baskets to convenience and premium purchases. Bodega Aurrerá, for example, has become a household name across Mexico and now represents roughly half of the company’s stores, while Sam’s Club caters to membership customers seeking bulk purchases and higher-ticket items. Together, these formats provide Walmex broad market coverage, geographic reach and strong brand loyalty across urban centers, suburban communities and regional towns.

In recent years, the company has significantly expanded its omnichannel ecosystem, investing in e-commerce, logistics and digital services to enhance convenience and deepen customer engagement. E-commerce is ~8% of total sales, supported by strong growth in online grocery and third-party marketplace offerings. Complementary platforms, such as Cashi (digital payments), BAIT (mobile telecom) and Walmart Connect (digital advertising), extend Walmex’s reach into financial and digital services, strengthening customer ties and building new revenue streams.

Some of the quality characteristics we have identified for Walmex include:

  • Dominant scale advantages with over 3,000 stores in Mexico, making it the clear market leader in food and general merchandise retail;
  • Diversified and resilient revenue base, with a meaningful percentage of sales from grocery—providing recurring traffic and stable cash flow—complemented by general merchandise, fuel, pharmacy and membership-based services;
  • Strong returns on invested capital (~18%) supported by consistent execution and capital discipline; and
  • Support from Walmart Inc., which provides access to global best practices, digital tools and procurement efficiencies.

We believe Walmex shares are attractively valued relative to its long-term normalized earnings power. In our view, the market underappreciates the company’s ability to grow revenue through ongoing store expansion and strengthen margins and FREE cash flow generation through efficiency gains, scale benefits and continued growth in higher-margin channels, such as private label and e-commerce.

Catalysts we have identified for Walmex, which we believe will cause its stock price to appreciate over our three- to five-year investment horizon, include:

  • Expansion of private label penetration (from mid-teens to mid-20s), which should improve profitability and customer loyalty;
  • Further development of the e-commerce platform, with Walmex aiming to become a one-stop shop by combining online grocery and a third-party marketplace, supported by digital tools adapted from Walmart U.S.;
  • Disciplined store expansion, with current plans to add approximately 1,500 new stores across Mexico and Central America over the next five years, extending reach and scale advantages; and
  • Leadership continuity, as newly appointed interim CEO Cristian Barrientos, a veteran Walmart executive with more than 25 years of experience, provides operational stability and maintains focus on profitable growth during the leadership transition.

Conclusion

A core tenet of our investment philosophy is the commitment to understanding businesses with a long-term perspective. This discipline is especially critical during periods of heightened uncertainty, when macroeconomic events can dominate headlines. At Aristotle Capital, we believe one of the distinguishing strengths of our investment process is that we do not reactively reposition portfolios based on near-term developments. Instead, we maintain our focus on business fundamentals. We are convinced that it is fundamentals that ultimately drive long-term shareholder value. As such, we continue to attentively study what we believe are high quality companies with sustainable competitive advantages poised to unlock value over full market cycles.

Disclosures

The opinions expressed herein are those of Aristotle Capital Management, LLC (Aristotle Capital) and are subject to change without notice. Past performance is not a guarantee or indicator of future results. This material is not financial advice or an offer to buy or sell any product. You should not assume that any of the securities transactions, sectors or holdings discussed in this report were or will be profitable, or that recommendations Aristotle Capital makes in the future will be profitable or equal the performance of the securities listed in this report. The portfolio characteristics shown relate to the Aristotle International Equity ADR strategy. Not every client’s account will have these characteristics. Aristotle Capital reserves the right to modify its current investment strategies and techniques based on changing market dynamics or client needs. There is no assurance that any securities discussed herein will remain in an account’s portfolio at the time you receive this report or that securities sold have not been repurchased. The securities discussed may not represent an account’s entire portfolio and, in the aggregate, may represent only a small percentage of an account’s portfolio holdings. The performance attribution presented is of a representative account from Aristotle Capital’s International Equity ADR strategy. The representative account is a discretionary client account which was chosen to most closely reflect the investment style of the strategy. The criteria used for representative account selection is based on the account’s period of time under management and its similarity of holdings in relation to the strategy. Recommendations made in the last 12 months are available upon request.

Composite returns are presented pure gross and net of the maximum wrap fee and include the reinvestment of all income. Pure gross returns do not reflect the deduction of any trading costs or other fees and are supplemental to the net returns. Net returns are calculated by subtracting the highest applicable wrap/SMA fee, which includes trading costs and custodial fees, from the pure gross composite return. (From inception to 12/31/2015, the highest applicable wrap/SMA fee is 3.00% on an annual basis, or 0.75% quarterly. From 1/1/2016 to 12/31/2023, the highest applicable wrap/SMA fee is 2.00% on an annual basis, or 0.50% quarterly and 0.17% monthly from 1/1/2024 to present.)

All investments carry a certain degree of risk, including the possible loss of principal. Investments are also subject to political, market, currency and regulatory risks or economic developments. International investments involve special risks that may in particular cause a loss in principal, including currency fluctuation, lower liquidity, different accounting methods and economic and political systems, and higher transaction costs. These risks typically are greater in emerging markets. While Large-capitalization companies may have more stable prices than smaller, less established companies, they are still subject to equity securities risk. In addition, large-capitalization equity security prices may not rise as much as prices of equity securities of small-capitalization companies. Securities of small- and medium-sized companies tend to have a shorter history of operations and be more volatile and less liquid. Value stocks can perform differently from the market as a whole and other types of stocks. The material is provided for informational and/or educational purposes only and is not intended to be and should not be construed as investment, legal or tax advice and/or a legal opinion. Investors should consult their financial and tax adviser before making investments. The opinions referenced are as of the date of publication, may be modified due to changes in the market or economic conditions, and may not necessarily come to pass. Information and data presented has been developed internally and/or obtained from sources believed to be reliable. Aristotle Capital does not guarantee the accuracy, adequacy or completeness of such information.

Aristotle Capital Management, LLC is an independent registered investment adviser under the Advisers Act of 1940, as amended. Registration does not imply a certain level of skill or training. More information about Aristotle Capital, including our investment strategies, fees and objectives, can be found in our Form ADV Part 2, which is available upon request. ACM-2510-135


Performance Disclosures

Sources: CAPS CompositeHubTM, MSCI

Composite returns for all periods ended September 30, 2025 are preliminary pending final account reconciliation.

Past performance is not indicative of future results. The information provided should not be considered financial advice or a recommendation to purchase or sell any particular security or product. Performance results for periods greater than one year have been annualized.

The Aristotle International Equity ADR WM Composite has an inception date of 7/1/2012. As of 1/1/2024, the Composite was renamed from the International Equity ADR Wrap Composite.

 Composite returns are presented pure gross and net of the maximum wrap fee and include the reinvestment of all income. Pure gross returns do not reflect the deduction of any trading costs or other fees and are supplemental to the net returns. Net returns are calculated by subtracting the highest applicable wrap/SMA fee, which includes trading costs and custodial fees, from the pure gross composite return. (From inception to 12/31/2015, the highest applicable wrap/SMA fee is 3.00% on an annual basis, or 0.75% quarterly. From 1/1/2016 to 12/31/2023, the highest applicable wrap/SMA fee is 2.00% on an annual basis, or 0.50% quarterly and 0.17% monthly from 1/1/2024 to present.)

Index Disclosures

The MSCI EAFE Index (Europe, Australasia, Far East) is a free float-adjusted market capitalization-weighted index that is designed to measure the equity market performance of developed markets, excluding the United States and Canada. The MSCI EAFE Index consists of the following 21 developed market country indexes: Australia, Austria, Belgium, Denmark, Finland, France, Germany, Hong Kong, Ireland, Israel, Italy, Japan, the Netherlands, New Zealand, Norway, Portugal, Singapore, Spain, Sweden, Switzerland and the United Kingdom. The MSCI ACWI captures large and mid-cap representation across 23 developed market countries and 24 emerging markets countries. With approximately 2,500 constituents, the Index covers approximately 85% of the global investable equity opportunity set. The MSCI ACWI Growth Index captures large and mid-cap securities exhibiting overall growth style characteristics across 23 developed markets countries and 24 emerging markets countries. The MSCI ACWI Value Index captures large and mid-cap securities exhibiting overall value style characteristics across 23 developed markets countries and 24 emerging markets countries. The MSCI ACWI ex USA Index captures large and mid-cap representation across 22 of 23 developed markets countries (excluding the United States) and 24 emerging markets countries. With approximately 2,000 constituents, the Index covers approximately 85% of the global equity opportunity set outside the United States. The MSCI Emerging Markets Index is a free float-adjusted market capitalization-weighted index that is designed to measure the equity market performance of emerging markets. The MSCI Emerging Markets Index consists of the following 24 emerging market country indexes: Brazil, Chile, China, Colombia, Czech Republic, Egypt, Greece, Hungary, India, Indonesia, Korea, Kuwait, Malaysia, Mexico, Peru, Philippines, Poland, Qatar, Saudi Arabia, South Africa, Taiwan, Thailand, Turkey and United Arab Emirates. The S&P 500® Index is the Standard & Poor’s Composite Index of 500 stocks and is a widely recognized, unmanaged index of common stock prices. The Brent Crude Oil Index is a major trading classification of sweet light crude oil that serves as a major benchmark price for purchases of oil worldwide. The MSCI Japan Index is designed to measure the performance of the large and mid-cap segments of the Japanese market. With approximately 200 constituents, the Index covers approximately 85% of the free float-adjusted market capitalization in Japan. The Bloomberg Global Aggregate Bond Index is a flagship measure of global investment grade debt from 27 local currency markets. This multi-currency benchmark includes treasury, government-related, corporate and securitized fixed-rate bonds from both developed and emerging markets issuers. The MSCI United Kingdom Index is designed to measure the performance of the large and mid-cap segments of the U.K. market. With nearly 100 constituents, the Index covers approximately 85% of the free float-adjusted market capitalization in the United Kingdom. The MSCI Europe Index captures large and mid-cap representation across 15 developed markets countries in Europe. With approximately 400 constituents, the Index covers approximately 85% of the free float-adjusted market capitalization across the European developed markets equity universe. UK CPI Index is a measurement of inflation and prices, including consumer price inflation, producer price inflation and the House Price Index. These indexes have been selected as the benchmarks and are used for comparison purposes only. The volatility (beta) of the Composite may be greater or less than the respective benchmarks. It is not possible to invest directly in these indexes.

For more on International Equity, access the latest resources.

(All MSCI index returns are shown net and in U.S. dollars unless otherwise noted.)

Markets Review

Sources: CAPS CompositeHubTM, Bloomberg
Past performance is not indicative of future results. Aristotle International Equity ADR Composite returns are presented gross and net of investment advisory fees and include the reinvestment of all income. Gross returns will be reduced by fees and other expenses that may be incurred in the management of the account. Net returns are calculated by subtracting a model fee of 0.50% on an annual basis or 0.04167% on a monthly basis, which includes trading costs and the revinvestment of all income. Aristotle Capital Composite returns are preliminary pending final account reconciliation. Please see important disclosures at the end of this document.

Global equity markets continued to surge, with the MSCI ACWI Index returning 7.62% for the third quarter. Concurrently, global fixed income markets also advanced, as the Bloomberg Global Aggregate Bond Index increased 0.60%. Value stocks underperformed growth stocks over the quarter, with the MSCI ACWI Value Index trailing the MSCI ACWI Growth Index by 2.85%.

The MSCI EAFE Index gained 4.77% during the period, while the MSCI ACWI ex USA Index rose 6.89%. Within the MSCI EAFE Index, Asia and the U.K. were the strongest performers, while Europe & Middle East increased the least. On a sector basis, ten out of the eleven sectors within the MSCI EAFE Index posted positive returns, with Financials, Consumer Discretionary and Energy generating the largest gains. Conversely, Consumer Staples, Health Care and Communication Services performed the worst.

Global growth projections improved, supported by fiscal expansion in major economies and a trade environment that, while still strained, has shown some stabilization compared to earlier this year. The IMF now forecasts global GDP growth of 3.0% in 2025 and 3.1% in 2026, both higher than prior estimates. While uncertainties remain—ranging from trade negotiations and tariff changes to fiscal deficits and geopolitical tensions—financial conditions have strengthened. A notable factor has been the ~14% depreciation of the U.S. dollar against the euro this year, which has helped flatten implied policy paths and provided monetary policy flexibility for developing economies. Meanwhile, global inflation readings were mixed, as headline inflation edged slightly higher, while core inflation declined below 2%, with varying levels on a regional basis.

Europe and the U.S. reached an agreement under which the EU said it would eliminate tariffs on all U.S. industrial goods and expand access to its agricultural market, while the U.S. set a 15% tariff on most EU imports, a rate that was much lower than initially proposed. The EU also pledged $600 billion of investment in the U.S. and committed to purchase $750 billion in U.S. energy products through 2028. Although the scale of these commitments has been met with skepticism, the deal eased near-term pressure on the European Central Bank, which left interest rates unchanged amid volatile trade policy conditions. Similarly, the Bank of England kept rates steady at its September meeting, despite a weakening labor market and slowing economic growth, as U.K. CPI rose 3.8% year-over-year in August. Separately, the U.K. struck a technology agreement with the U.S. under which major U.S. firms will invest in U.K. data centers and AI infrastructure.

In Asia, trade developments were mixed. Japan’s July agreement with the U.S. faces potential renegotiation following Prime Minister Shigeru Ishiba’s resignation after electoral losses. U.S. negotiations with South Korea also remain unresolved, particularly around investment commitments and visa policies. Furthermore, U.S.-India trade relations deteriorated as the Trump administration imposed an additional 25% tariff on Indian imports over continued Russian oil purchases, along with a $100,000 H-1B visa fee disproportionately affecting Indian professionals, who represent more than 70% of recipients. Meanwhile, relations with China steadied as President Trump extended the China tariff deadline by another 90 days and U.S. lawmakers visited Beijing for the first time since 2019. Across Asia, monetary policy generally remained stable, with major central banks keeping interest rates unchanged.

While much of the market’s attention has been fixated on trade policy, geopolitics also garnered headlines as President Putin visited the U.S. for the first time since 2015. While prospects of a ceasefire were tempered, President Trump expressed hopes for a second summit to include Ukrainian President Volodymyr Zelensky. Nevertheless, major hurdles remain, as President Zelensky has rejected any proposal involving territorial concessions in the Donbas region, and Russian media has downplayed the likelihood of a meeting.

Performance and Attribution Summary

For the third quarter of 2025, Aristotle Capital’s International Equity ADR Composite posted a total return of 2.22% gross of fees (2.09% net of fees), underperforming the MSCI EAFE Index, which returned 4.77%, and the MSCI ACWI ex USA Index, which returned 6.89%. Please refer to the table below for detailed performance.

Performance (%) 3Q25YTD1 Years3 Years5 Years10 Years Since Inception*
International Equity ADR Composite (gross)2.2217.188.6819.3711.188.657.26
International Equity ADR Composite (net)2.0916.758.1418.7910.638.116.73
MSCI EAFE Index (net)4.7725.1414.9921.7011.158.176.78
MSCI ACWI ex USA Index (net)6.8926.0216.4520.6710.268.236.35
*The inception date for the International Equity ADR Composite is June 1, 2013. Past performance is not indicative of future results. Aristotle International Equity ADR Composite returns are presented gross and net of model fees and include the reinvestment of all income. Gross returns will be reduced by fees and other expenses that may be incurred in the management of the account. Net returns are presented net of model fees. Net returns are calculated by subtracting a model fee of .50% on an annual basis or .04167% on a monthly basis, which includes trading costs and the reinvestment of all income. Aristotle Capital Composite returns are preliminary pending final account reconciliation. Please see important disclosures at the end of this document.

Source: FactSet
Past performance is not indicative of future results. Sector attribution shows how much of a portfolio’s overall return is directly attributable to stock selection and asset allocation decisions within the portfolio, highlighting which sectors contributed or detracted to the total return. Attribution includes the reinvestment of income. Attribution is presented gross of fees and does not include the deduction of all fees and expenses that a client or investor has paid or would have paid. Please refer to the gross and net composite returns included within to understand the overall impact of fees.

From a sector perspective, the portfolio’s underperformance relative to the MSCI EAFE Index can be attributed to security selection, while allocation effects had a positive impact. Security selection in Industrials, Materials and Consumer Discretionary detracted the most from the portfolio’s relative performance. Conversely, security selection in Financials and Energy, as well as a lack of exposure to Communication Services, contributed to relative returns.

Regionally, security selection was responsible for the portfolio’s underperformance, while allocation effects had a positive impact. Security selection in Asia and the U.K. detracted the most from relative performance, while exposure to Canada and Emerging Markets contributed.

Contributors and Detractors for 3Q 2025

Relative ContributorsRelative Detractors
ING GroupMonotaRO
CreditcorpAccenture
CamecoDSM-Firmenich
SonyAlcom
Erste Group BankHaleon

MonotaRO, the Japanese business-to-business (B2B) e-commerce platform, was the largest detractor during the quarter. The company—which enables customers to source millions of maintenance, repair and operations (MRO) products through a centralized digital interface—reported a deceleration in sales growth, prompting downward revisions to full-year targets. Results were impacted by weaker-than-expected demand from industrial end markets, and we believe some of the share price weakness also reflected profit-taking following strong performance in prior periods. From our perspective, these short-term dynamics do not alter the structural advantages of MonotaRO’s business model. The company continues to gain traction with large enterprise customers, who now represent over 30% of sales. These clients typically have higher lifetime value and are more likely to adopt MonotaRO’s value-added services, such as purchase management systems, which enhance customer retention and deepen relationships. Importantly, we believe MonotaRO’s value proposition lies in convenience, execution and product curation—qualities that are difficult to replicate in Japan’s fragmented MRO market. With a high-margin, asset-light model, a scalable platform and a long runway to expand share across businesses of all sizes, we continue to view MonotaRO as a high-quality, competitively advantaged business.

Accenture, the global IT consultancy, was one of the largest detractors. The company’s operations are split roughly evenly between Consulting and Managed Services (outsourcing). While Accenture’s strategic pivot to AI in 2023 has driven a rapid increase in AI-related revenue and bookings (nearly doubling to $5.9 billion in fiscal 2025), investors have grown increasingly concerned about the longer-term impact of AI on its outsourcing business—revenue heavily reliant on billable hours. Moreover, the U.S. government’s DOGE initiative created a headwind, as federal contracts have historically represented about 8% of Accenture’s revenue. Despite these challenges, Accenture continues to grow, albeit at a below-normal rate in the recent period, while simultaneously investing in its workforce—now employing roughly 77,000 AI and data specialists, about 10% of its global staff—and returning billions of dollars to shareholders through double-digit increases in both dividends (+10% year-over-year) and share buybacks (+15%). While we acknowledge that market concerns about AI’s disruptive potential warrant consideration, we believe Accenture shares have been excessively punished (valuations are at 10-year lows). The stock has retreated to mid-2020 levels, even though earnings per share and FREE cash flow are more than 50% and 40% higher, respectively, than they were at that time.

Credicorp, the largest bank in Peru, was a leading contributor during the quarter. Results exceeded expectations, supported by robust loan growth—particularly in microfinance and retail segments—stable asset quality and disciplined cost management, even as Peru’s central bank cut rates. From our perspective, these outcomes represent the strength of a well-executed long-term strategy. Credicorp’s multi-pronged platform—anchored in banking, insurance and wealth management—offers durable advantages in an underpenetrated financial system. Its leading positions in microfinance (via Mibanco), pension fund management and investment advisory foster lasting customer relationships and recurring revenue through multi-product engagement. The company is also prudently expanding its digital ecosystem, enhancing efficiency and broadening access across income levels. Importantly, even amid macroeconomic uncertainty, management has consistently prioritized long-term value over volume, allocating capital conservatively and maintaining disciplined underwriting. We believe this enduring combination of diversification, market leadership and risk-aware culture supports our conviction in Credicorp as a resilient business with the ability to compound value over time.

Erste Group Bank, a leading retail and commercial bank in Central and Eastern Europe, was a primary contributor during the quarter. Shares rose following strong results, supported by healthy loan growth, stable deposits and solid fee income. Looking beyond near-term performance, Erste announced its intent to acquire a significant stake in Santander Bank Polska, one of Poland’s largest banks. This transaction would expand Erste’s geographic footprint into a structurally attractive market, adding scale and diversification while providing exposure to one of the fastest-growing economies in the region. As a retail-oriented bank with meaningful exposure to underbanked populations across Central and Eastern Europe, we believe Erste is well positioned to benefit as Central and Eastern economies grow, cross key income thresholds, and drive increasing demand for financial services. In addition, we believe ongoing cost efficiencies—particularly through increased use of technology—should further improve profitability. 

Recent Portfolio Activity

BuysSells
Wal-Mart de MexicoNone

During the quarter, we invested in Wal-Mart de Mexico.

Wal-Mart de Mexico SAB de CV

Founded in 1952 and headquartered in Mexico City, Wal-Mart de Mexico (Walmex) is the largest retailer in Mexico and Central America and a key subsidiary of Walmart Inc., which retains a majority ownership stake. Walmex operates more than 3,800 stores across multiple formats—Bodega Aurrerá (discount stores and the company’s fastest-growing format), Walmart Supercenter (big-box retail), Sam’s Club (membership warehouse), Walmart Express (small supermarkets) and other discount outlets—giving it a uniquely diversified presence across the consumer landscape.

This multi-format approach serves a wide spectrum of customers and shopping occasions—from everyday essentials and large family baskets to convenience and premium purchases. Bodega Aurrerá, for example, has become a household name across Mexico and now represents roughly half of the company’s stores, while Sam’s Club caters to membership customers seeking bulk purchases and higher-ticket items. Together, these formats provide Walmex broad market coverage, geographic reach and strong brand loyalty across urban centers, suburban communities and regional towns.

In recent years, the company has significantly expanded its omnichannel ecosystem, investing in e-commerce, logistics and digital services to enhance convenience and deepen customer engagement. E-commerce is ~8% of total sales, supported by strong growth in online grocery and third-party marketplace offerings. Complementary platforms, such as Cashi (digital payments), BAIT (mobile telecom) and Walmart Connect (digital advertising), extend Walmex’s reach into financial and digital services, strengthening customer ties and building new revenue streams.

Some of the quality characteristics we have identified for Walmex include:

  • Dominant scale advantages with over 3,000 stores in Mexico, making it the clear market leader in food and general merchandise retail;
  • Diversified and resilient revenue base, with a meaningful percentage of sales from grocery—providing recurring traffic and stable cash flow—complemented by general merchandise, fuel, pharmacy and membership-based services;
  • Strong returns on invested capital (~18%) supported by consistent execution and capital discipline; and 
  • Support from Walmart Inc., which provides access to global best practices, digital tools and procurement efficiencies. 

We believe Walmex shares are attractively valued relative to its long-term normalized earnings power. In our view, the market underappreciates the company’s ability to grow revenue through ongoing store expansion and strengthen margins and FREE cash flow generation through efficiency gains, scale benefits and continued growth in higher-margin channels, such as private label and e-commerce.

Catalysts we have identified for Walmex, which we believe will cause its stock price to appreciate over our three- to five-year investment horizon, include:

  • Expansion of private label penetration (from mid-teens to mid-20s), which should improve profitability and customer loyalty;
  • Further development of the e-commerce platform, with Walmex aiming to become a one-stop shop by combining online grocery and a third-party marketplace, supported by digital tools adapted from Walmart U.S.;
  • Disciplined store expansion, with current plans to add approximately 1,500 new stores across Mexico and Central America over the next five years, extending reach and scale advantages; and
  • Leadership continuity, as newly appointed interim CEO Cristian Barrientos, a veteran Walmart executive with more than 25 years of experience, provides operational stability and maintains focus on profitable growth during the leadership transition.

Conclusion

A core tenet of our investment philosophy is the commitment to understanding businesses with a long-term perspective. This discipline is especially critical during periods of heightened uncertainty, when macroeconomic events can dominate headlines. At Aristotle Capital, we believe one of the distinguishing strengths of our investment process is that we do not reactively reposition portfolios based on near-term developments. Instead, we maintain our focus on business fundamentals. We are convinced that it is fundamentals that ultimately drive long-term shareholder value. As such, we continue to attentively study what we believe are high quality companies with sustainable competitive advantages poised to unlock value over full market cycles.

Disclosures

The opinions expressed herein are those of Aristotle Capital Management, LLC (Aristotle Capital) and are subject to change without notice. Past performance is not a guarantee or indicator of future results. This material is not financial advice or an offer to buy or sell any product. You should not assume that any of the securities transactions, sectors or holdings discussed in this report were or will be profitable, or that recommendations Aristotle Capital makes in the future will be profitable or equal the performance of the securities listed in this report. The portfolio characteristics shown relate to the Aristotle International Equity ADR strategy. Not every client’s account will have these characteristics. Aristotle Capital reserves the right to modify its current investment strategies and techniques based on changing market dynamics or client needs. There is no assurance that any securities discussed herein will remain in an account’s portfolio at the time you receive this report or that securities sold have not been repurchased. The securities discussed may not represent an account’s entire portfolio and, in the aggregate, may represent only a small percentage of an account’s portfolio holdings. The performance attribution presented is of a representative account from Aristotle Capital’s International Equity ADR Composite. The representative account is a discretionary client account which was chosen to most closely reflect the investment style of the strategy. The criteria used for representative account selection is based on the account’s period of time under management and its similarity of holdings in relation to the strategy. Recommendations made in the last 12 months are available upon request.

Returns are presented gross and net of model fees and include the reinvestment of all income. Gross returns will be reduced by fees and other expenses that may be incurred in the management of the account. Net returns are presented net of model fees. Net returns are calculated by subtracting a model fee of .50% on an annual basis or .04167% on a monthly basis, which includes trading costs and the reinvestment of all income.

All investments carry a certain degree of risk, including the possible loss of principal. Investments are also subject to political, market, currency and regulatory risks or economic developments. International investments involve special risks that may in particular cause a loss in principal, including currency fluctuation, lower liquidity, different accounting methods and economic and political systems, and higher transaction costs. These risks typically are greater in emerging markets. While Large-capitalization companies may have more stable prices than smaller, less established companies, they are still subject to equity securities risk. In addition, large-capitalization equity security prices may not rise as much as prices of equity securities of small-capitalization companies. Securities of small- and medium-sized companies tend to have a shorter history of operations and be more volatile and less liquid. Value stocks can perform differently from the market as a whole and other types of stocks. The material is provided for informational and/or educational purposes only and is not intended to be and should not be construed as investment, legal or tax advice and/or a legal opinion. Investors should consult their financial and tax adviser before making investments. The opinions referenced are as of the date of publication, may be modified due to changes in the market or economic conditions, and may not necessarily come to pass. Information and data presented has been developed internally and/or obtained from sources believed to be reliable. Aristotle Capital does not guarantee the accuracy, adequacy or completeness of such information.

Aristotle Capital Management, LLC is an independent registered investment adviser under the Advisers Act of 1940, as amended. Registration does not imply a certain level of skill or training. More information about Aristotle Capital, including our investment strategies, fees and objectives, can be found in our Form ADV Part 2, which is available upon request. ACM-2510-110

Performance Disclosures

Sources: CAPS CompositeHubTM, MSCI

Composite returns for all periods ended September 30, 2025 are preliminary pending final account reconciliation.

Past performance is not indicative of future results. The information provided should not be considered financial advice or a recommendation to purchase or sell any particular security or product. Performance results for periods greater than one year have been annualized. Returns are presented gross and net of model fees and include the reinvestment of all income. Gross returns will be reduced by fees and other expenses that may be incurred in the management of the account. Net returns are presented net of model fees. Net returns are calculated by subtracting a model fee of .50% on an annual basis or .04167% on a monthly basis, which includes trading costs and the reinvestment of all income.

Index Disclosures

The MSCI EAFE Index (Europe, Australasia, Far East) is a free float-adjusted market capitalization-weighted index that is designed to measure the equity market performance of developed markets, excluding the United States and Canada. The MSCI EAFE Index consists of the following 21 developed market country indexes: Australia, Austria, Belgium, Denmark, Finland, France, Germany, Hong Kong, Ireland, Israel, Italy, Japan, the Netherlands, New Zealand, Norway, Portugal, Singapore, Spain, Sweden, Switzerland and the United Kingdom. The MSCI ACWI captures large and mid-cap representation across 23 developed market countries and 24 emerging markets countries. With approximately 2,500 constituents, the Index covers approximately 85% of the global investable equity opportunity set. The MSCI ACWI Growth Index captures large and mid-cap securities exhibiting overall growth style characteristics across 23 developed markets countries and 24 emerging markets countries. The MSCI ACWI Value Index captures large and mid-cap securities exhibiting overall value style characteristics across 23 developed markets countries and 24 emerging markets countries. The MSCI ACWI ex USA Index captures large and mid-cap representation across 22 of 23 developed markets countries (excluding the United States) and 24 emerging markets countries. With approximately 2,000 constituents, the Index covers approximately 85% of the global equity opportunity set outside the United States. The MSCI Emerging Markets Index is a free float-adjusted market capitalization-weighted index that is designed to measure the equity market performance of emerging markets. The MSCI Emerging Markets Index consists of the following 24 emerging market country indexes: Brazil, Chile, China, Colombia, Czech Republic, Egypt, Greece, Hungary, India, Indonesia, Korea, Kuwait, Malaysia, Mexico, Peru, Philippines, Poland, Qatar, Saudi Arabia, South Africa, Taiwan, Thailand, Turkey and United Arab Emirates. The S&P 500® Index is the Standard & Poor’s Composite Index of 500 stocks and is a widely recognized, unmanaged index of common stock prices. The Brent Crude Oil Index is a major trading classification of sweet light crude oil that serves as a major benchmark price for purchases of oil worldwide. The MSCI Japan Index is designed to measure the performance of the large and mid-cap segments of the Japanese market. With approximately 200 constituents, the Index covers approximately 85% of the free float-adjusted market capitalization in Japan. The Bloomberg Global Aggregate Bond Index is a flagship measure of global investment grade debt from 27 local currency markets. This multi-currency benchmark includes treasury, government-related, corporate and securitized fixed-rate bonds from both developed and emerging markets issuers. The MSCI United Kingdom Index is designed to measure the performance of the large and mid-cap segments of the U.K. market. With nearly 100 constituents, the Index covers approximately 85% of the free float-adjusted market capitalization in the United Kingdom. The MSCI Europe Index captures large and mid-cap representation across 15 developed markets countries in Europe. With approximately 400 constituents, the Index covers approximately 85% of the free float-adjusted market capitalization across the European developed markets equity universe. UK CPI Index is a measurement of inflation and prices, including consumer price inflation, producer price inflation and the House Price Index. These indexes have been selected as the benchmarks and are used for comparison purposes only. The volatility (beta) of the Composite may be greater or less than the respective benchmarks. It is not possible to invest directly in these indexes.

For more on International Equity, access the latest resources.

(All MSCI index returns are shown net and in U.S. dollars unless otherwise noted.)

Markets Review

Sources: CAPS CompositeHubTM, Bloomberg
Past performance is not indicative of future results. Aristotle Global Equity WM Composite returns are presented pure gross and net of maximum wrap fee and include the reinvestment of all income. Pure gross returns do not reflect the deduction of any trading costs or other fees and are supplemental to the net returns. Net returns are calculated by subtracting the highest applicable wrap/SMA fee, which includes trading costs and custodial fees, from the pure gross composite return. The highest applicable wrap/SMA fee is 2.00% on an annual basis, or 0.50% quarterly from inception to 12/31/2023 and 0.17% monthly from 1/1/2024 to present. Aristotle Capital Composite returns are preliminary pending final account reconciliation. Please see important disclosures at the end of this document.

Global equity markets continued to surge, with the MSCI ACWI Index returning 7.62% for the third quarter. Concurrently, global fixed income markets also advanced, as the Bloomberg Global Aggregate Bond Index increased 0.60%. Value stocks underperformed growth stocks over the quarter, with the MSCI ACWI Value Index trailing the MSCI ACWI Growth Index by 2.85%.

Gains in the global equity markets were broad-based during the period, with Emerging Markets performing especially well. Among Developed Markets, North America and Japan were top performers, while gains in Europe were more subdued. On a sector basis, ten out of the eleven sectors within the MSCI ACWI Index advanced, led by Information Technology, Communication Services and Materials. Consumer Staples, Real Estate and Health Care were the worst-performing sectors.

The U.S. economy rebounded, as real GDP increased by an annual rate of 3.8% in the second quarter, reversing the contraction in the prior quarter—the first in three years. While the headline growth was encouraging, economists caution that the underlying picture may be less robust than it appears. Much of the rebound stemmed from a decline in imports, which the U.S. Bureau of Economic Analysis attributes to the unwinding of a tariff-driven import surge earlier in the year. In effect, lower imports mechanically boosted net exports, temporarily inflating growth figures.

Beyond trade distortions, domestic demand remained steady, supported by consumer spending. However, the labor market showed signs of cooling: job gains slowed in August, and the unemployment rate—while remaining historically low—increased slightly to 4.3%. Consumer confidence weakened sequentially and year-over-year, yet spending resilience suggests households continue to lean on wage growth and accumulated savings.

Inflation data added to the complexity. The Consumer Price Index (CPI) edged higher, keeping inflation above the Federal Reserve’s 2% target. With a combination of still-elevated inflation, softer employment data and rising macroeconomic uncertainty, the FOMC reduced the federal funds rate by 0.25%, bringing the range to 4.00%-4.25%. Policymakers emphasized flexibility, underscoring their “data-dependent” approach amid competing signals.

While uncertainty remained a theme in the Fed’s recent statements, trade-related concerns eased somewhat as the White House announced progress on multiple agreements. In Europe, the U.S. and EU reached a deal under which the EU agreed to pay the U.S. a 15% tariff rate, committed to purchase $750 billion in U.S. energy and pledged $600 billion in new U.S. investments by 2028. Japan also agreed to a baseline 15% tariff on nearly all Japanese imports and committed to purchasing $8 billion annually in U.S. agricultural goods. Even relations with China steadied as President Trump extended the suspension of higher tariffs until November, while U.S. lawmakers visited the country for the first time since 2019.

However, some trade tensions persisted. The Trump Administration announced an additional 25% tariff on Indian imports in response to continued Russian oil purchases, a move that brought Russia, China and India into closer alignment. President Trump also imposed an additional 40% tariff on Brazil as he accused the country of coercing U.S companies to censor speech and turn over sensitive U.S. user data. Meanwhile, in a divided ruling, a U.S. appeals court raised questions about the legal basis for certain tariffs but stayed its order, keeping the measures in effect through mid-October while appeals proceed. The Supreme Court will hear the case on November 5, with the outcome potentially clarifying the scope of executive authority on trade policy.

Corporate America, however, showed resilience. S&P 500 companies reported earnings growth of 11.7% year-over-year, marking the third straight quarter of double-digit expansion. Importantly, over 80% of companies exceeded EPS estimates, despite more than 340 firms citing tariff-related headwinds in their commentary. Earnings strength was broad-based, led by Communication Services, Information Technology and Financials, highlighting the adaptability of U.S. firms even in a volatile trade and policy environment.

Performance and Attribution Summary

For the third quarter of 2025, Aristotle Capital’s Global Equity WM Composite posted a total return of 4.81% pure gross of fees (4.30% net of fees), underperforming the MSCI ACWI Index, which returned 7.62%, and the MSCI World Index, which returned 7.27%. Please refer to the table below for detailed performance.

Performance (%) 3Q25YTD1 Year3 Years5 Years10 Years Since Inception*
Global Equity WM Composite (pure gross)4.8116.778.1718.1311.4311.7710.35
Global Equity WM Composite (net)4.3015.076.0615.829.239.568.16
MSCI ACWI Index (net)7.6218.4417.2723.1213.5411.9110.21
MSCI World Index (net)7.2117.4317.2523.7214.4112.4311.05
*The inception date for the Global Equity WM Composite is December 1, 2010. Past performance is not indicative of future results. Aristotle Global Equity WM Composite returns are presented pure gross and net of maximum wrap fee and include the reinvestment of all income. Pure gross returns do not reflect the deduction of any trading costs or other fees and are supplemental to the net returns. Net returns are calculated by subtracting the highest applicable wrap/SMA fee, which includes trading costs and custodial fees, from the pure gross composite return. The highest applicable wrap/SMA fee is 2.00% on an annual basis, or 0.50% quarterly from inception to 12/31/2023 and 0.17% monthly from 1/1/2024 to present. Aristotle Capital Composite returns are preliminary pending final account reconciliation. Please see important disclosures at the end of this document.

Source: FactSet
Past performance is not indicative of future results. Sector attribution shows how much of a portfolio’s overall return is directly attributable to stock selection and asset allocation decisions within the portfolio, highlighting which sectors contributed or detracted to the total return. Attribution includes the reinvestment of income. Attribution is presented gross of fees and does not include the deduction of all fees and expenses that a client or investor has paid or would have paid. Please refer to the gross and net composite returns included within to understand the overall impact of fees.

From a sector perspective, the portfolio’s underperformance relative to the MSCI ACWI Index can be attributed to both security selection and allocation effects. Security selection in Information Technology, Materials and Industrials detracted the most from the portfolio’s relative performance. Conversely, security selection in Financials, Communication Services and Consumer Discretionary contributed to relative return.

Regionally, both security selection and allocation effects were responsible for the portfolio’s underperformance relative to the MSCI ACWI Index. Security selection in Europe detracted the most from relative performance, while security selection in Asia/Pacific ex Japan was the largest contributor.

Contributors and Detractors for 3Q 2025

Relative ContributorsRelative Detractors
FirstCashMonotaRO
CamecoNemetschek
Martin MariettaAlcon
LennarMicrochip Technology
Jazz PharmaceuticalsMunich Reinsurance

MonotaRO, the Japanese business-to-business (B2B) e-commerce platform, was the largest detractor during the quarter. The company—which enables customers to source millions of maintenance, repair and operations (MRO) products through a centralized digital interface—reported a deceleration in sales growth, prompting downward revisions to full-year targets. Results were impacted by weaker-than-expected demand from industrial end markets, and we believe some of the share price weakness also reflected profit-taking following strong performance in prior periods. From our perspective, these short-term dynamics do not alter the structural advantages of MonotaRO’s business model. The company continues to gain traction with large enterprise customers, who now represent over 30% of sales. These clients typically have higher lifetime value and are more likely to adopt MonotaRO’s value-added services, such as purchase management systems, which enhance customer retention and deepen relationships. Importantly, we believe MonotaRO’s value proposition lies in convenience, execution and product curation—qualities that are difficult to replicate in Japan’s fragmented MRO market. With a high-margin, asset-light model, a scalable platform and a long runway to expand share across businesses of all sizes, we continue to view MonotaRO as a high-quality, competitively advantaged business.

Nemetschek, a leading global provider of software solutions for the architecture, engineering, construction (AEC) and building operations industry, was a detractor during the period. The company continues to span the entire project lifecycle, with about 66% recurring revenue and a dominant 50% market share in Europe. Its competitive advantage is underpinned by approximately 23% of sales reinvested in R&D and a loyal user base. Third quarter underperformance reflected what we view as temporary headwinds: an accounting-driven revenue pull-forward from multi-year contracts, soft demand in German-speaking markets for design software, and a one-off charge related to an insolvent payment provider. Encouragingly, underlying fundamentals and drivers remain strong. Second quarter revenue grew 30.5% year-over-year, with annual recurring revenue up 39% and subscription/Software as a Service (SaaS) sales jumping about 67%, while the Build segment (Bluebeam, GoCanvas) also delivered standout growth. We remain confident in long-term catalysts, including Nemetschek’s transition from perpetual licenses to subscription/SaaS, accelerating Building Information Modeling adoption in construction (i.e., creating a digital twin for architects, engineers, contractors and owners to collaborate in real time), expansion into the U.S. and Asia, and bundling of its 15 brands. These drivers, combined with strong execution and market leadership, support our conviction in Nemetschek’s long-term FREE cash flow trajectory.

Pawn shop operator FirstCash was the top contributor during the quarter. FirstCash holds a dominant position in the pawn lending industry (operating about 3,300 stores, about 2.5x the footprint of its nearest competitor) and benefits from a customer base where about 75% are recurring, which together underpin a high-quality, defensive business model. Pawn loans are small, fully collateralized and non-recourse, operating under stable regulations, resulting in low credit losses and minimal regulatory risk. This model has proven resilient through economic cycles—for example, U.S. pawn loan balances grew roughly 50% during the last cyclical downturn (2007-2012). Key catalysts are also playing out: FirstCash continues to expand in Latin America amid favorable demographic tailwinds, and in August it entered the U.K. by acquiring H&T Group (286 stores), adding significant scale and geographic diversification. These strategic moves contributed to strong results, with earnings up 31% year-over-year, adjusted EBITDA up 19% and same-store pawn receivables up 13% in local currency. The company remains highly cash generative with a conservative, underleveraged balance sheet and low regulatory headwinds, reinforcing its ability to grow through cycles while delivering steady shareholder returns.

Aggregates producer Martin Marietta Materials was a top contributor for the period. Strong results were driven by continued pricing strength in aggregates—reflected in a 7.4% year-over-year increase in average selling price—and management’s decision to raise full-year guidance. The company continued its transition toward a higher-margin, aggregate-led model, exemplified by its decision to exit Texas cement operations through a recent asset exchange with Quikrete Holdings. With operations concentrated in structurally advantaged markets such as Texas and the Carolinas—regions benefiting from population growth, data center expansion, energy projects and semiconductor investment—Martin Marietta remains well-positioned for long-term demand. As the largest shipper of crushed stone by rail, the company has a scale-driven cost and distribution advantage that is difficult to replicate. In our view, consistent price increases, conservative capital allocation and focus on critical infrastructure end markets make Martin Marietta a resilient, long-duration holding.

Recent Portfolio Activity

BuysSells
None None

Consistent with our long-term horizon and low turnover, there were no new purchases or sales completed during the quarter.

Conclusion

A core tenet of our investment philosophy is the commitment to understanding businesses with a long-term perspective. This discipline is especially critical during periods of heightened uncertainty, when macroeconomic events can dominate headlines. At Aristotle Capital, we believe one of the distinguishing strengths of our investment process is that we do not reactively reposition portfolios based on near-term developments. Instead, we maintain our focus on business fundamentals. We are convinced that it is fundamentals that ultimately drive long-term shareholder value. As such, we continue to attentively study what we believe are high-quality companies with sustainable competitive advantages poised to unlock value over full market cycles.

Disclosures

The opinions expressed herein are those of Aristotle Capital Management, LLC (Aristotle Capital) and are subject to change without notice. Past performance is not a guarantee or indicator of future results. This material is not financial advice or an offer to buy or sell any product. You should not assume that any of the securities transactions, sectors or holdings discussed in this report were or will be profitable, or that recommendations Aristotle Capital makes in the future will be profitable or equal the performance of the securities listed in this report. The portfolio characteristics shown relate to the Aristotle Global Equity Advisory strategy. Not every client’s account will have these characteristics. Aristotle Capital reserves the right to modify its current investment strategies and techniques based on changing market dynamics or client needs. There is no assurance that any securities discussed herein will remain in an account’s portfolio at the time you receive this report or that securities sold have not been repurchased. The securities discussed may not represent an account’s entire portfolio and, in the aggregate, may represent only a small percentage of an account’s portfolio holdings. The performance attribution presented is of a representative account from Aristotle Capital’s Global Equity WM Composite. The representative account is a discretionary client account which was chosen to most closely reflect the investment style of the strategy. The criteria used for representative account selection is based on the account’s period of time under management and its similarity of holdings in relation to the strategy. Recommendations made in the last 12 months are available upon request.

Returns are presented gross and net of model fees and include the reinvestment of all income. Gross returns will be reduced by fees and other expenses that may be incurred in the management of the account. Net returns are presented net of model fees. Net returns are calculated by subtracting a model fee of .50% on an annual basis or .04167% on a monthly basis, which includes trading costs and the reinvestment of all income.

All investments carry a certain degree of risk, including the possible loss of principal. Investments are also subject to political, market, currency and regulatory risks or economic developments. International investments involve special risks that may in particular cause a loss in principal, including currency fluctuation, lower liquidity, different accounting methods and economic and political systems, and higher transaction costs. These risks typically are greater in emerging markets. While Large-capitalization companies may have more stable prices than smaller, less established companies, they are still subject to equity securities risk. In addition, large-capitalization equity security prices may not rise as much as prices of equity securities of small-capitalization companies. Securities of small- and medium-sized companies tend to have a shorter history of operations and be more volatile and less liquid. Value stocks can perform differently from the market as a whole and other types of stocks. The material is provided for informational and/or educational purposes only and is not intended to be and should not be construed as investment, legal or tax advice and/or a legal opinion. Investors should consult their financial and tax adviser before making investments. The opinions referenced are as of the date of publication, may be modified due to changes in the market or economic conditions, and may not necessarily come to pass. Information and data presented has been developed internally and/or obtained from sources believed to be reliable. Aristotle Capital does not guarantee the accuracy, adequacy or completeness of such information.

Aristotle Capital Management, LLC is an independent investment adviser registered under the Investment Advisers Act of 1940, as amended. Registration does not imply a certain level of skill or training. More information about Aristotle Capital, including our investment strategies, fees and objectives, can be found in our Form ADV Part 2, which is available upon request. ACM-2510-113

Performance Disclosures

Sources: CAPS CompositeHubTM, MSCI

Composite returns for all periods ended September 30, 2025 are preliminary pending final account reconciliation. MSCI ACWI (Net) was stated as the primary benchmark on June 1, 2024 and MSCI World (Net) became the secondary benchmark. 

The Aristotle Global Equity WM Composite has an inception date of December 1, 2010. As of 1/1/2024, the composite was renamed from the Global Equity Advisory Composite.Past performance is not indicative of future results. The information provided should not be considered financial advice or a recommendation to purchase or sell any particular security or product. Performance results for periods greater than one year have been annualized.

Composite returns are presented pure gross and net of the maximum wrap fee and include the reinvestment of all income. Pure gross returns do not reflect the deduction of any trading costs or other fees and are supplemental to the net returns. Net returns are calculated by subtracting the highest applicable wrap/SMA fee, which includes trading costs and custodial fees, from the pure gross composite return. The highest applicable wrap/SMA fee is 2.00% on an annual basis, or 0.50% quarterly from inception to 12/31/2023 and 0.17% monthly from 1/1/2024 to present.

Index Disclosures

MSCI ACWI (Net) was stated as the primary benchmark on June 1, 2024 and MSCI World (Net) became the secondary benchmark. The MSCI ACWI captures large and mid-cap representation across 23 developed markets and 24 emerging markets countries. With approximately 2,500 constituents, the Index covers approximately 85% of the global investable equity opportunity set. The MSCI ACWI Equal Weighted Index represents an alternative weighting scheme to its market cap weighted parent index, MSCI ACWI. The Index includes the same constituents as its parent (large and mid-cap securities from 23 developed markets and 24 emerging markets countries. However, at each quarterly rebalance date, all index constituents are weighted equally, effectively removing the influence of each constituent’s current price (high or low). Between rebalances, index constituent weightings will fluctuate due to price performance. The MSCI World Index is a free float-adjusted market capitalization weighted index that is designed to measure the equity market performance of developed markets. The MSCI World Index consists of the following 23 developed market country indexes: Australia, Austria, Belgium, Canada, Denmark, Finland, France, Germany, Hong Kong, Ireland, Israel, Italy, Japan, Netherlands, New Zealand, Norway, Portugal, Singapore, Spain, Sweden, Switzerland, the United Kingdom and the United States. The MSCI Emerging Markets Index is a free float-adjusted market capitalization-weighted index that is designed to measure equity market performance of emerging markets. The MSCI Emerging Markets Index consists of the following 24 emerging market country indexes: Brazil, Chile, China, Colombia, Czech Republic, Egypt, Greece, Hungary, India, Indonesia, Korea, Kuwait, Malaysia, Mexico, Peru, Philippines, Poland, Qatar, Saudi Arabia, South Africa, Taiwan, Thailand, Turkey and United Arab Emirates. The MSCI ACWI Growth Index captures large and mid-cap securities exhibiting overall growth style characteristics across 23 developed markets countries and 24 emerging markets countries. The MSCI ACWI Value Index captures large and mid-cap securities exhibiting overall value style characteristics across 23 developed markets countries and 24 emerging markets countries. The MSCI Europe Index captures large and mid-cap representation across 15 developed markets countries in Europe. With approximately 400 constituents, the Index covers approximately 85% of the free float-adjusted market capitalization across the European developed markets equity universe. The MSCI Japan Index is designed to measure the performance of the large and mid-cap segments of the Japanese market. With approximately 200 constituents, the Index covers approximately 85% of the free float-adjusted market capitalization in Japan. The S&P 500® Index is the Standard & Poor’s Composite Index of 500 stocks and is a widely recognized, unmanaged index of common stock prices. The S&P 500 Equal Weight Index is designed to be the size-neutral version of the S&P 500. It includes the same constituents as the cap-weighted S&P 500, but each company in the S&P 500 Equal Weight Index is allocated the same weight at each quarterly rebalance. The Bloomberg Global Aggregate Bond Index is a flagship measure of global investment grade debt from 27 local currency markets. This multi-currency benchmark includes Treasury, government-related, corporate and securitized fixed rate bonds from both developed and emerging markets issuers. The Brent Crude Oil Index is a major trading classification of sweet light crude oil that serves as a major benchmark price for purchases of oil worldwide. The U.S. Consumer Price Index is a measure of the average change over time in the prices paid by urban consumers for a market basket of consumer goods and services. The volatility (beta) of the Composite may be greater or less than the benchmarks. It is not possible to invest directly in these indexes.

Markets Review

The U.S. equity market continued to climb in the third quarter, with the S&P 500 Index rising 8.12% during the period. Concurrently, bonds also finished higher, as the Bloomberg U.S. Aggregate Bond Index increased 2.03%.

Sources: CAPS CompositeHubTM, Bloomberg

Past performance is not indicative of future results. Aristotle Atlantic Focus Growth Composite returns are presented gross and net of investment advisory fees and include the reinvestment of all income. Gross returns will be reduced by fees and other expenses that may be incurred in the management of the account. Net returns are presented net of actual investment advisory fees and after the deduction of all trading expenses. Aristotle Atlantic Composite returns are preliminary pending final account reconciliation. Please see important disclosures at the end of this document.

On a sector basis, positive returns were led by seven of the eleven sectors within the Russell 1000 Growth Index in the third quarter of 2025. The strongest sectors were Information Technology and Communication Services. The weakest sectors were Real Estate and Consumer Staples.

The U.S. economy rebounded, as real GDP increased by an annual rate of 3.8% in the second quarter, reversing the contraction in the prior quarter—the first in three years. While the headline growth was encouraging, economists caution that the underlying picture may be less robust than it appears. Much of the rebound stemmed from a decline in imports, which the U.S. Bureau of Economic Analysis attributes to the unwinding of a tariff-driven import surge earlier in the year. In effect, lower imports mechanically boosted net exports, temporarily inflating growth figures.

Beyond trade distortions, domestic demand remained steady, supported by consumer spending. However, the labor market showed signs of cooling: job gains slowed in August, and the unemployment rate—while remaining historically low—increased slightly to 4.3%. Consumer confidence weakened sequentially and year-over-year, yet spending resilience suggests households continue to lean on wage growth and accumulated savings.

Inflation data added to the complexity. The Consumer Price Index (CPI) edged higher, keeping inflation above the Federal Reserve’s 2% target. With a combination of still-elevated inflation, softer employment data and rising macroeconomic uncertainty, the FOMC reduced the federal funds rate by 0.25%, bringing the range to 4.00%-4.25%. Policymakers emphasized flexibility, underscoring their “data-dependent” approach amid competing signals.

While uncertainty remained a theme in the Fed’s recent statements, trade-related concerns eased somewhat as the White House announced progress on multiple agreements. In Europe, the U.S. and EU reached a deal under which the EU agreed to pay the U.S. a 15% tariff rate, committed to purchase $750 billion in U.S. energy and pledged $600 billion in new U.S. investments by 2028. Japan also agreed to a baseline 15% tariff on nearly all Japanese imports and committed to purchasing $8 billion annually in U.S. agricultural goods. Even relations with China steadied as President Trump extended the suspension of higher tariffs until November, while U.S. lawmakers visited the country for the first time since 2019.

However, some trade tensions persisted. The Trump Administration announced an additional 25% tariff on Indian imports in response to continued Russian oil purchases, a move that brought Russia, China and India into closer alignment. President Trump also imposed an additional 40% tariff on Brazil as he accused the country of coercing U.S companies to censor speech and turn over sensitive U.S. user data. Meanwhile, in a divided ruling, a U.S. appeals court raised questions about the legal basis for certain tariffs but stayed its order, keeping the measures in effect through mid-October while appeals proceed. The Supreme Court will hear the case on November 5, with the outcome potentially clarifying the scope of executive authority on trade policy.e 2019.

Corporate America, however, showed resilience. S&P 500 companies reported earnings growth of 11.7% year-over-year, marking the third straight quarter of double-digit expansion. Importantly, over 80% of companies exceeded EPS estimates, despite more than 340 firms citing tariff-related headwinds in their commentary. Earnings strength was broad-based, led by Communication Services, Information Technology and Financials, highlighting the adaptability of U.S. firms even in a volatile trade and policy environment.

Performance and Attribution Summary

For the third quarter of 2025, Aristotle Atlantic’s Focus Growth Composite posted a total return of 8.75% gross of fees (8.73% net of fees), underperforming the 10.51% total return of the Russell 1000 Growth Index.

Performance (%)QTDYTD1 Year3 Years5 YearsSince Inception*
Focus Growth Composite (gross)8.7517.1623.0828.8813.4815.71
Focus Growth Composite (net)8.7317.0822.9628.7613.3715.49
Russell 1000 Growth Index10.5117.2425.5331.6117.5818.40
*The Focus Growth Composite has an inception date of March 1, 2018. Past performance is not indicative of future results. Aristotle Atlantic Focus Growth Composite returns are presented gross and net of investment advisory fees and include the reinvestment of all income. Gross returns will be reduced by fees and other expenses that may be incurred in the management of the account. Net returns are presented net of actual investment advisory fees and after the deduction of all trading expenses. Aristotle Atlantic Composite returns are preliminary pending final account reconciliation. Please see important disclosures at the end of this document.

Sources: FactSet
Past performance is not indicative of future results. Sector attribution shows how much of a portfolio’s overall return is directly attributable to stock selection and asset allocation decisions within the portfolio, highlighting which sectors contributed or detracted to the total return. Attribution includes the reinvestment of income. Attribution is presented gross of fees and does not include the deduction of all fees and expenses that a client or investor has paid or would have paid. Please refer to the gross and net composite returns included within to understand the overall impact of fees. Please see important disclosures at the end of this document.

During the third quarter, the portfolio’s underperformance relative to the Russell 1000 Growth Index was due to a mix of security selection and allocation effects. Security selection in Information Technology and Financials detracted the most from relative returns. Conversely, security selection in Health Care and Real Estate contributed the most.

Contributors and Detractors for 3Q 2025

Relative ContributorsRelative Detractors
OracleS&P Global
Adaptive BiotechnologiesVisa
BroadcomTrane Technologies
Guardant HealthNetflix
AlphabetCostco Wholesale

Detractors

S&P Global

S&P Global detracted from performance in the third quarter as mixed trends highlighted in the company’s second quarter earnings report tempered an otherwise solid outlook. Ratings transaction revenue declined amid softer demand for bank-loan and structured-finance issuance, while ongoing caution around market volatility weighed on sentiment. Although strength in Indices, Market Intelligence, and Global Trading Services supported growth, uneven segment performance created near-term headwinds for the shares.

Visa

Visa detracted from performance in the third quarter as concerns about slowing growth overshadowed solid second quarter operating results. Despite revenue and EPS exceeding consensus expectations, management maintained only modest full-year guidance and signaled softer fourth quarter trends, reinforcing worries of decelerating momentum.

Contributors

Oracle

Oracle contributed to performance in the third quarter due to its transformative growth in cloud infrastructure, with management announcing that Oracle Cloud Infrastructure (OCI) revenue would grow this fiscal year and then increase through fiscal 2030. The stock surged following the closure of multiple multi-billion-dollar deals, including the $30 billion Stargate contract with OpenAI. Additionally, remaining performance obligation (RPO) growth reached 359%, providing investors with greater visibility into future revenue streams.

Adaptive Biotechnologies

Adaptive Biotechnologies contributed to performance in the third quarter as momentum continued in its minimal residual disease (MRD) testing business, anchored by its flagship clonoSEQ test for MRD in several hematological cancers. During the quarter, the company reported better-than-expected earnings and raised full-year guidance. Average selling price (ASP) increases are complementing accelerating volume growth.

Recent Portfolio Activity

TThe table below shows all buys and sells completed during the quarter, followed by a brief rationale.

BuysSells
ShopifyAdobe

Buys

Shopify

Shopify is a global commerce technology company that empowers businesses of all sizes to start, scale, market, and operate efficiently through a comprehensive, multi-channel platform. The company’s focus is to make commerce better for everyone by providing simple, reliable tools and services that enhance the shopping experience for consumers and streamline operations for merchants. Shopify’s business model includes recurring subscription solutions and merchant success-based solutions, supporting millions of merchants across more than 175 countries. The platform enables seamless management of products, sales, and customer relationships across online, physical, and social channels, with a focus on continuous innovation and robust infrastructure to help merchants thrive in a competitive market.

We see Shopify as the dominant force in e-commerce enablement, benefiting from the secular shift toward online retail and the growing ecosystem of merchants seeking direct-to-consumer channels, consistently gaining market share as competitors lose ground. We think the company’s financial momentum is robust, with revenue growth accelerating and record gross merchandise volume, while structural profitability and strong free cash flow illustrate its scalable model. Shopify’s expanding suite of merchant solutions deepens customer engagement and increases revenue per merchant over time. International expansion is a key driver, with global revenue and gross merchandise value (GMV) outpacing North America and local competitors. We also see high customer retention fueled by integrated merchant services that create significant switching costs, supporting long-term platform stickiness. Shopify’s aggressive investment in AI—through features like Shopify Magic, Sidekick, and strategic partnerships—powers innovation and personalized shopping experiences. The platform’s extensive merchant base and thriving app ecosystem reinforce its competitive moat, making Shopify a flexible and difficult-to-replicate “commerce OS (Operating System)” for millions of businesses worldwide. We recognize that the stock trades at a premium to SaaS peers but view the company’s acceleration in revenue growth from increasing market share in both North America and international markets, a widening competitive moat, and increasing profitability through higher revenue per customer as supportive of the premium valuation.

Sells

Adobe

We sold Adobe and believe that competition relative to the company’s creative product suite offerings from AI startups and hyperscalers continues to increase. We believe these competitive threats will continue to pressure seats and pricing initiatives and don’t believe that Adobe’s own AI product offerings will be able to increase monetization fast enough, creating a risk to the company’s Digital Media Annualized Recurring Revenue (ARR) growth rates.

Outlook

The equity markets in the third quarter rose to new highs on the back of multiple expansion and higher earnings. Interest rates declined slightly in the quarter, with the prospect of further easing as the Fed lowers rates. There is still uncertainty around the impact of tariffs as inventories are worked off and price hikes filter through the inflation data. The markets are trading at the upper end of historical valuation levels and will need a combination of lower rates and higher corporate profits to achieve new highs. The economic data was mixed in the quarter, with inflation data largely in line with expectations but employment showing signs of weakening. A strong technology investment cycle, lower interest rates and growing corporate profits should continue to support higher equity prices. Our focus will continue to be at the company level, with an emphasis on seeking to invest in companies with secular tailwinds or strong product-driven cycles.

Disclosures

The opinions expressed herein are those of Aristotle Atlantic Partners, LLC (Aristotle Atlantic) and are subject to change without notice. Past performance is not a guarantee or indicator of future results. This material is not financial advice or an offer to purchase or sell any product. You should not assume that any of the securities transactions, sectors or holdings discussed in this report were or will be profitable, or that recommendations Aristotle Atlantic makes in the future will be profitable or equal the performance of the listed in this report. The portfolio characteristics shown relate to the Aristotle Atlantic Focus Growth strategy. Not every client’s account will have these characteristics. Aristotle Atlantic reserves the right to modify its current investment strategies and techniques based on changing market dynamics or client needs. There is no assurance that any securities discussed herein will remain in an account’s portfolio at the time you receive this report or that securities sold have not been repurchased. The securities discussed may not represent an account’s entire portfolio and, in the aggregate, may represent only a small percentage of an account’s portfolio holdings. The performance attribution presented is of a representative account from Aristotle Atlantic’s Focus Growth Composite. The representative account is a discretionary client account which was chosen to most closely reflect the investment style of the strategy. The criteria used for representative account selection is based on the account’s period of time under management and its similarity of holdings in relation to the strategy. Recommendations made in the last 12 months are available upon request. Returns are presented gross and net of investment advisory fees and include the reinvestment of all income. Gross returns will be reduced by fees and other expenses that may be incurred in the management of the account. Net returns are presented net of actual investment advisory fees and after the deduction of all trading expenses.

All investments carry a certain degree of risk, including the possible loss of principal. Investments are also subject to political, market, currency and regulatory risks or economic developments. International investments involve special risks that may in particular cause a loss in principal, including currency fluctuation, lower liquidity, different accounting methods and economic and political systems, and higher transaction costs. These risks typically are greater in emerging markets. While Large-capitalization companies may have more stable prices than smaller, less established companies, they are still subject to equity securities risk. In addition, large-capitalization equity security prices may not rise as much as prices of equity securities of small-capitalization companies. Securities of small- and medium-sized companies tend to have a shorter history of operations, be more volatile and less liquid. Value stocks can perform differently from the market as a whole and other types of stocks. The material is provided for informational and/or educational purposes only and is not intended to be and should not be construed as investment, legal or tax advice and/or a legal opinion. Investors should consult their financial and tax adviser before making investments. The opinions referenced are as of the date of publication, may be modified due to changes in the market or economic conditions, and may not necessarily come to pass. Information and data presented has been developed internally and/or obtained from sources believed to be reliable. Aristotle Atlantic does not guarantee the accuracy, adequacy or completeness of such information.

Aristotle Atlantic Partners, LLC is an independent registered investment adviser under the Advisers Act of 1940, as amended. Registration does not imply a certain level of skill or training. More information about Aristotle Atlantic, including our investment strategies, fees and objectives, can be found in our Form ADV Part 2, which is available upon request. AAP-2510-23

Performance Disclosures

Sources: CAPS CompositeHubTM

Composite returns for all periods ended September 30, 2025 are preliminary pending final account reconciliation.

Past performance is not indicative of future results. Performance results for periods greater than one year have been annualized. Returns are presented gross and net of investment advisory fees and include the reinvestment of all income. Gross returns will be reduced by fees and other expenses that may be incurred in the management of the account. Net returns are presented net of actual investment advisory fees and after the deduction of all trading expenses.

Index Disclosures

The Russell 1000® Growth Index measures the performance of the large cap growth segment of the U.S. equity universe. It includes those Russell 1000 companies with higher price-to-book ratios and higher forecasted growth values. This index has been selected as the benchmark and is used for comparison purposes only. The Russell 1000® Value Index measures the performance of the large cap value segment of the U.S. equity universe. It includes those Russell 1000 companies with lower price-to-book ratios and lower expected growth values. The S&P 500® Index is the Standard & Poor’s Composite Index of 500 stocks and is a widely recognized, unmanaged index of common stock prices. The Russell 2000® Index measures the performance of the small cap segment of the U.S. equity universe. The Russell 2000 Index is a subset of the Russell 3000® Index representing approximately 10% of the total market capitalization of that index. It includes approximately 2,000 of the smallest securities based on a combination of their market cap and current index membership. The Dow Jones Industrial Average® is a price-weighted measure of 30 U.S. blue-chip companies. The Index covers all industries except transportation and utilities. The NASDAQ Composite Index measures all NASDAQ domestic and international based common type stocks listed on The NASDAQ Stock Market. The NASDAQ Composite includes over 3,000 companies, more than most other stock market indices. The Bloomberg U.S. Aggregate Bond Index is an unmanaged index of domestic investment grade bonds, including corporate, government and mortgage-backed securities. The WTI Crude Oil Index is a major trading classification of sweet light crude oil that serves as a major benchmark price for oil consumed in the United States. The 3-Month U.S. Treasury Bill is a short-term debt obligation backed by the U.S. Treasury Department with a maturity of three months. The Consumer Price Index (CPI) is a measure of the average change over time in the prices paid by urban consumers for a market basket of consumer goods and services. While stock selection is not governed by quantitative rules, a stock typically is added only if the company has an excellent reputation, demonstrates sustained growth and is of interest to a large number of investors. The volatility (beta) of the Composite may be greater or less than its respective benchmarks. It is not possible to invest directly in these indices.