FOR FINANCIAL PROFESSIONAL USE ONLY. NOT FOR USE WITH THE PUBLIC.
Markets Review
Sources: SS&C Advent, Bloomberg
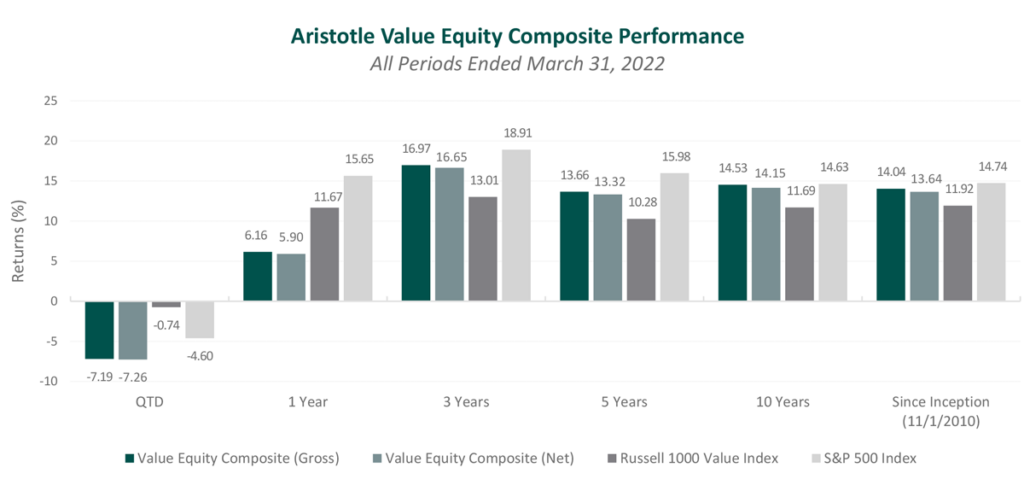
Past performance is not indicative of future results. Aristotle Value Equity Composite returns are presented gross and net of investment advisory fees and include the reinvestment of all income. Aristotle Capital Composite returns are preliminary pending final account reconciliation. Please see important disclosures at the end of this document.
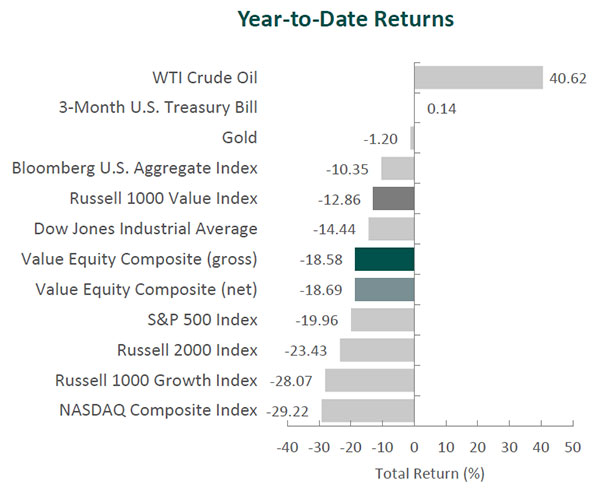
The U.S. equity market posted its second consecutive quarterly decline, as the S&P 500 Index fell 16.10% during the period, bringing its year-to-date return to -19.96%. The year-to-date performance marked the worst first half of a year since 1962. Concurrently, the Bloomberg U.S. Aggregate Bond Index dropped 4.69% for the quarter, bringing the year-to-date return to -10.35%. In terms of style, the Russell 1000 Value Index outperformed its growth counterpart by 8.71% during the quarter. For the first half of the year, that outperformance was 15.21%, on track to be the largest calendar year lead for value since the early 2000s.
On a sector basis, all eleven sectors within the Russell 1000 Value Index finished lower for the quarter, with Information Technology, Materials and Financials falling the most. Meanwhile, Health Care, Utilities and Energy declined the least.
Soaring inflation, combined with a 1.6% decrease in first quarter GDP and estimates for another decline in the second quarter, is increasing fears that a recession may be on the horizon. The CPI rose 8.6% for the year ended in May, and average U.S. gasoline prices (briefly) breached $5 per gallon in June for the first time in history.
Consumers responded to the broad-based increase in prices by reducing their personal savings rate to 4.4% in April, the lowest level since September 2008. The negative effects of supply-chain disruptions also persist, and management teams have highlighted that the strengthening dollar has reduced demand for U.S. goods sold abroad.
In many ways, the economy has continued to show signs of strength. The labor market has remained tight, with unemployment at 3.6% in May, similar to previous cyclical lows. Companies again reported robust earnings, as S&P 500 constituents grew earnings 9%, year over year, with 77% of companies exceeding consensus EPS estimates.
In response to elevated inflation, in May, the Federal Reserve raised the federal funds rate 0.50%. In June, it raised rates an additional 0.75%, the largest increase since 1994, moving the benchmark rate to a range of 1.50% to 1.75%. Additionally, the U.S. central bank officially began quantitative tightening, as it moved to reduce its $9 trillion balance sheet. So far, the increase in rates has been felt most notably in the housing market. The average 30-year fixed-rate mortgage ended the quarter at 5.70% – more than double its low of 2.65% in January 2021. Higher rates have decreased homeownership affordability and raised concerns about a potential slowdown in the real estate market.
Furthermore, geopolitical tensions remained high as the war in Ukraine continued. Western governments intensified their pressure on Russia through various sanctions, such as bans on Russian oil and gold, causing the country to default on its foreign debt for the first time since 1918. Nevertheless, a great deal of uncertainty remains surrounding a potential resolution of the conflict, further complicating the outlook for global economic activity and inflation.
Performance and Attribution Summary
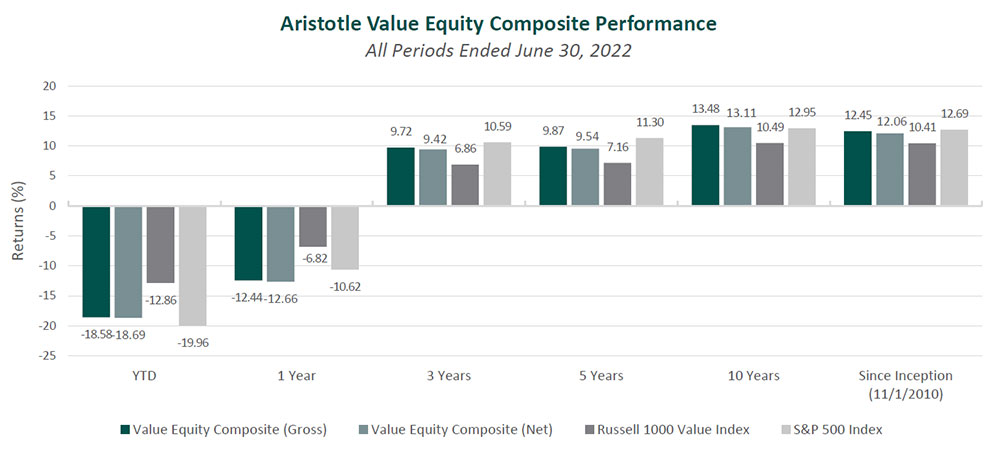
For the second quarter of 2022, Aristotle Capital’s Value Equity Composite posted a total return of -12.27% gross of fees (-12.32% net of fees), underperforming the -12.21% return of the Russell 1000 Value Index and outperforming the -16.10% return of the S&P 500 Index. Please refer to the table for detailed performance.
| Performance (%) | 2Q22 | YTD | 1 Year | 3 Years | 5 Years | 10 Years |
|---|---|---|---|---|---|---|
| Value Equity Composite (gross) | -12.27 | -18.58 | -12.44 | 9.72 | 9.87 | 13.48 |
| Value Equity Composite (net) | -12.32 | -18.69 | -12.66 | 9.42 | 9.54 | 13.11 |
| Russell 1000 Value Index | -12.21 | -12.86 | -6.82 | 6.86 | 7.16 | 10.49 |
| S&P 500 Index | -16.10 | -19.96 | -10.62 | 10.59 | 11.30 | 12.95 |
Source: FactSet
Past performance is not indicative of future results. Attribution results are based on sector returns, which are gross of investment advisory fees and include the reinvestment of all income. Please see important disclosures at the end of this document.
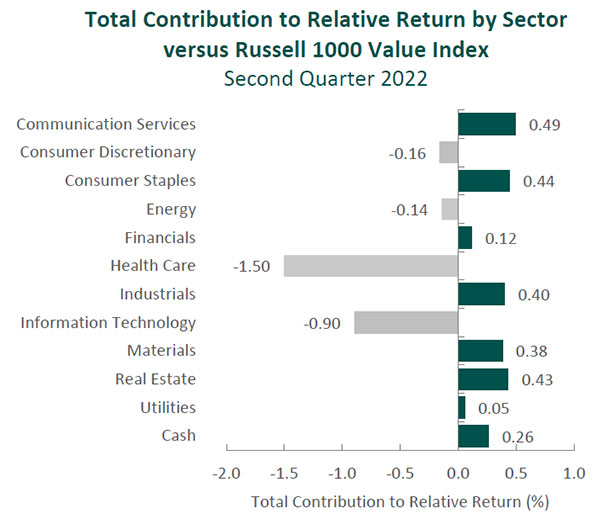
The portfolio’s underperformance relative to the Russell 1000 Value Index this quarter can be attributed to allocation effects, while security selection had a positive impact. Security selection in Health Care, an overweight in Information Technology and an underweight in Health Care detracted the most from relative performance. Conversely, security selection in Materials, Real Estate and Communication Services contributed. (Relative weights are the result of bottom-up security selection.)
Contributors and Detractors for 2Q 2022
| Relative Contributors | Relative Detractors |
|---|---|
| Blackstone | |
| Amgen | ANSYS |
| Coca-Cola | Martin Marietta Materials |
| Xcel Energy | Microchip Technology |
| Corteva Agriscience | PayPal Holdings |
Aggregates producer Martin Marietta Materials was one of the largest detractors for the quarter. Despite robust demand and positive pricing momentum, labor shortages, logistics challenges and cost inflation outpaced top-line improvement. Specifically, management cited the higher-than-anticipated rise in energy costs as a primary driver of the company’s year-over-year decline in profit margins. Nevertheless, annual price increases effective April 1, some of the largest in Martin Marietta’s recent history, and a second round of price increases in July are expected to more than offset cost pressures, resulting in long-term margin expansion. We believe the company’s ability to navigate this challenging environment with strong pricing power highlights Martin Marietta’s leading market position and geographically advantaged asset base. Furthermore, the company completed the sale of its Colorado and Central Texas ready mixed concrete operations during the period in line with its SOAR 2025 priorities. This divesture contributes to the overall optimization of Martin Marietta’s aggregates-led portfolio, which should reduce business cyclicality and raw material cost inflation exposure in the long run.
Microchip Technology, the microcontroller (MCU) and analog semiconductor producer, was a primary detractor for the period. Shares declined during the quarter despite strong fundamentals, as the company posted its fifth consecutive quarter of record revenues. After years of industry consolidation and cost cutting, led by Microchip’s disciplined and frugal executives, the business is executing on our catalyst of enhanced profitability, with operating margins exceeding 40%. FREE cash flow generation has continued to improve, allowing the company to pay out $1.6 billion in dividends and repurchase $426 million shares since fiscal year 2019. Having paid down $5 billion in debt during the same period, Microchip’s credit rating was upgraded to investment grade in 2021, reflecting its higher-quality balance sheet. While we recognize Microchip operates in a cyclical industry, we admire the company’s history of strong FREE cash flow generation through the cycles. Moreover, our conviction remains in Microchip’s ability to grow its market share while uniquely benefiting from the secular trend of expanded usage of MCUs across segments that include 5G products, IoT, data centers, electric vehicles and autonomous driving systems.
Amgen, the pharmaceutical company focused on biotechnology-based therapeutics, was a top contributor for the quarter. The company reported solid results, with a variety of products, such as bone-strengthening drugs Prolia and EVENITY, contributing to overall revenue growth. Amgen continued to increase the market share for cholesterol drug Repatha (a catalyst we had originally identified), delivering record quarterly sales as the drug’s usage expands with high-risk patients who have not yet had a cardiovascular event, and as barriers for prescribers, healthcare systems and patients are removed. In addition, we believe the company is poised to gain market share with its biosimilars (akin to generic versions of biologic drugs), also a previously identified catalyst. Biosimilars accounted for over $2 billion in revenue in 2021, and we believe this has the potential to more than double by the end of the decade, accelerated by six additional biosimilars (for a total of 11 products on the market). This includes the upcoming launch in the U.S. of arthritis treatment Amjetiva in January 2023. Meanwhile, the company is advancing its robust pipeline of early- and late-stage assets, with several phase III results due this year. These developments have caused us to remain enthusiastic about Amgen’s ability to build on its decades of success developing novel treatments using biopharmaceuticals.
Coca-Cola, the global beverage business, was a leading contributor for the period. Coca-Cola continues to benefit from the refranchising of its bottling operations and realignment of incentives, catalysts we previously identified. These initiatives are demonstrating their strength in an inflationary and supply-chain-challenged environment. Additionally, the company has focused on evolving its customer engagement practices by leveraging digital and social medias for targeted campaigns, such as the design and launch of Coke Byte in the metaverse. Lastly, Coca-Cola has furthered its transformation into a total beverage company, as it debuted its new Jack Daniel’s Tennessee Whiskey and Coca-Cola ready-to-drink premixed cocktail. Although uncertainties surrounding cost pressures, lockdowns and geopolitical conflicts remain, we believe Coca-Cola is uniquely positioned to successfully continue its transition toward a total beverage business.
Recent Portfolio Activity
We first invested in Twitter in the third quarter of 2018. During our holding period, the company executed on some catalysts that include improving the health of the platform (though more improvements can certainly be made) and enhancing the advertising server to allow for a greater mix of direct response ads.
| Buys | Sells |
|---|---|
| Autodesk |
However, Twitter disappointed on others, chief among them being the company’s inability to gain market share. Furthermore, we recently began evaluating the strategy of new CEO Parag Agrawal (appointed at the end of 2021), but the prospect of changes under his leadership was overcome by Elon Musk’s $44 billion offer ($54.20 per share) to acquire Twitter. As the investment case became more reliant on a merger-arbitrage scenario – and less about Twitter’s business fundamentals – we exited our position in late April/early May and invested the proceeds in Autodesk, which is discussed below.
Autodesk, Inc.
Headquartered in Northern California and founded in 1982, Autodesk produces software that allows companies to design and model their products and/or projects. The company is the global industry standard for computer-aided design in the architecture, engineering and construction industry (AEC). Autodesk’s millions of subscribers rely on its software to design and model buildings, manufactured products, animated films and video games. The company’s four segments are AEC (44% of net sales), its iconic software AutoCAD (29%), Manufacturing (21%), and Media and Entertainment (M&E) (6%).
Autodesk primarily sells its software on a subscription basis, having discontinued perpetual license sales of most standalone products in 2016. As part of the move to subscription licensing, Autodesk replaced its product suite with three streamlined “Industry Collections” focused on AEC, Manufacturing and M&E.
In recent years, the AEC industry has increasingly sought to resolve the inefficiencies that arise when many parties are needed to complete a building project. Autodesk has been at the cutting edge of enabling improvement through innovation and promoting the use of open standards, or open building information modeling (BIM), which allows for all relevant building data to be processed virtually in a 3D model and shared across stakeholders. Importantly, Autodesk’s leadership in ensuring the interoperability of its software with that of competitors increases collaboration and productivity among architects, engineers and contractors – an attractive value proposition for its customers.
High-Quality Business
Some of the quality characteristics we have identified for Autodesk include:
- Brand power, as AutoCAD is one of the most recognizable products in the industry;
- Leading market share in the underpenetrated AEC software market;
- Large and loyal installed base of over six million users across more than 180 countries;
- Stable business model with a high degree of recurring revenue (97% of total) and FREE cash flow generation; and
- Substantial switching costs and pricing power that stem from its advanced solutions, network effects and the time (often many years) it requires for a professional to master Autodesk software.
Attractive Valuation
We believe shares of Autodesk are attractively valued given our estimates of normalized earnings. More specifically, our analysis indicates that Autodesk’s opportunity to enhance profitability is underappreciated.
Compelling Catalysts
Catalysts we have identified for Autodesk, which we believe will cause its stock price to appreciate over our three- to five-year investment horizon, include:
- Further benefits from its subscription-based model, as it can increasingly upsell existing users through updates and bundling of products;
- Expanding addressable market in AEC as BIM continues to be more widely implemented across the industry;
- Improved profitability aided by further adoption of its cloud offerings; and
- The conversion of non-compliant users who are still using older software should increase revenue.
Conclusion
In the first half of 2022, we witnessed a new, significant geopolitical conflict, soaring inflation and tighter monetary policy. As usual, every period (up or down) brings its own “news of the day” questions, which at the time may seem critical: Is the economy entering a recession? If so, how long will it last? What will central banks do next? … and so on. Instead of spending our time making predictions or analyzing the “news of the day” (which can change rapidly), we continue to direct our efforts toward understanding the long-term fundamentals of businesses. Before investing in a company, we spend time understanding its experience in prior times of adversity, its ability (or inability) to express pricing power, management’s ability to react to changing conditions and many other factors that may impact a company’s sustainable competitive advantages. Today, we continue to focus on the long-term fundamentals of businesses, as we believe this is the best way for us to serve our clients.
The opinions expressed herein are those of Aristotle Capital Management, LLC (Aristotle Capital) and are subject to change without notice. Past performance is not a guarantee or indicator of future results. This material is not financial advice or an offer to purchase or sell any product. You should not assume that any of the securities transactions, sectors or holdings discussed in this report were or will be profitable, or that recommendations Aristotle Capital makes in the future will be profitable or equal the performance of the securities listed in this report. The portfolio characteristics shown relate to the Aristotle Value Equity strategy. Not every client’s account will have these characteristics. Aristotle Capital reserves the right to modify its current investment strategies and techniques based on changing market dynamics or client needs. There is no assurance that any securities discussed herein will remain in an account’s portfolio at the time you receive this report or that securities sold have not been repurchased. The securities discussed may not represent an account’s entire portfolio and, in the aggregate, may represent only a small percentage of an account’s portfolio holdings. The performance attribution presented is of a representative account from Aristotle Capital’s Value Equity Composite. The representative account is a discretionary client account which was chosen to most closely reflect the investment style of the strategy. The criteria used for representative account selection is based on the account’s period of time under management and its similarity of holdings in relation to the strategy. Recommendations made in the last 12 months are available upon request.
Returns are presented gross and net of investment advisory fees and include the reinvestment of all income. Gross returns will be reduced by fees and other expenses that may be incurred in the management of the account. Net returns are presented net of actual investment advisory fees and after the deduction of all trading expenses.
The Russell 1000 Value® Index measures the performance of the large cap value segment of the U.S. equity universe. It includes those Russell 1000 Index companies with lower price‐to‐book ratios and lower expected growth values. The S&P 500® Index is the Standard & Poor’s Composite Index of 500 stocks and is a widely recognized, unmanaged index of common stock prices. The Russell 1000® Growth Index measures the performance of the large cap growth segment of the U.S. equity universe. It includes those Russell 1000 companies with higher price‐to‐book ratios and higher forecasted growth values. The Russell 2000® Index measures the performance of the small cap segment of the U.S. equity universe. The Russell 2000 Index is a subset of the Russell 3000® Index representing approximately 10% of the total market capitalization of that index. It includes approximately 2,000 of the smallest securities based on a combination of their market cap and current index membership. The Dow Jones Industrial Average® is a price‐weighted measure of 30 U.S. blue‐chip companies. The Index covers all industries except transportation and utilities. The NASDAQ Composite Index measures all NASDAQ domestic and international based common type stocks listed on The NASDAQ Stock Market. The NASDAQ Composite includes over 3,000 companies, more than most other stock market indexes. The Bloomberg U.S. Aggregate Bond Index is an unmanaged index of domestic investment grade bonds, including corporate, government and mortgage‐backed securities. The WTI Crude Oil Index is a major trading classification of sweet light crude oil that serves as a major benchmark price for oil consumed in the United States. The 3‐Month U.S. Treasury Bill is a shortterm debt obligation backed by the U.S. Treasury Department with a maturity of three months. Consumer Price Index is a measure of the average change over time in the prices paid by urban consumers for a market basket of consumer goods and services. The volatility (beta) of the Composite may be greater or less than its respective benchmarks. It is not possible to invest directly in these indices.
Aristotle Capital Management, LLC is an independent registered investment adviser under the Advisers Act of 1940, as amended. Registration does not imply a certain level of skill or training. More information about Aristotle Capital, including our investment strategies, fees and objectives, can be found in our ADV Part 2, which is available upon request. ACM‐2207‐62-MLFA
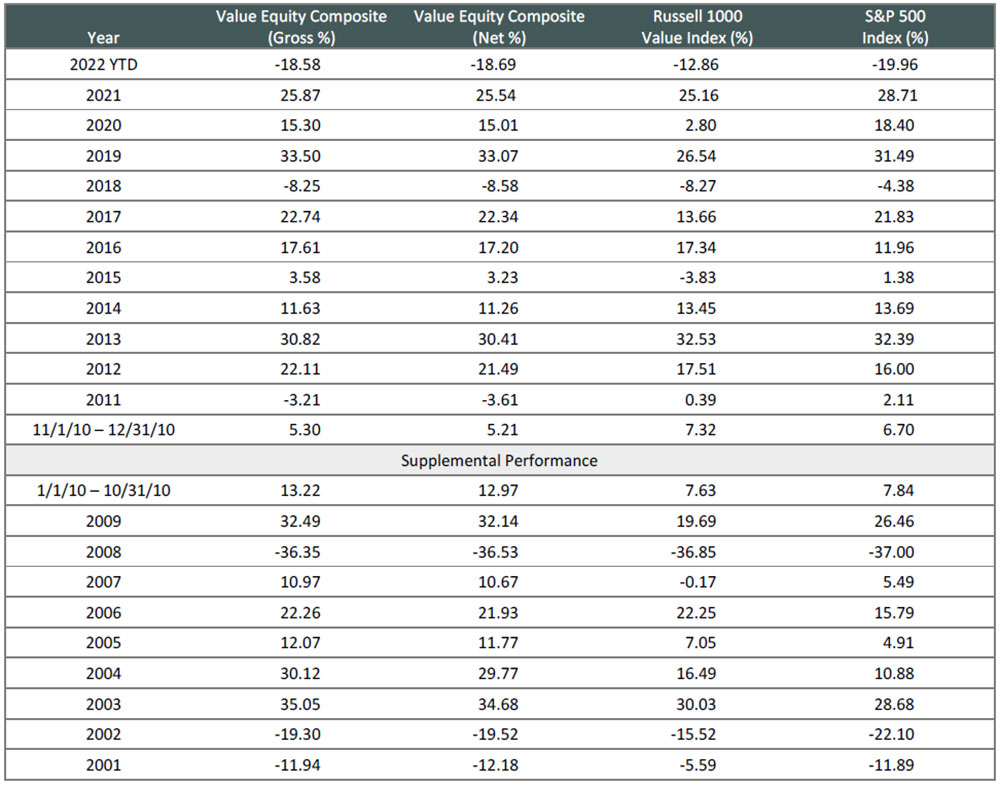
Composite returns for all periods ended June 30, 2022 are preliminary pending final account reconciliation.
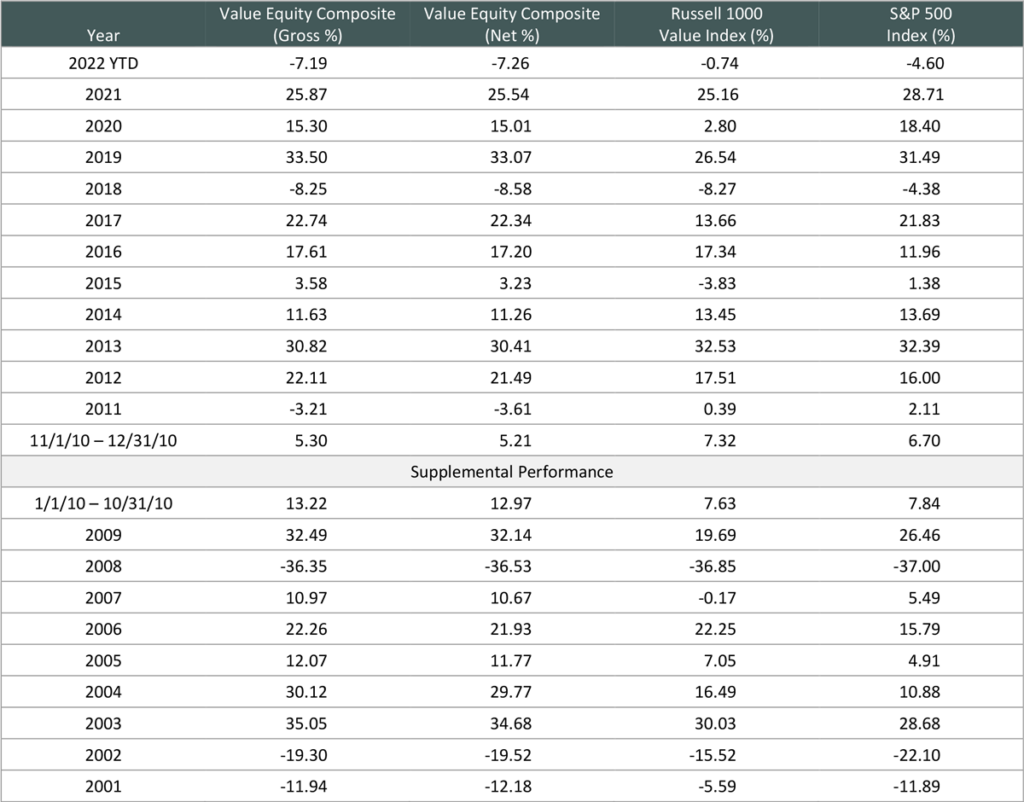
Past performance is not indicative of future results. Performance results for periods greater than one year have been annualized. Returns presented are gross and net of investment advisory fees and include the reinvestment of all income. The Aristotle Value Equity strategy has an inception date of November 1, 2010; however, the strategy initially began at Mr. Gleicher’s predecessor firm in October 1997. A supplemental performance track record from January 1, 2001 through October 31, 2010 is provided above. The returns are based on two separate accounts and performance results are based on custodian data. During this time, Mr. Gleicher had primary responsibility for managing the two accounts. Mr. Gleicher began managing one account in November 2000 and the other December 2000.
Returns are presented gross and net of investment advisory fees and include the reinvestment of all income. Gross returns will be reduced by fees and other expenses that may be incurred in the management of the account. Net returns are presented net of actual investment advisory fees and after the deduction of all trading expenses.