ARISTOTLE CAPITAL BOSTON, LLC
Markets Review
Small cap equities searched for direction in the third quarter as volatility to upside and downside continued to test investors’ fortitude. What looked like a relatively rosy market backdrop through the first half of the quarter with the Russell 2000 Index up over 18%, turned sour in the middle of August, only to worsen further in September, pushing the index into negative territory by quarter-end. Equity market intra-quarter declines coincided with the Federal Reserve (Fed) reiterating that they would prioritize reining in inflation versus supporting growth. To that end, the quarter saw two more aggressive interest-rate hikes of 0.75 percentage points, one in July and then another in September, which leaves the effective federal-funds rate at 3.00%-3.25% exiting the third quarter, its highest level since 2008. Prior to raising the fed-funds rate by three-quarters of a point in June, the Fed had not raised its flagship policy rate by 0.75 percentage points in any single meeting since 1994. These actions led to a sharp rise in bond yields and a risk-off environment that extended to equity markets across the globe. Compared to their large cap counterparts, however, small caps held up relatively well during the quarter with the Russell 2000 Index’s total return of -2.19%, besting the -4.61% return of the Russell 1000 Index. This snaps a five-quarter underperformance streak, its longest since the six quarters ending in the first quarter of 1999.
At the sector level, nine of the eleven economic sectors in the Russell 2000 Index posted negative returns during the quarter led by Real Estate (-12.59%), Communication Services (-11.03%) and Consumer Staples (-7.89%). Conversely, Health Care (+6.54%), driven by gains in Biotechnology, Energy (+5.70%) and Consumer Discretionary (-1.55%) were the top performing sectors during the quarter. From a fundamental characteristics standpoint, companies with higher betas, lower dividend yields and high short interest ratios outperformed. Unprofitable* companies within the Russell 2000 Index also outperformed profitable companies during the quarter by 8.18%.
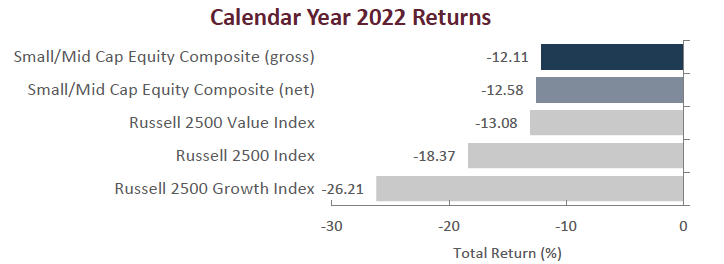
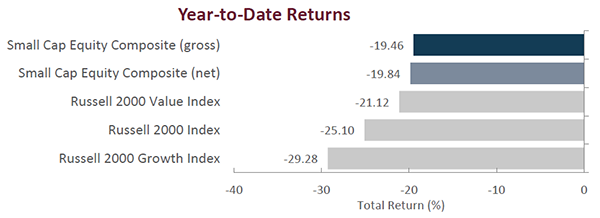
Given the factor leadership outlined above, it may come as no surprise that the Russell 2000 Growth Index (+0.24%) outpaced the Russell 2000 Value Index (-4.61%) during the period. Although the quarter granted a slight reprieve from growth’s relative underperformance versus value over the past several quarters, value’s dominance over growth in recent periods continues to be reflected in their trailing twelve-month period returns, with the Russell 2000 Value Index returning -21.12% versus -29.28% for the Russell 2000 Growth Index.
*Based on earnings expectations over the next twelve months. Source: FactSet
Sources: SS&C Advent; Russell Investments
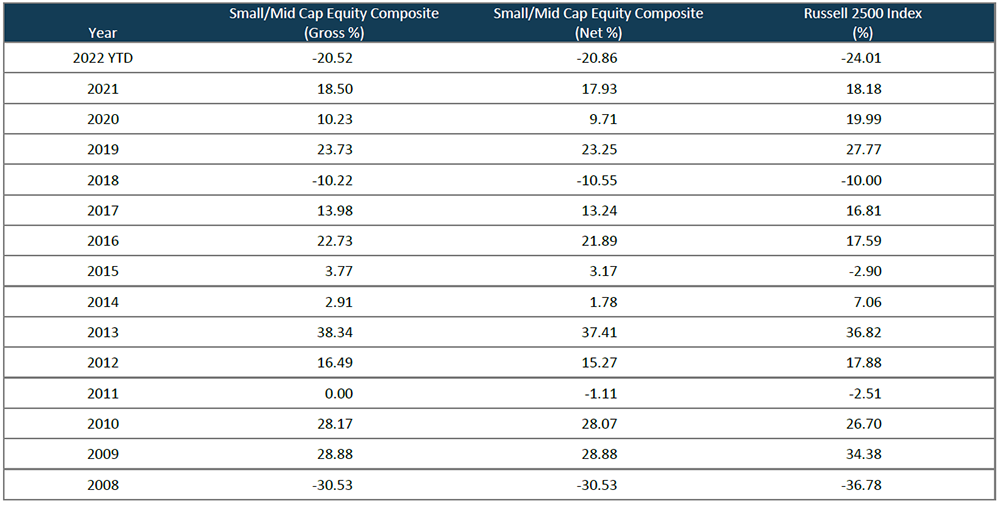
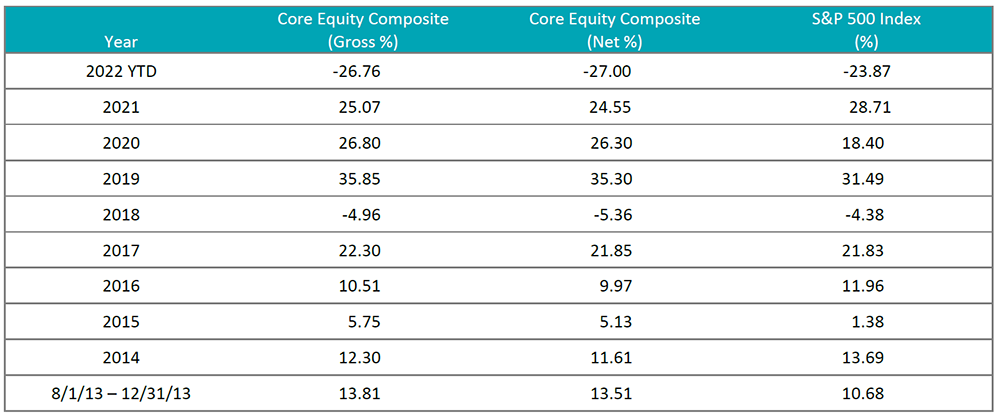
Past performance is not indicative of future results. Returns are presented gross and net of investment advisory fees and include the reinvestment of all income. Gross returns will be reduced by fees and other expenses that may be incurred in the management of the account. Net returns are presented net of actual investment advisory fees and after the deduction of all trading expenses. Aristotle Small Cap Equity Composite returns are preliminary pending final account reconciliation. Please see important disclosures at the end of this document.
Performance Review
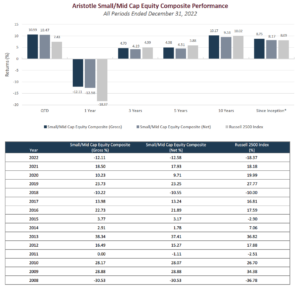
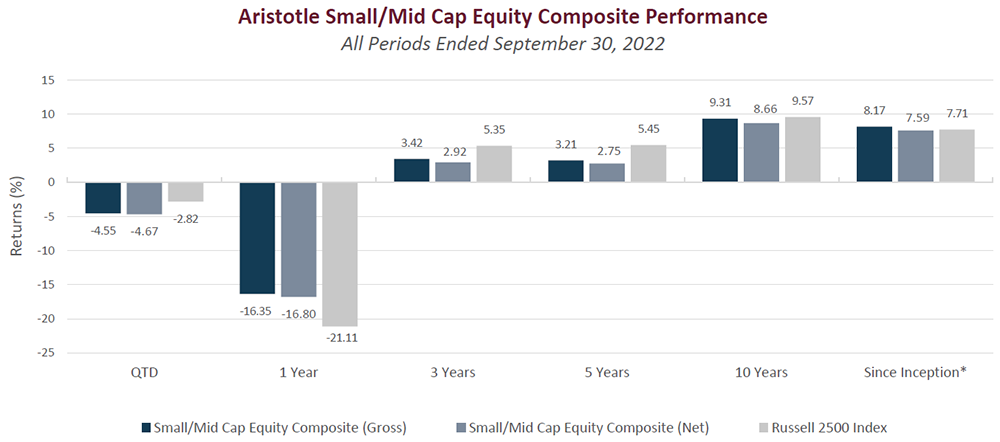
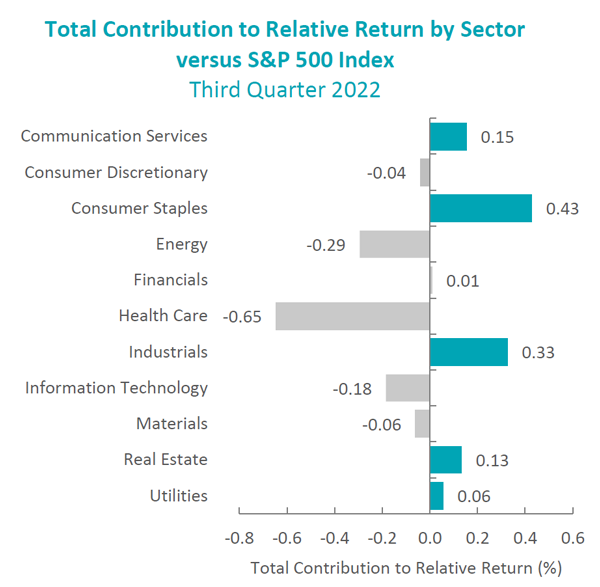
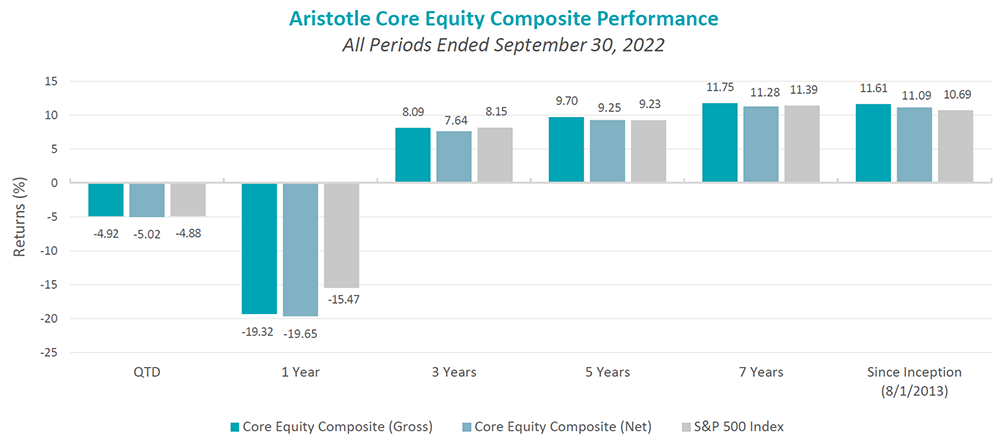
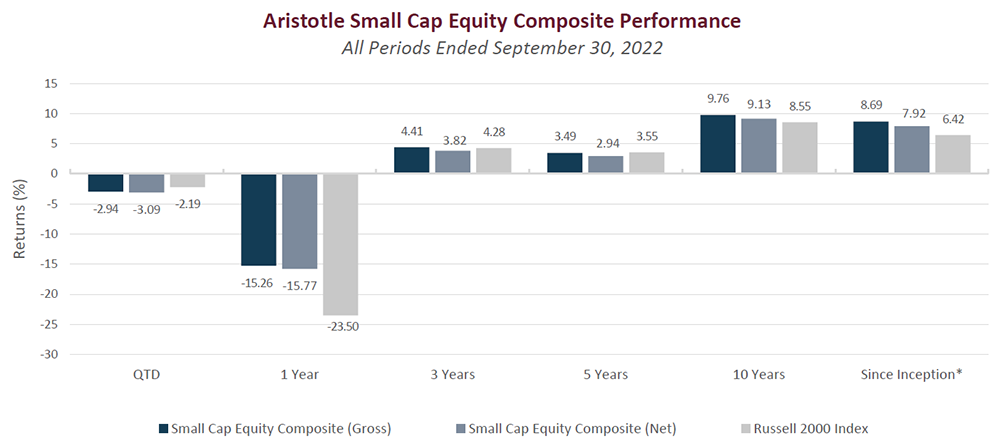
For the third quarter of 2022, the Aristotle Small Cap Equity Composite generated a total return of -2.94% gross of fees ( 3.09% net of fees), trailing the -2.19% total return of the Russell 2000 Index. Overall, security selection detracted while sector allocation positively contributed. Security selection within the Health Care, Utilities and Consumer Discretionary sectors were the largest detractors on a relative basis, while selection within Industrials, Materials and Communication Services contributed. From an allocation perspective, the portfolio benefited from underweights in Real Estate and Communication Services; however, this was partially offset by an underweight in Energy and an overweight in Industrials.
| Relative Contributors | Relative Detractors |
|---|---|
| Cross Country Healthcare | Mercury Systems |
| Acadia Healthcare | PetIQ |
| Ardmore Shipping | Knowles |
| WillScot Mobile Mini Holdings | Unitil |
| ModivCare | Euronet Worldwide |
CONTRIBUTORS
Security selection added the most value within the Industrials, Materials and Communication Services sectors. From an allocation perspective, the portfolio benefited from underweights in Real Estate and Communications Services. At the company level, Cross Country Healthcare and Acadia Healthcare were two of the largest contributors during the quarter.
Cross Country Healthcare (CCRN), a workforce solutions and healthcare staffing company, appreciated amid a favorable demand and pricing environment along with strengthening investor sentiment following the company’s upbeat investor day. We maintain a position, as we believe management’s recent investments in technology along with favorable industry supply-demand dynamics have the potential to drive further value for shareholders in periods to come.
Acadia Healthcare (ACHC), a provider of behavioral health and addiction services to patients in a variety of inpatient and outpatient settings, benefited from continued strong growth tailwinds from the increasing demand for behavioral services. We maintain a position, as we believe the company is well-positioned to capitalize on the favorable supply/demand outlook for behavioral health, positive reimbursement trends and continued execution of its growth strategy.
DETRACTORS
Security selection detracted within the Health Care, Utilities and Consumer Discretionary sectors. From an allocation perspective, the portfolio’s underweight in Energy and overweight in Industrials detracted from relative performance. Additionally, the portfolio’s orientation towards higher quality companies and avoidance of speculatively valued/money-losing businesses also detracted. At the company level, Mercury Systems and PetIQ were two of the largest detractors during the quarter.
Mercury Systems (MRCY), a provider of secure sensor and safety-critical processing subsystems for the aerospace and defense markets, declined in the face of supply chain constraints and defense budget delays despite seeing high levels of new bookings activity, design wins and a robust backlog. We maintain a position, as we believe the company is well-positioned to capitalize on continued outsourcing of subsystem development, strong mergers and acquisitions opportunities and continued technological innovation.
PetIQ (PETQ), a holding company that engages in the manufacturing, procurement, packaging and distribution of pet health and wellness, declined amid a soft start to flea and tick season along with near-term inflationary pressures. We maintain our position, as we believe the company is well-positioned to benefit from secular demand tailwinds for pet health products. Additionally, we believe management’s focus on increased penetration for its wellness clinics has the potential to create additional value for shareholders.
Recent Portfolio Activity
| Buys/Acquisitions | Sells/Liquidations |
|---|---|
| None | Huntington Bancshares |
BUYS/ACQUISITIONS
None
SELLS/LIQUIDATIONS
Huntington Bancshares (HBAN), an Ohio-based bank holding company, was removed from the portfolio based on our belief that shares were fully valued and there were better opportunities to deploy capital elsewhere within the portfolio.
Outlook and Positioning
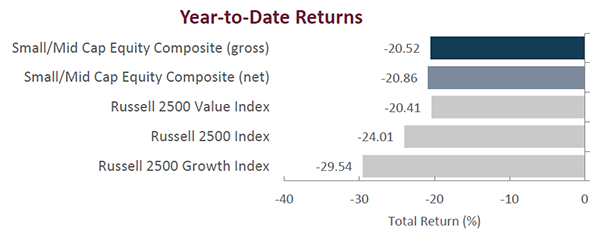
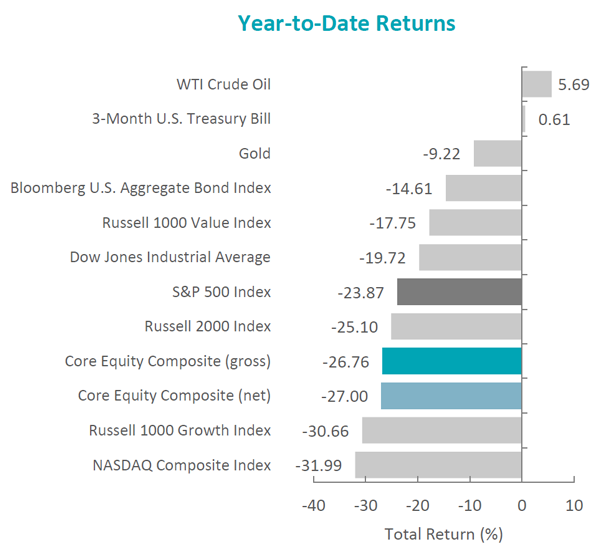
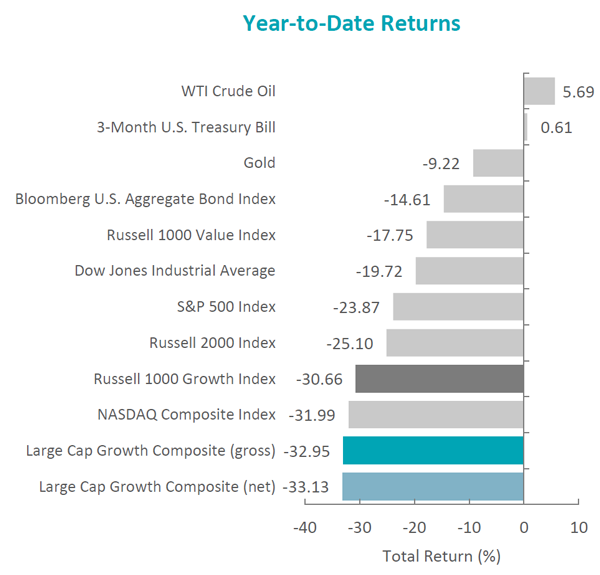
The risks to U.S. economic activity and thus the equity market overall, continue to be the same culprits that have been responsible for the market’s volatility over the past several quarters: the speed and pace of interest rate hikes, supply chain issues, currency and commodity price swings, and geopolitical turmoil across the globe. The subsequent impact of these factors, among others, has resulted in a 25.10% decline in the Russell 2000 Index through the first nine months of the year.
The question at this point is less about what has happened over the past twelve months but more importantly about where we are headed for the remainder of the year and into 2023. As we have indicated many times over the years, our ability to call the direction and magnitude of the market’s moves over the short term is no better (or worse) than anyone else’s. Therefore, we do not attempt to do so. Rather, we continue to monitor events as they unfold and factor those developments into our company-specific and portfolio-specific analyses. Overall, we remain encouraged by the fact that our conversations with hundreds of small cap companies so far in 2022 point to a relatively “stable” environment for their businesses. Companies are reporting a wide array of operating conditions for their business, from reasonably robust to continued sluggishness, but the general consensus in recent meetings is that conditions have not experienced a sudden and rapid deterioration. That is not to say that such a turn of events could not happen before the end of the year; rather, it is just meant to highlight the divergence between the market’s action and what we hear from small cap companies. With quarterly earnings season set to take center stage, we will see if their collective tones have changed or if it will be more of the same.
Another positive note stems from current valuations of small cap companies. Small cap equities continue to remain attractive on a forward valuation basis, both on an absolute level and relative to large caps. As of quarter-end, the relative forward P/E of the Russell 2000 Index versus the Russell 1000 Index continues to trade at a discount to its long-term average and now sits at its cheapest levels since the Dot-com bubble. For long-term investors, these valuations may imply a more favorable setup for small caps relative to large caps in the periods to come. The strengthening of the U.S. dollar may also have an outsized impact on third quarter earnings. In particular, large multinational companies may see a headwind as sizable chunks of their sales come from outside the U.S. That is because as the value of the dollar rises, it makes U.S.-produced goods more expensive outside the country. Continued strength in the U.S. dollar coupled with ongoing geopolitical turmoil and reshoring efforts may offer a relative boost to small caps versus large caps moving forward.
Nevertheless, with uncertainty, volatility and investor pessimism enduring, we believe these environments reinforce the need for selectivity and further argue for a focus on companies with quality characteristics, particularly strong balance sheets and healthy profitability to offer a buffer if economic conditions continue to slow. As always, our current positioning is a function of our bottom-up security selection process and our ability to identify what we view as attractive investment candidates, regardless of economic sector definitions. Recent purchases and sales have been spread across industries and are idiosyncratic in nature, as opposed to being tied to an outlook for a particular sector. Overweights in Industrials and Information Technology are mostly a function of recent portfolio activity and the relative performance of our holdings in these sectors over the past few periods. Conversely, we continue to be underweight in Consumer Discretionary, as we have been unable to identify what we consider to be compelling long-term opportunities that fit our discipline given the rising risk profiles as a result of structural headwinds for various brick and mortar businesses. We also continue to be underweight in Real Estate as a result of valuations and structural challenges for various end markets within the sector. Given our focus on long-term business fundamentals, patient investment approach and low portfolio turnover, the strategy’s sector positioning generally does not change significantly from quarter to quarter; however, we may take advantage of periods of volatility by adding selectively to certain companies when appropriate.
Disclosures
The opinions expressed herein are those of Aristotle Capital Boston, LLC (Aristotle Boston) and are subject to change without notice.
Past performance is not indicative of future results. The information provided in this report should not be considered financial advice or a recommendation to purchase or sell any particular security. There is no assurance that any securities discussed herein will remain in an account’s portfolio at the time you receive this report or that securities sold have not been repurchased. The securities discussed may not represent an account’s entire portfolio and, in the aggregate, may represent only a small percentage of an account’s portfolio holdings. The performance attribution presented is of a representative account from Aristotle Boston’s Small Cap Equity Composite. The representative account is a discretionary client account which was chosen to most closely reflect the investment style of the strategy. The criteria used for representative account selection is based on the account’s period of time under management and its similarity of holdings in relation to the strategy. It should not be assumed that any of the securities transactions, holdings or sectors discussed were or will be profitable, or that the investment recommendations or decisions Aristotle Boston makes in the future will be profitable or equal the performance of the securities discussed herein. Aristotle Boston reserves the right to modify its current investment strategies and techniques based on changing market dynamics or client needs. Recommendations made in the last 12 months are available upon request.
Returns are presented gross and net of investment advisory fees and include the reinvestment of all income. Gross returns will be reduced by fees and other expenses that may be incurred in the management of the account. Net returns are presented net of actual investment advisory fees and after the deduction of all trading expenses.
Effective January 1, 2022, the Aristotle Small Cap Equity Composite has been redefined to exclude accounts with meaningful industry-specific restrictions or substantial values-based screens hampering implementation of the small cap strategy.
Effective January 1, 2022, the Russell 2000 Value Index was removed as the secondary benchmark for the Aristotle Capital Boston Small Cap Equity strategy.
All investments carry a certain degree of risk, including the possible loss of principal. Investments are also subject to political, market, currency and regulatory risks or economic developments. International investments involve special risks that may in particular cause a loss in principal, including currency fluctuation, lower liquidity, different accounting methods and economic and political systems, and higher transaction costs.
These risks typically are greater in emerging markets. Securities of small‐ and medium‐sized companies tend to have a shorter history of operations, be more volatile and less liquid. Value stocks can perform differently from the market as a whole and other types of stocks. The material is provided for informational and/or educational purposes only and is not intended to be and should not be construed as investment, legal or tax advice and/or a legal opinion. Investors should consult their financial and tax adviser before making investments.
The opinions referenced are as of the date of publication, may be modified due to changes in the market or economic conditions, and may not necessarily come to pass.
Aristotle Capital Boston, LLC is an independent investment adviser registered under the Investment Advisers Act of 1940, as amended. Registration does not imply a certain level of skill or training. More information about Aristotle Boston, including our investment strategies, fees and objectives, can be found in our Form ADV Part 2, which is available upon request.
Performance Disclosures
Sources: SS&C Advent, Russell Investments
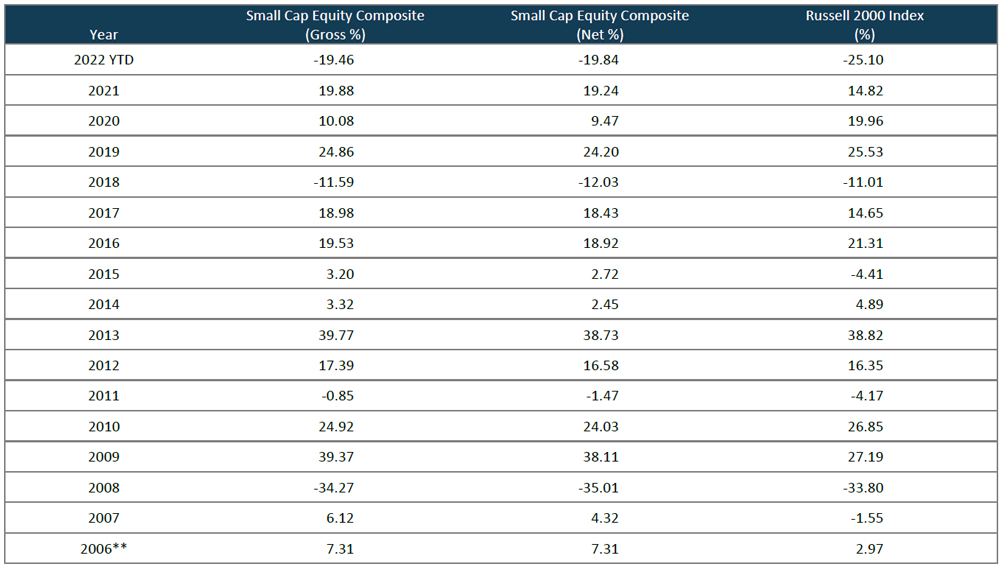
Composite returns for periods ended September 30, 2022 are preliminary pending final account reconciliation.
*The Aristotle Small Cap Equity Composite has an inception date of November 1, 2006 at a predecessor firm. During this time, Jack McPherson and Dave Adams had primary responsibility for managing the strategy. Performance starting January 1, 2015 was achieved at Aristotle Boston.
**For the period November 2006 through December 2006.
Past performance is not indicative of future results. Performance results for periods greater than one year have been annualized.
Effective January 1, 2022, the Aristotle Small Cap Equity Composite has been redefined to exclude accounts with meaningful industry-specific restrictions or substantial values-based screens hampering implementation of the small cap strategy.
Effective January 1, 2022, the Russell 2000 Value Index was removed as the secondary benchmark for the Aristotle Capital Boston Small Cap Equity strategy.
Returns are presented gross and net of investment advisory fees and include the reinvestment of all income. Gross returns will be reduced by fees and other expenses that may be incurred in the management of the account. Net returns are presented net of actual investment advisory fees and after the deduction of all trading expenses.
Aristotle Capital Boston, LLC is an independent investment adviser registered under the Investment Advisers Act of 1940, as amended. Registration does not imply a certain level of skill or training. More information about Aristotle Boston, including our investment strategies, fees and objectives, can be found in our Form ADV Part 2, which is available upon request. ACB-2210-19
The Russell 2000® Index measures the performance of the small cap segment of the U.S. equity universe. The Russell 2000 Index is a subset of the Russell 3000® Index representing approximately 10% of the total market capitalization of that index. It includes approximately 2000 of the smallest securities based on a combination of their market cap and current index membership. The Russell 2000 Growth® Index measures the performance of the small cap companies located in the United States that also exhibit a growth probability. The Russell 2000 Value® Index measures the performance of the small cap companies located in the United States that also exhibit a value probability. The Russell 1000® Index measures the performance of the large cap segment of the U.S. equity universe. The Russell 1000 Index is a subset of the Russell 3000® Index, representing approximately 90% of the total market capitalization of that index. It includes approximately 1,000 of the largest securities based on a combination of their market capitalization and current index membership. The volatility (beta) of the composite may be greater or less than the benchmarks. It is not possible to invest directly in these indices.