FOR PRESENTATION TO MERRILL LYNCH WEALTH MANAGEMENT FINANCIAL ADVISORS ONLY
Markets Review
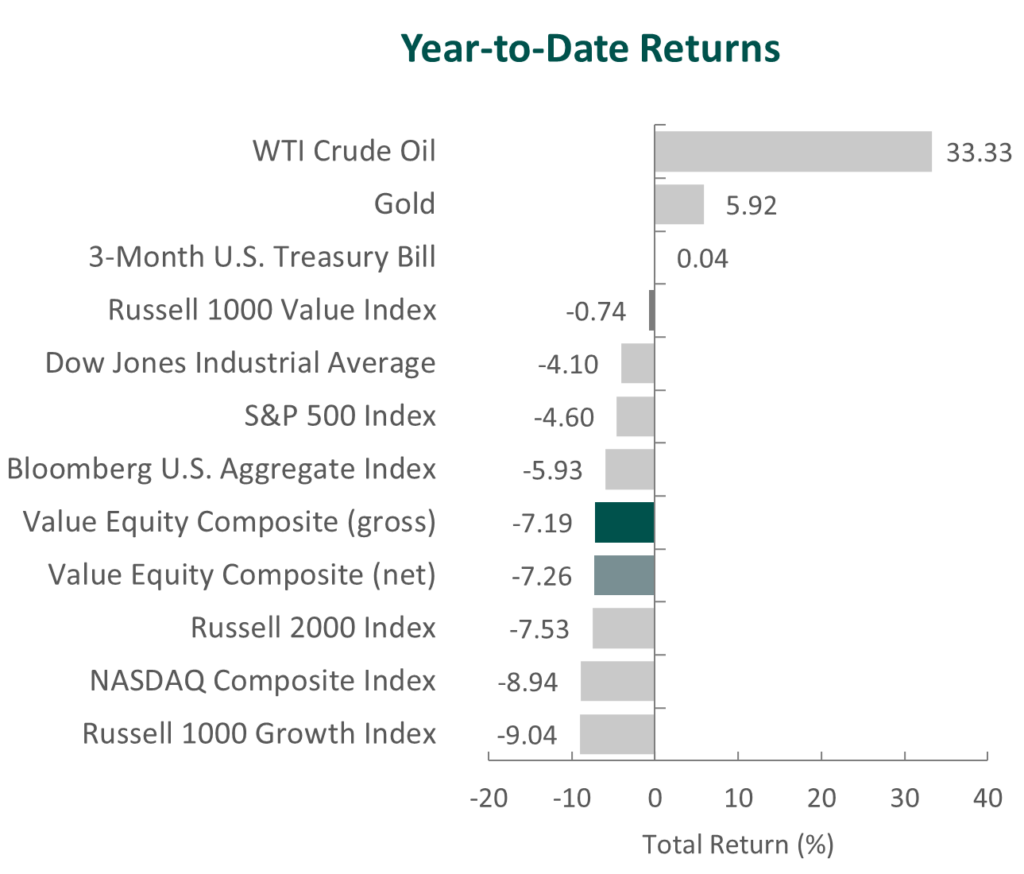
The U.S. equity market finished in the red, ending seven consecutive quarters of positive performance. Overall, the S&P 500 Index fell 4.60% during the period. Concurrently, the Bloomberg U.S. Aggregate Bond Index dropped 5.93% for the quarter. In terms of style, the Russell 1000 Value Index outperformed its growth counterpart by 8.30% during the quarter.
Sources: SS&C Advent, Bloomberg
Past performance is not indicative of future results. Aristotle Value Equity Composite returns are presented gross and net of investment advisory fees and include the reinvestment of all income. Aristotle Capital Composite returns are preliminary pending final account reconciliation. Please see important disclosures at the end of this document.
On a sector basis, seven out of eleven sectors within the Russell 1000 Value Index finished lower for the quarter, with Consumer Discretionary, Information Technology and Real Estate posting the largest declines. The strongest performers were Energy, Materials and Utilities.
On the economic front, the labor market continued to improve and inflation continued to rise, resulting in tighter monetary policy. Specifically, the unemployment rate continued its descent, falling to 3.8%, while the CPI rose 7.9% — the fastest pace of annual inflation in 40 years – amid increases in gasoline, food and housing rental prices. Inflation remained at elevated levels due to factors such as supply-chain disruptions, a tight labor market and increasing commodity prices. In turn, the Federal Reserve (Fed) voted to raise the target for its benchmark federal funds rate by a quarter percentage point to a range of 0.25% to 0.50%, the first rate increase since 2018. Fed officials reiterated their mandate of achieving maximum employment and 2% inflation in the long run and expect that ongoing interest rate hikes will be needed. Additionally, the central bank ended its bond-buying program and will begin reducing its holdings of Treasury securities, agency debt and agency mortgage-backed securities.
Geopolitical tensions spiked as Russia’s invasion of Ukraine created a grave humanitarian crisis that also impacted world economies. An unprecedented level of sanctions has been placed on Russia by Western governments, paired with a disruption of commodity supplies – with oil at one point eclipsing $130 a barrel – and renewed tensions between the U.S. and China. Policymakers have thus acknowledged the likely continued upward pressure on inflation and adverse impact on global economic activity.
In corporate earnings, supply-chain disruptions, input price pressures and wage growth remained major talking points for management teams. Nevertheless, the S&P 500 constituents continued to push past pre-pandemic levels, reporting ~26% earnings growth since 2019, as businesses across a wide range of industries continued to benefit from strong demand.
Performance and Attribution Summary
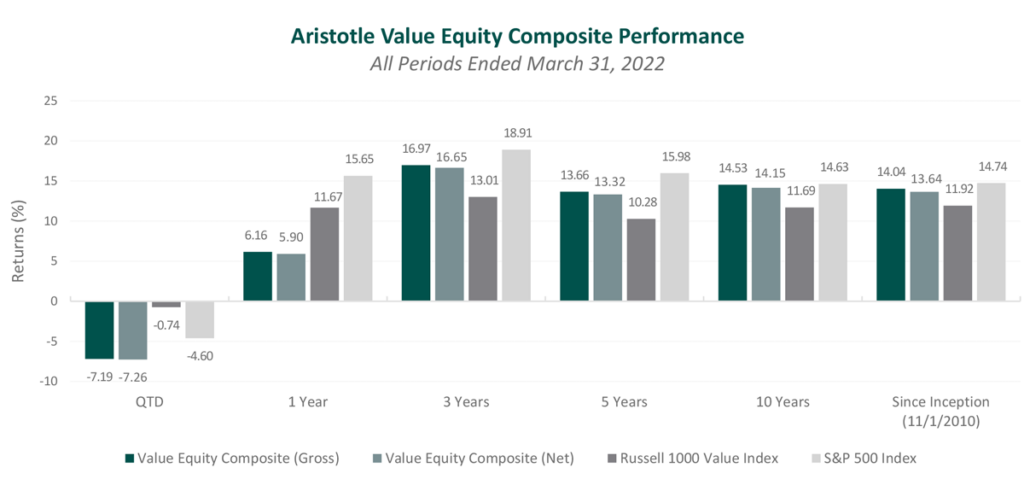
For the first quarter of 2022, Aristotle Capital’s Value Equity Composite posted a total return of -7.19% gross of fees (-7.26% net of fees), underperforming the -0.74% return of the Russell 1000 Value Index and the -4.60% return of the S&P 500 Index. Please refer to the table for detailed performance.
| Performance (%) | 1Q22 | 1 Year | 3 Years | 5 Years | 10 Years |
|---|---|---|---|---|---|
| Value Equity Composite (gross) | -7.19 | 6.16 | 16.97 | 13.66 | 14.53 |
| Value Equity Composite (net) | -7.26 | 5.90 | 16.65 | 13.32 | 14.15 |
| Russell 1000 Value Index | -0.74 | 11.67 | 13.01 | 10.28 | 11.69 |
| S&P 500 Index | -4.60 | 15.65 | 18.91 | 15.98 | 14.63 |
Source: FactSet
Past performance is not indicative of future results. Attribution results are based on sector returns, which are gross of investment advisory fees and include the reinvestment of all income. Please see important disclosures at the end of this document.
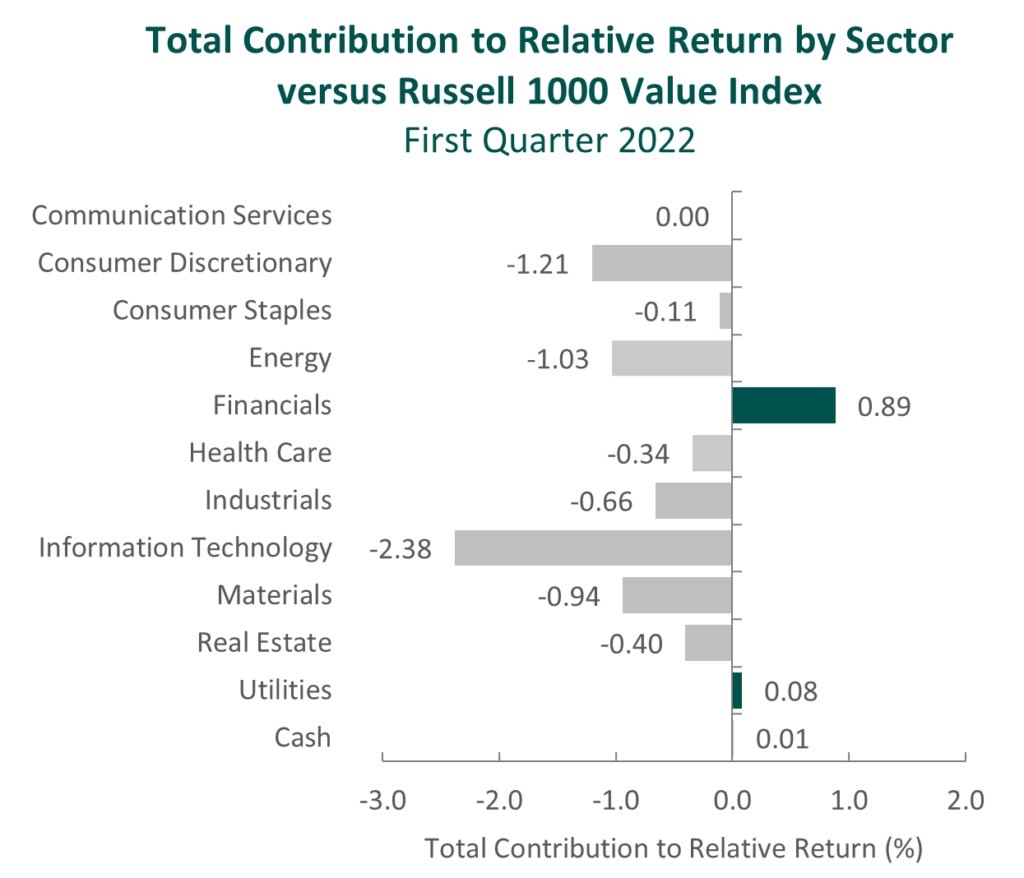
The portfolio’s underperformance relative to the Russell 1000 Value Index this quarter can be attributed to both security selection and allocation effects. Security selection in Information Technology and Materials and an underweight in Energy detracted the most from relative performance. Conversely, security selection in Financials, an overweight in Materials and an underweight in Communication Services contributed. (Relative weights are the result of bottom-up security selection.)
Contributors and Detractors for 1Q 2022
| Contributors | Detractors |
|---|---|
| Coterra Energy | Lennar |
| Corteva Agriscience | Adobe |
| Cincinnati Financial | ANSYS |
| Blackstone | Xylem |
| Atmos Energy | Sony |
Lennar, one of the nation’s largest homebuilders, was a primary detractor for the quarter. The combination of rising home values and higher mortgage rates in the U.S. has reduced homeownership affordability, causing concern of a slowdown in the housing market. While we recognize higher mortgage rates reduce affordability, we also recognize there is a supply deficit caused by nearly 10 years of new home construction lagging demand. Despite rising construction and land costs, Lennar’s profitability has increased, with the company’s year-over-year home sales gross margin expanding 190 basis points to 26.9%. First-quarter new orders and home deliveries also exceeded management’s expectations, and the firm raised its home delivery target for fiscal year 2022. With increased FREE cash flow as both margins and volume increased, Lennar continued to buy back shares, and the Board approved a 50% increase in the annual dividend, as well as an additional $2 billion stock repurchase authorization (over 8% of the current market cap). Lennar’s conservative capital allocation and prudent inventory management have allowed, and we believe will continue to allow, the company to overcome higher interest rates.
Corteva Agriscience, one of the world’s largest seed and crop protection companies, was a primary contributor for the quarter. Due to its respected brand and the value-added benefits of its patented seeds and crop protection solutions for farmers, Corteva has been able to more than offset input cost inflation with sustainable price increases. In addition, the company’s ongoing mix shift to higher-margin, premium products, a catalyst we previously identified, is aiding both sales and profit growth. Shares were likely also buoyed by the rise in crop prices. Market participants, perhaps eager to chase short-term trends, poured into the sector. At Aristotle Capital, we look past such gyrations and, as long-term investors, do not attempt to predict short-term changes in commodity prices. We remain excited about what we view to be high-quality characteristics and fundamental improvements that permeate Corteva’s business, not the least of which include its pricing power.
Recent Portfolio Activity
During the quarter, we sold our positions in Chubb, East West Bancorp, Johnson Controls and Walgreens Boots Alliance and invested in Atmos Energy, Blackstone, Oshkosh and Xcel Energy.
Although we were more active than normal this quarter, we want to stress that this is not a reaction to the current economic conditions. All portfolio activity is a reflection of our underlying investment philosophy and process.
| Buys | Sells |
|---|---|
| Atmos Energy | Chubb |
| Blackstone | East West Bancorp |
| Oshkosh | Johnson Controls |
| Xcel Energy | Walgreens Boots Alliance |
Our investment in Chubb began in the fourth quarter of 2015, shortly after ACE Limited announced it would acquire the Chubb Corporation, creating the largest global property and casualty insurance company by underwriting income. During our nearly seven-year holding period, the company’s combination progressed leading to the realization of main catalysts we had identified. These included cost savings, broadened product offerings and an expanded customer base, as well as enhanced distribution capabilities and improved pricing due to scale. In addition, Chubb successfully grew its profitable high-net-worth personal lines. While we still consider Chubb to be a high-quality business, few catalysts remain after what was, in our opinion, a remarkable run of successful business execution. As such, we decided to step aside in favor of what we believe to be a more optimal investment in Blackstone.
We purchased East West Bancorp in the third quarter of 2017; however, our history with the business stretches back further having twice previously invested. Companies we consider to be high-quality like East West tend to remain high quality, and we have long admired the business for its uniqueness among the otherwise homogenous U.S. banking industry. Its dominant market share built over generations in Asian communities – and difficult-to-replicate experience due to culture, geography and business practices – create distinct competitive advantages in our view. During our most recent holding period, the bank achieved sustained loan growth, a catalyst we identified, through its continued leadership position as the financial “bridge” for customers doing business in the U.S. and China. Moreover, East West also realized market share gains in its headquarters state of California. With these catalysts nearing completion, we decided to exit our investment to fund the purchase of Oshkosh. As always, we will continue to study East West and, in the future, may once again find an opportunity to be investors.
As investors since the fourth quarter of 2017, we have enjoyed a front-row view of the large transformation that has taken place at Johnson Controls. Once a multi-industrial corporation, the company successfully turned itself into a pure-play buildings solutions and technology provider. Catalysts we previously identified for Johnson Controls included synergies following its merger with Tyco International, which provides fire safety and building security products, as well as benefits from its separation of non-building-focused businesses, such as automotive seating and batteries. With all catalysts in sight now nearing completion, and Johnson Controls now a better business for it – with higher recurring revenues and lower capital intensity – we decided to exit our investment to help fund the purchases of Xcel Energy and Atmos Energy.
We first invested in Walgreens Boots Alliance in early 2013. Over our holding period, Walgreens merged with U.K.-based Boots Alliance, establishing itself as a global leading retail pharmacy chain. CEO Stefano Pessina set the company on a path of pursuing strategic partnerships (as opposed to vertical integration deals) to increase store traffic and to, over time, transform the business into a neighborhood health destination around a more modern pharmacy. Using its strong FREE cash flow generation, the company ramped up its investments in technology, aiming to accelerate the digitalization of health information. Mr. Pessina was not successful, however, at turning around the firm’s U.S. retail segment and had to deal with increasing prescription drug reimbursement pressures. He stepped down as CEO in 2020, and in 2021, Roz Brewer took the reins of the firm. We admire Ms. Brewer’s impressive track record at companies that include Starbucks and Walmart (Sam’s Club). However, given management’s decision to divest core cash-generative businesses and redeploy capital to embryonic healthcare startups, we prefer to step aside while we follow the company’s progress.
Atmos Energy Corporation
Headquartered in Dallas, Atmos Energy is the largest fully regulated natural gas-only utility in the U.S. It serves over three million distribution customers across eight states, primarily in the South. Approximately 70% of its revenue comes from Texas, where it owns one of the largest natural gas pipeline systems in the state.
High-Quality Business
Some of the quality characteristics we have identified for Atmos Energy include:
- Strong balance sheet and financial strength, perhaps most visible during 2021’s winter storm Uri when millions of Texans lost power. The significant spikes in natural gas prices stressed distributors, but Atmos handled over $2 billion of incremental costs with little long-term impact;
- Experienced and shareholder-friendly management team, as demonstrated by 38 consecutive years of dividend increases; and
- Attractive demographics and favorable regulatory environments in the states where it operates.
Attractive Valuation
Given our estimates of higher normalized earnings and dividend payments, we believe shares of Atmos Energy are trading at a discount relative to our estimate of their intrinsic value.
Compelling Catalysts
Catalysts we have identified for Atmos Energy, which we believe will cause its stock price to appreciate over our three- to five-year investment horizon, include:
- Old pipes and aging infrastructure, coupled with a growing population, have created a large backlog of safety and maintenance projects – completion of which should drive earnings growth and steady dividend increases. Updates should both increase reliability as well as the value of Atmos Energy’s assets, enhancing profit levels permitted by regulators;
- Well positioned to source low-cost natural gas from prolific basins in Texas to its distribution network, helping to keep customer prices down and economically favorable relative to other sources of energy; and
- Advantageous regulatory environment should continue to support rate adjustments so that revenues are earned on capital projects within six to 12 months.
Blackstone, Inc.
Founded by its current CEO Stephen Schwarzman and Pete Peterson in 1985, Blackstone is one of the largest alternative asset managers in the world, with more than $880 billion of assets under management (AUM). The firm creates and manages investment vehicles that span asset classes globally and serve both institutional clients as well as high-net-worth individuals. Its core business segments include Real Estate (34% of fee-earning AUM), Credit and Insurance (31%), Private Equity (24%), and Hedge Fund Solutions (11%).
Blackstone has leveraged its broad product portfolio and enviable investment performance to not only raise substantial amounts of capital but also maintain its reputation as a one-stop shop for investors looking to gain exposure to alternative assets. In contrast to traditional asset managers that rely on investor inaction to keep redemption rates low, the products offered by alternative asset managers typically have lockup periods that prevent redemptions for a substantial amount of time (often 10+ years).
High-Quality Business
Some of the quality characteristics we have identified for Blackstone include:
- Reputable management team that has produced an admirable track record of investment performance and demonstrated its ability to raise capital (the firm is now 9x larger since its 2007 IPO);
- Stable client base and sticky asset base with 73% of its capital locked up for over 10 years; and
- Significant scale and strong brand that provides a myriad of advantages, including for distribution and new product launches.
Attractive Valuation
Based on our estimates of normalized earnings, we believe shares of Blackstone are offered at a discount relative to our estimate of intrinsic value. It is our view that current valuation does not appropriately reflect our estimated future levels of fee-based revenue.
Compelling Catalysts
Catalysts we have identified for Blackstone, which we believe will cause its stock price to appreciate over our three- to five- year investment horizon, include:
- Increased fee-based revenue as dry powder committed capital that has yet to be invested is deployed. As of the fourth quarter of 2021, there was a total of $136 billion in dry powder across the firm;
- Given its scale and sustained investment prowess, Blackstone is uniquely positioned to benefit from the secular shift in investor allocation away from traditional managers and toward less liquid and higher expected return strategies in the alternative asset management sector; and
- Further penetration in the retail and private wealth channel, a segment of investors that has historically been excluded from participating in alternative assets. Blackstone has a first-mover advantage in providing institutional-quality products across its expanding distribution teams that focus on financial advisors.
Oshkosh Corporation
Founded in 1917 and based in its namesake Oshkosh, Wisconsin, Oshkosh is a prominent producer of specialty trucks and access equipment. It designs and manufactures products such as aerial lifts, military vehicles, fire trucks, garbage trucks and cement mixers. The business generated $7.9 billion in revenue in 2021 and operates in four segments: Access Equipment (40% of revenue), Defense (32%), Fire & Emergency (16%) and Commercial (12%).
Oshkosh is typically a North American market share leader in its respective equipment types and supplies a wide swath of industries and end customers. For instance, it is the global leader in aerial work platforms through its JLG brand. It is also the largest light defense truck supplier to the U.S military, with its Joint Light Tactical Vehicle (JLTV) chosen to replace the Humvee in 2015.
We had previously owned Oshkosh in our Value Equity portfolios for the better part of a decade. As long-time admirers of the company’s quality characteristics, and through our diligent process continuing to closely follow as management creates ways to improve, we have once again found an opportunity to be investors.
High-Quality Business
Some of the quality characteristics we have identified for Oshkosh include:
- Pricing power stemming from its leading market share positions in nearly every business segment, vital nature of its products and industry concentration;
- Diversified product line and customer base, as well as high barriers to entry in many of its businesses, such as fire trucks, aircraft rescue vehicles and defense; and
- Consistent positive FREE cash flow generation, even during the 2008 financial crisis when most of its segments faced the steepest downturn in a generation.
Attractive Valuation
Through market share gains, we expect operating margins and FREE cash flow to be higher on a normalized basis. Thus, we believe Oshkosh shares are offered at a discount to our estimates of the company’s intrinsic value.
Compelling Catalysts
Catalysts we have identified for Oshkosh, which we believe will cause its stock price to appreciate over our three- to five-year investment horizon, include:
- Further innovation and technological improvements, particularly in the electrification of its vehicles, which could drive additional demand;
- Continued rollout of its recently awarded U.S. Postal Service vehicle contract and market share gains for its JLG aerial work platforms;
- Increased international orders for its JLTV military trucks as countries around the world replace aging Humvee fleets. In addition, further development of its aftermarket business can help improve profitability; and
- Strong balance sheet can give management the ability to run a balanced capital allocation strategy that advances organic growth and returns cash to shareholders.
Xcel Energy, Inc.
Xcel Energy owns and operates four utilities serving 3.7 million electric customers and 2.1 million natural gas customers in eight states. Headquartered in Minneapolis, Minnesota, the firm generates $11.5 billion in annual revenue and owns infrastructure that ranges from nuclear power plants to wind farms.
The company has been a leader in renewable energy development among regulated utilities. At the end of 2020, 47% of the energy Xcel produced came from carbon-free sources, making it one of the foremost wind producers and renewable energy providers in the U.S. It was also an early mover to announce (in December 2018) a 100% carbon free goal by 2050. The company plans to invest $26 billion in 2022-26, much of it going to renewable energy projects and electric grid infrastructure to support clean energy.
High-Quality Business
Some of the quality characteristics we have identified for Xcel Energy include:
- Consistent operator with a long history of rate base growth, fair customer rates, balance sheet strength, and appropriate operating and maintenance expenses;
- Presence in states with favorable regulatory environments that support the shift toward renewable energy generation, transmission and distribution; and
- Strong management team with demonstrated business acumen having at an early stage successfully positioned Xcel for the ongoing renewable energy transition.
Attractive Valuation
We believe Xcel Energy’s current stock price is offered at a discount to our determination of the company’s intrinsic value given our estimates for higher normalized earnings and dividend payments.
Compelling Catalysts
Catalysts we have identified for Xcel Energy, which we believe will cause its stock price to appreciate over our three- to five-year investment horizon, include:
- Xcel is well positioned to benefit from increased demand for clean energy, as its service territories have what we believe to be some of the best wind and solar resources in the country, and the states it serves are strong supporters of shifting from a heavy reliance on coal generation to renewables;
- Continue leading the clean energy transition by aggressively replacing its coal generated energy capacity in a cost-effective manner. Xcel has plans to develop >5GW of solar and wind, including both greenfield and repowering opportunities; and
- Capital spending to build out the electric transmission network will support the expansion of renewables in Xcel’s service territory and should result in earnings and dividend growth.
Conclusion
Performance for the first few months of 2022 has undoubtedly been disappointing. However, in both strong short-term periods and weak ones, we are resolute in our mantra — “not every quarter, not every year.” Down markets and short-term price swings are a natural part of investing. While issues such as inflation, interest rates, war and trade relations will certainly persist in the coming quarters, we remain focused on what, in our opinion, is analyzable. As such, while we are ever cognizant of the events and environment around us, we will always choose to instead concentrate on the long-term fundamentals of the businesses we study. We believe our approach of understanding companies’ earnings power from a normalized perspective, combined with our focus on high-quality, undervalued businesses that possess significant catalysts, is the best way to create lasting long-term value for our clients.
The opinions expressed herein are those of Aristotle Capital Management, LLC (Aristotle Capital) and are subject to change without notice. Past performance is not a guarantee or indicator of future results. This material is not financial advice or an offer to purchase or sell any product. You should not assume that any of the securities transactions, sectors or holdings discussed in this report were or will be profitable, or that recommendations Aristotle Capital makes in the future will be profitable or equal the performance of the securities listed in this report. The portfolio characteristics shown relate to the Aristotle Value Equity strategy. Not every client’s account will have these characteristics. Aristotle Capital reserves the right to modify its current investment strategies and techniques based on changing market dynamics or client needs. There is no assurance that any securities discussed herein will remain in an account’s portfolio at the time you receive this report or that securities sold have not been repurchased. The securities discussed may not represent an account’s entire portfolio and, in the aggregate, may represent only a small percentage of an account’s portfolio holdings. The performance attribution presented is of a representative account from Aristotle Capital’s Value Equity Composite. The representative account is a discretionary client account which was chosen to most closely reflect the investment style of the strategy. The criteria used for representative account selection is based on the account’s period of time under management and its similarity of holdings in relation to the strategy. Recommendations made in the last 12 months are available upon request.
Returns are presented gross and net of investment advisory fees and include the reinvestment of all income. Gross returns will be reduced by fees and other expenses that may be incurred in the management of the account. For example, a 0.5% annual fee deducted quarterly (0.125%) from an account with a ten-year annualized growth rate of 5.0% will produce a net result of 4.4%. Actual performance results will vary from this example.
The Russell 1000 Value® Index measures the performance of the large cap value segment of the U.S. equity universe. It includes those Russell 1000 Index companies with lower price-to-book ratios and lower expected growth values. The S&P 500® Index is the Standard & Poor’s Composite Index of 500 stocks and is a widely recognized, unmanaged index of common stock prices. The Russell 1000® Growth Index measures the performance of the large cap growth segment of the U.S. equity universe. It includes those Russell 1000 companies with higher price-to-book ratios and higher forecasted growth values. The Russell 2000® Index measures the performance of the small cap segment of the U.S. equity universe. The Russell 2000 Index is a subset of the Russell 3000® Index representing approximately 10% of the total market capitalization of that index. It includes approximately 2,000 of the smallest securities based on a combination of their market cap and current index membership. The Dow Jones Industrial Average® is a price-weighted measure of 30 U.S. blue-chip companies. The Index covers all industries except transportation and utilities. The NASDAQ Composite Index measures all NASDAQ domestic and international based common type stocks listed on The NASDAQ Stock Market. The NASDAQ Composite includes over 3,000 companies, more than most other stock market indexes. The Bloomberg U.S. Aggregate Bond Index is an unmanaged index of domestic investment grade bonds, including corporate, government and mortgage-backed securities. The WTI Crude Oil Index is a major trading classification of sweet light crude oil that serves as a major benchmark price for oil consumed in the United States. The 3-Month U.S. Treasury Bill is a short-term debt obligation backed by the U.S. Treasury Department with a maturity of three months. Consumer Price Index is a measure of the average change over time in the prices paid by urban consumers for a market basket of consumer goods and services. The volatility (beta) of the Composite may be greater or less than its respective benchmarks. It is not possible to invest directly in these indices.
Aristotle Capital Management, LLC is an independent registered investment adviser under the Advisers Act of 1940, as amended. Registration does not imply a certain level of skill or training. More information about Aristotle Capital, including our investment strategies, fees and objectives, can be found in our ADV Part 2, which is available upon request. ACM-2204-23-MLFA
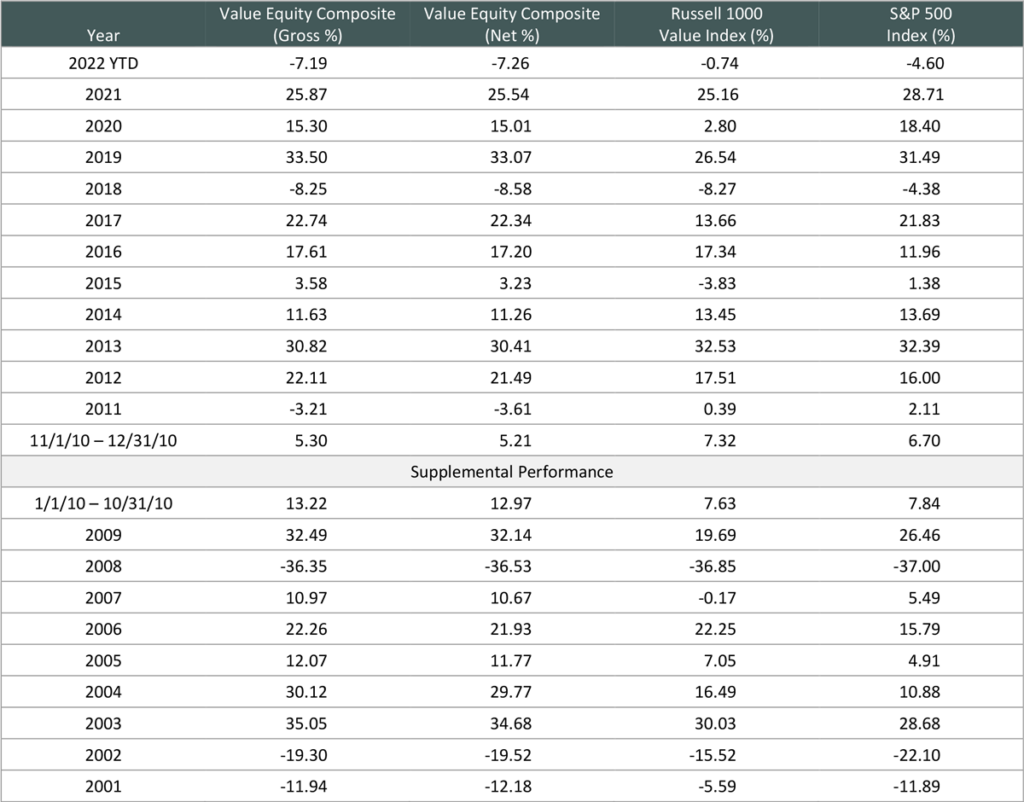
Composite returns for all periods ended March 31, 2022 are preliminary pending final account reconciliation.
Past performance is not indicative of future results. Performance results for periods greater than one year have been annualized. Returns presented are gross and net of investment advisory fees and include the reinvestment of all income. The Aristotle Value Equity strategy has an inception date of November 1, 2010; however, the strategy initially began at Mr. Gleicher’s predecessor firm in October 1997. A supplemental performance track record from January 1, 2001 through October 31, 2010 is provided above. The returns are based on two separate accounts and performance results are based on custodian data. During this time, Mr. Gleicher had primary responsibility for managing the two accounts. Mr. Gleicher began managing one account in November 2000 and the other December 2000.