(All MSCI index returns are shown net and in U.S. dollars unless otherwise noted.)
Markets Review
Sources: CAPS CompositeHubTM, Bloomberg
Past performance is not indicative of future results. Aristotle Global Equity Composite returns are presented gross and net of investment advisory fees and include the reinvestment of all income. Gross returns will be reduced by fees and other expenses that may be incurred in the management of the account. Net returns are presented net of model fees. Net returns are calculated by subtracting a model fee of 0.50% on an annual basis or 0.04167% on a monthly basis. Aristotle Capital Composite returns are preliminary pending final account reconciliation. Please see important disclosures at the end of this document.
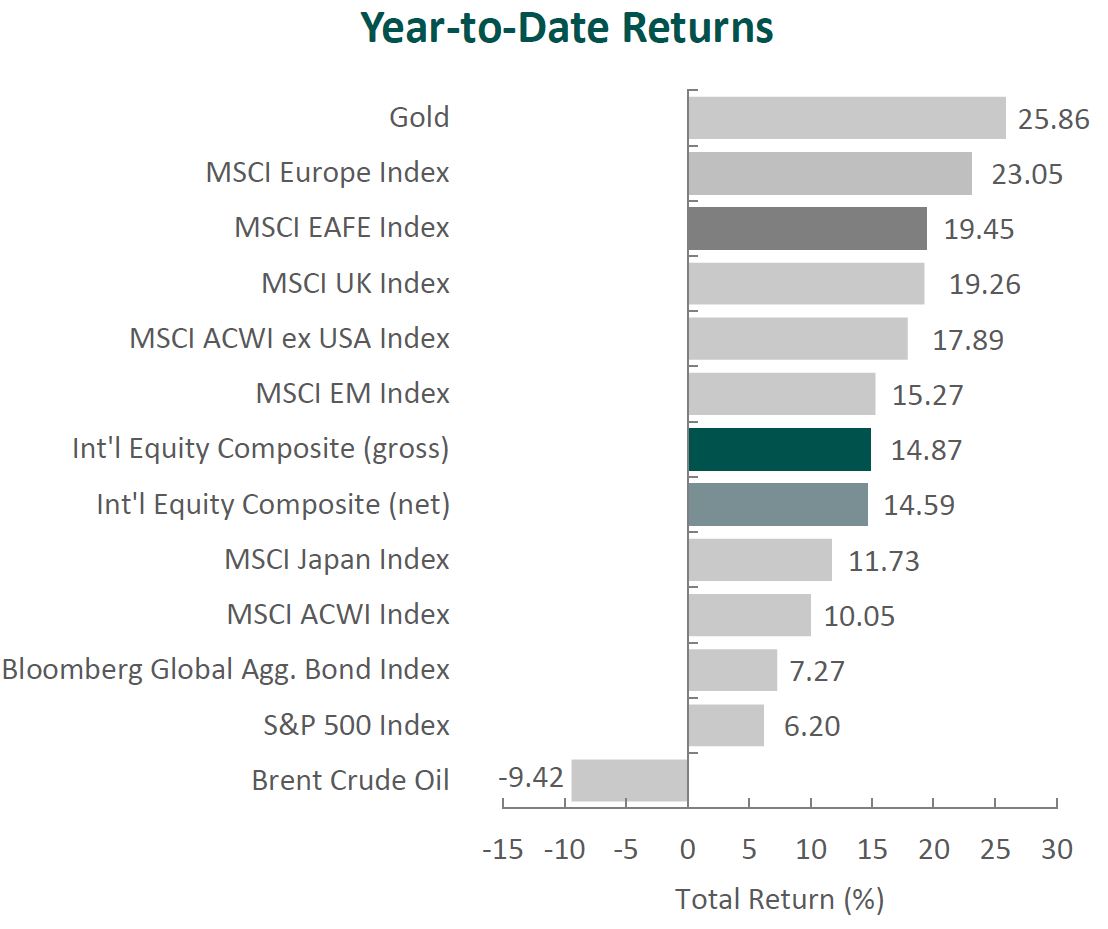
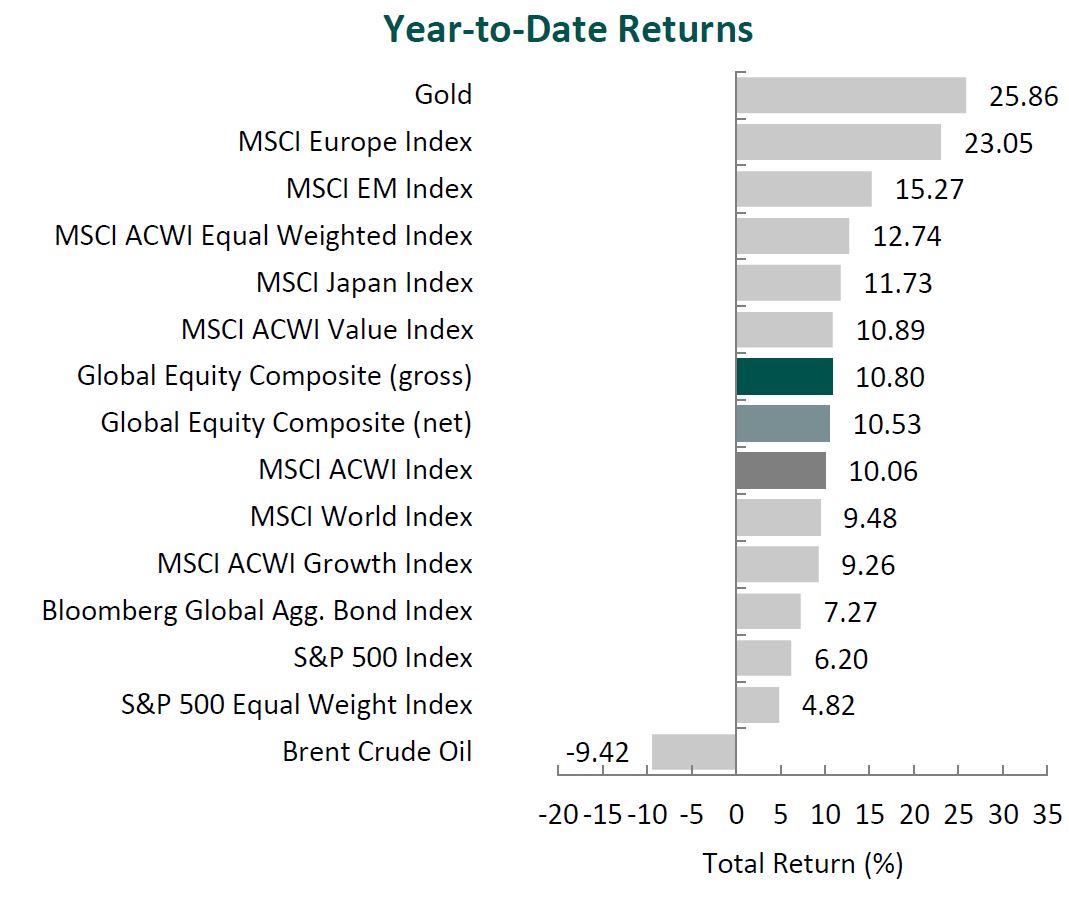
Global equity markets rallied, with the MSCI ACWI Index advancing 11.53% in the second quarter. Concurrently, global fixed income gained ground, as the Bloomberg Global Aggregate Bond Index rose 4.52%. Value stocks significantly lagged growth stocks over the quarter, with the MSCI ACWI Value Index underperfoming the MSCI ACWI Growth Index by 11.42%.
Asia/Pacific ex-Japan and Emerging Markets were the strongest regions, while Europe and Japan, though posting double-digit returns, increased the least. On a sector basis, nine out of the eleven sectors within the MSCI ACWI Index finished higher, with Information Technology, Communication Services and Industrials rising the most. Meanwhile, Energy and Health Care finished with negative returns.
Trade policy remained a focal point. In early April, President Trump introduced a universal 10% import tariff, as well as reciprocal tariffs on dozens of countries, as part of “Liberation Day.” Roughly a week later, and to encourage the start of negotiations, a 90-day pause on reciprocal tariffs was enacted for almost all countries. Later in the quarter, the U.S. and U.K. finalized the Economic Prosperity Deal, which included expanding American access to British markets and lowering tariffs on the first 100,000 of U.K. autos entering the U.S. each year. Meanwhile, negotiations continued with the EU, Japan, Canada and India. After escalating, trade tensions with China eased somewhat; however, considerable tariffs and other trade policy disputes remain for both countries as negotiations continue.
While the full impact of trade policy changes is still uncertain, major economies—including the U.S., U.K., eurozone and Japan—experienced downward revisions to 2025 GDP growth projections. Additionally, inflation trends were notably mixed during the quarter. In the U.S., changes in the Consumer Price Index (CPI) remained stable at approximately 2.4% year-over-year, while annual inflation in the eurozone fell below the European Central Bank’s 2% target. In contrast, the U.K. saw its CPI rise 3.4% year-over-year, with policymakers warning that ongoing geopolitical tensions may continue to drive inflation higher by disrupting oil prices and global supply chains. Japan also experienced elevated inflation, with core CPI rising 3.7% year-over-year—its fastest pace since January of 2023.
Amid a backdrop of macroeconomic uncertainty and mixed economic data, central bank policy decisions generally aligned with expectations. Monetary authorities in the U.S. and Japan held their key interest rates steady, while their counterparts in the U.K. and eurozone implemented rate cuts.
In geopolitics, tensions in the Middle East escalated sharply during the quarter, with Israel and Iran engaging in direct missile exchanges—their most overt confrontation in decades. A succession of precision strikes on key Iranian figures and military sites, as well as U.S. airstrikes on nuclear infrastructure, further fueled fears of a broader regional conflict. However, after 12 days of war, a ceasefire was reached late in the quarter, easing immediate tensions but leaving uncertainty over its durability. In Europe, Russian forces entered eastern Ukraine in the Dnipropetrovsk region for the first time in three years. While the two sides engaged in a second round of negotiations and completed prisoner exchanges, prospects of a material advancement toward a ceasefire remain unclear. Despite the heightened geopolitical events, Brent crude oil fell 9.5% during the quarter.
Performance and Attribution Summary
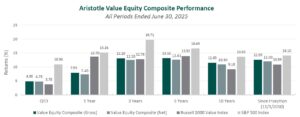
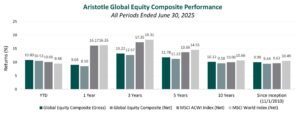
For the second quarter of 2025, Aristotle Capital’s Global Equity Composite posted a total return of 9.58% gross of fees (9.45% net of fees), underperforming the MSCI ACWI Index, which returned 11.53%, and the MSCI World Index, which returned 11.47%. Please refer to the table below for detailed performance.
| Performance (%) | 2Q25 | YTD | 1 Year | 3 Years | 5 Years | 10 Years | Since Inception* |
|---|---|---|---|---|---|---|---|
| Global Equity Composite (gross) | 9.58 | 10.80 | 9.04 | 13.22 | 11.78 | 10.12 | 9.98 |
| Global Equity Composite (net) | 9.45 | 10.53 | 8.50 | 12.67 | 11.23 | 9.58 | 9.44 |
| MSCI ACWI Index (net) | 11.53 | 10.06 | 16.17 | 17.35 | 13.66 | 10.00 | 9.62 |
| MSCI World Index (net) | 11.47 | 9.48 | 16.26 | 18.31 | 14.55 | 10.66 | 10.49 |
Source: FactSet
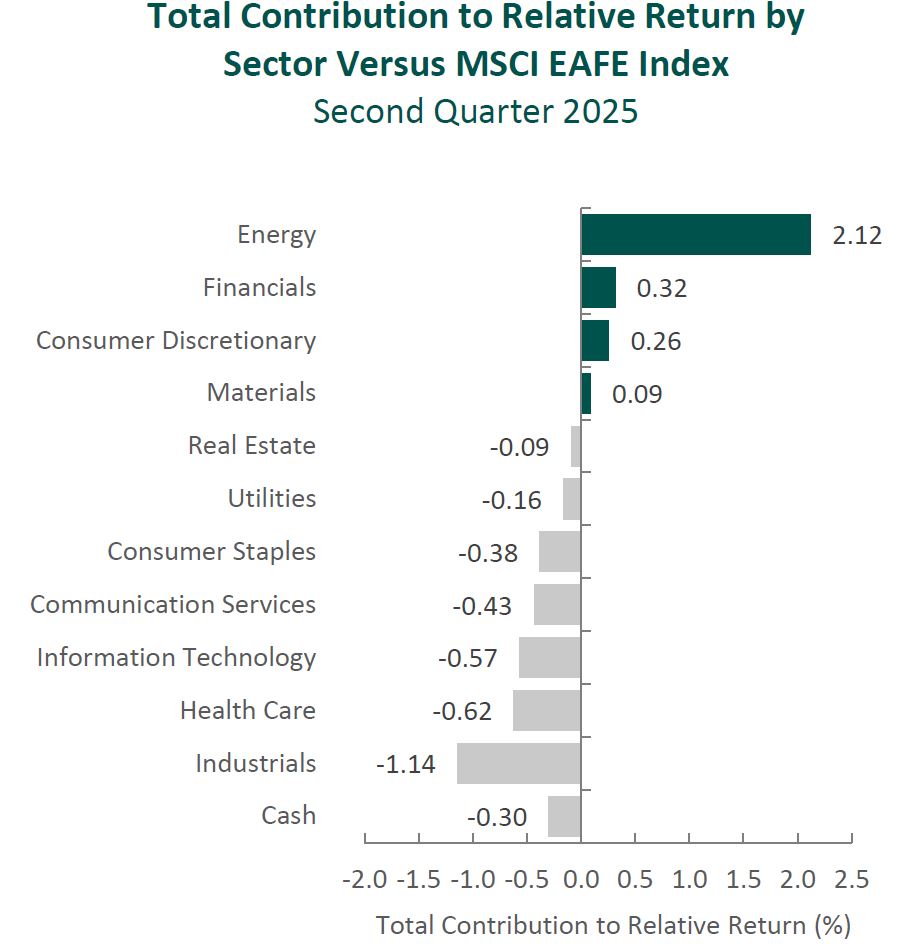
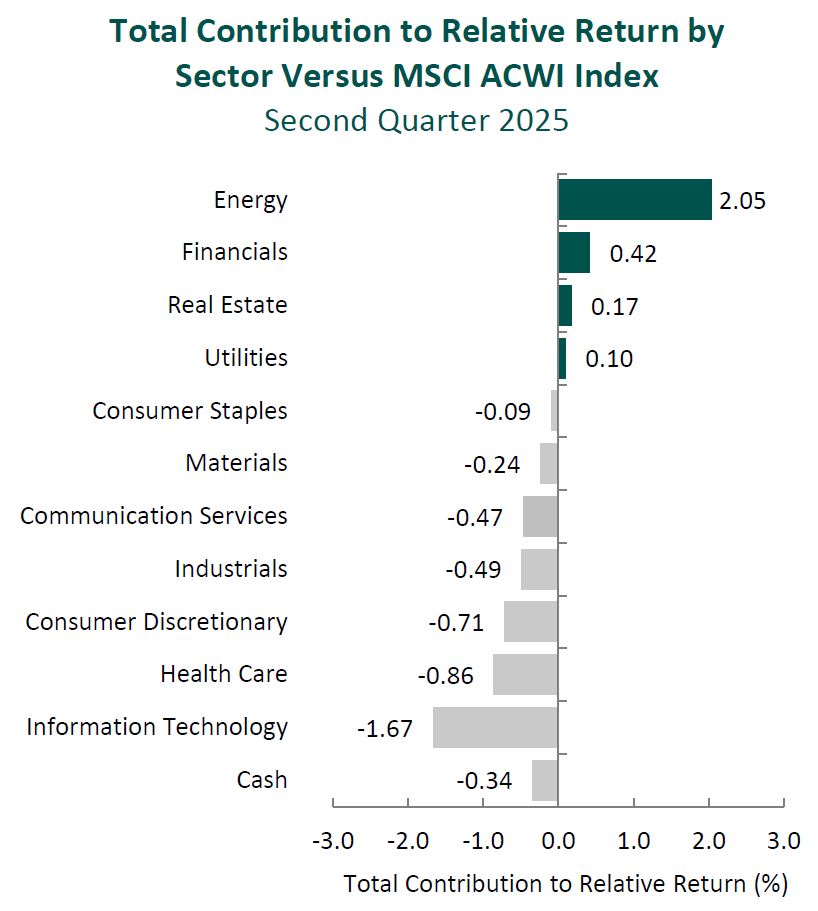
Past performance is not indicative of future results. Sector attribution shows how much of a portfolio’s overall return is directly attributable to stock selection and asset allocation decisions within the portfolio, highlighting which sectors contributed or detracted to the total return. Attribution includes the reinvestment of income. Attirbution is presented gross of fees and does not include the deduction of all fees and expenses that a client or investor has paid or would have paid. Please refer to the gross and net composite returns included within to understand the overall impact of fees.
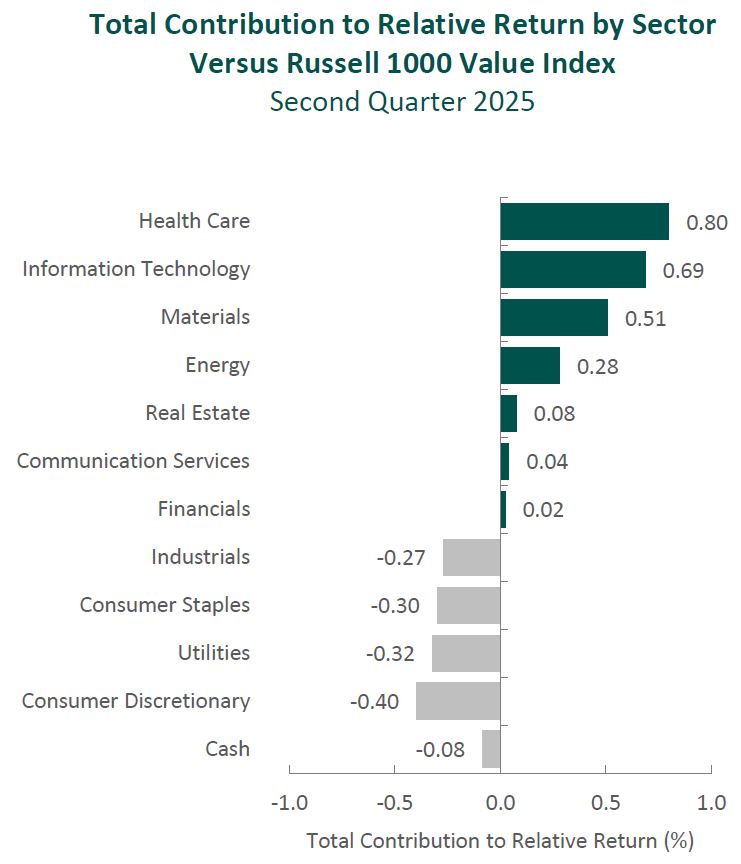
From a sector perspective, the portfolio’s underperformance relative to the MSCI ACWI Index can be attributed to allocation effects, while security selection had a slightly positive overall impact. An underweight in Information Technology and security selection in Consumer Discretionary and Information Technology detracted the most from the portfolio’s relative performance. Conversely, security selection in Energy and Financials and an overweight in Industrials contributed to relative return.
Regionally, both security selection and allocation effects were responsible for the portfolio’s underperformance relative to the MSCI ACWI Index. Security selection in Europe and Japan detracted the most from relative performance, while security selection in North America and an overweight in Japan contributed.
Contributors and Detractors for 2Q 2025
| Relative Contributors | Relative Detractors |
|---|---|
| Cameco | Amgen |
| Microchip Technology | Lennar |
| Nemetschek | Jazz Pharmaceuticals |
| Erste Group Bank | Alcon |
| Pan Pacific International | TotalEnergies |
Amgen, the biopharmaceutical company, was the largest detractor for the quarter. While the company’s branded drugs continued to advance (a previously identified catalyst), with cholesterol medicine Repatha, osteoporosis treatment Evenity and bone-strengthening drug Prolia all growing sales in the double digits, concerns surrounding potential tariff impacts, tax reform and pressure on drug prices weighed on shares. We believe it is too early to assess the full impact of these macro uncertainties and are confident in Amgen’s demonstrated ability to adapt through evolving policy and pricing dynamics. The company reaffirmed its long-term commitment to domestic manufacturing and innovation through its upcoming $2 billion expansions in Ohio and North Carolina, building on more than $5 billion in U.S. operational investments since 2017. Furthermore, Amgen continued to advance its robust pipeline, as its 1L bemarituzumab (bema) phase 3 trial for gastric cancer met its primary endpoint, and MariTide, the company’s weight-loss drug, demonstrated strong efficacy in phase 1 and 2 trials. MariTide, which could offer more convenient monthly dosing compared to daily or weekly regimens, showed promising early results, though tolerability will be an important focus heading into phase 3. Management noted that modified dose ramp-up strategies may help mitigate these effects. Despite near-term pressures, we remain encouraged by Amgen’s continued market share gains across key therapies and the potential to enhance the company’s competitiveness and resilience in a dynamic healthcare landscape.
Alcon, a global leader in eye care, was one of the largest detractors during the quarter. Aside from its earnings report, there was little material news, and we did not view anything in the report as affecting the company’s long-term fundamentals. While quarterly updates can influence sentiment, our focus remains on the strength and quality of the business. Alcon operates in a resilient, oligopolistic industry with high barriers to entry and recurring revenue streams tied to its large installed base of cataract surgery systems. It also continues to innovate across product categories, including its premium intraocular lens portfolio (e.g., PanOptix, Vivity), ultra-premium daily contact lenses (e.g., Dailies Total1) and over-the-counter products, such as Systane for dry eyes. Since its spinoff from Novartis in 2019, the company has also demonstrated greater agility in R&D, commercial execution and capital allocation—catalysts we previously identified. More broadly, we believe Alcon’s ability to strengthen its partnerships with eye care professionals and broaden access to underutilized premium technologies makes the company uniquely positioned to benefit from an aging population, increased access to eye care in emerging markets, and rising awareness and diagnosis of chronic dry eye conditions.
Cameco, one of the world’s largest uranium producers, was the biggest contributor during the quarter. The company continued to demonstrate the hallmarks of a high-quality business: a long-duration contract portfolio, disciplined capital allocation and resilience in the face of operational disruption. Despite a nearly 30% decline in uranium spot prices year-over-year, Cameco reported higher average realized prices under its contracted sales—underscoring its pricing power and long-term customer relationships. The company maintained stable operations despite a temporary production pause at the Inkai joint venture and wildfires in northern Saskatchewan. Meanwhile, management continued to deepen its exposure to the nuclear fuel cycle through its Westinghouse unit, which expands its reach into reactor services and fuels. With rising global interest in nuclear energy for energy security and decarbonization, Cameco’s strong balance sheet, vertically integrated platform and ability to flex production volume (thereby controlling costs) remain important catalysts in our eyes.
Microchip Technology, the microcontroller (MCU) and analog semiconductor producer, was a top contributor for the quarter. After several quarters of underperformance driven by prolonged customer destocking, the company’s fundamentals began to improve meaningfully, as returning CEO Steve Sanghi’s turnaround plan is underway. Bookings showed signs of stabilization, supported by more balanced inventories across customers and distribution channels, as well as indications of recovering end-market demand. Operational execution also improved under the renewed leadership, with early benefits emerging from cost-saving initiatives—such as the closure of its Arizona wafer fabrication facility—and tighter inventory management. Microchip’s long-standing customer relationships and commitment to extended product lifecycles continue to support recurring revenue and reduce design-in risk. Combined with its consistent record of strong FREE cash flow generation and shareholder returns, this disciplined approach reinforces our conviction in the company’s ability to manage through industry cycles. Longer term, we believe Microchip remains well-positioned to gain share in 16- and 32-bit MCUs and areas including IoT, 5G infrastructure, autonomous vehicles and data centers.
Recent Portfolio Activity
| Buys | Sells |
|---|---|
| Capital One | PayPal Holdings |
| Uber | Rational |
During the quarter, we sold our positions in PayPal Holdings and Rational and invested in Capital One and Uber.
We first invested in PayPal, the online and mobile e-commerce payments company, in the third quarter of 2015. Over the past decade, we have admired PayPal’s ability to expand its unique and hard-to-replicate dual-sided network, even amid intensifying competition. In 2023, Alex Chriss succeeded Dan Schulman as CEO and refocused the company on profitable growth by enhancing the checkout experience and deepening user engagement, rather than emphasizing top-line expansion. Partnerships with Apple, J.P. Morgan, Amazon and Shopify support this shift, embedding PayPal more deeply across digital commerce ecosystems. Mr. Chriss has also prioritized higher-margin branded checkout while phasing out select Braintree deals that were unprofitable or contributed little to earnings. Braintree primarily serves large enterprise clients—such as Uber, Airbnb and Live Nation—through unbranded, custom-priced processing agreements. While these actions have moderated near-term revenue growth, we view them as a more disciplined and sustainable approach to long-term value creation. That said, we remain concerned about PayPal’s continued investment in its “One Platform” strategy, which includes expanding into offline and omnichannel payments—a direction that has shown limited success to date. While we will continue monitoring Mr. Chriss’s progress and the broader payments landscape, we ultimately determined PayPal was the most suitable candidate for sale in order to fund what we believe is a more compelling investment opportunity.
We first invested in Rational, the German-based global leader in commercial kitchen equipment, in May 2021. The company holds a dominant position in combi-steamers—advanced appliances that integrate steam and convection cooking, allowing professional kitchens to improve consistency, expand menu flexibility, reduce energy use and optimize cooking time in a single unit. During our holding period, Rational made meaningful progress across several catalysts, including deeper penetration of combi-steamers and cooking centers into kitchens still reliant on traditional appliances. The company also expanded its geographic footprint, especially in North America and Asia, where demand for automated and energy-efficient cooking solutions continues to rise. While we continue to view Rational as a high-quality business with attractive long-term prospects, we grew incrementally more cautious about its evolving competitive position. Additionally, Rational’s expansion into adjacent product categories, while strategically logical, introduced added complexity and some potential for product overlap. Given these considerations, we decided Rational was the optimal candidate for sale to fund what we believe is a more compelling investment in Uber.
Capital One Financial Corporation
Founded in 1988 and headquartered in McLean, Virginia, Capital One is one of the largest credit card issuers in the U.S. The company was spun out of Signet Financial in 1995 under the leadership of founder and current Chairman and CEO Richard Fairbank. Over the past three decades, Capital One has evolved from a monoline credit card lender into a diversified financial services firm offering a broad range of consumer and commercial banking products.
In 2025, Capital One completed its acquisition of Discover, becoming one of the only major U.S. banks to own and operate a credit card network. This should position the company to enhance its profitability by reducing its reliance on third-party networks (i.e., Visa and Mastercard) and reduce earnings volatility as fee-based revenue increases. The deal also advances Capital One’s efforts to attract high-spend, premium-tier customers. Products like Venture X—the firm’s premium travel rewards card—stand to benefit from the integration of Discover’s transaction data with Capital One’s advanced analytics capabilities. This combination enables more personalized offers, deeper customer engagement and targeted cross-selling across lending and deposit products, reinforcing a cycle of data-driven growth.
High-Quality Business
Some of the quality characteristics we have identified for Capital One include:
- A leading card platform with national brand recognition and a diversified customer base across geographies and credit tiers;
- Differentiated technology infrastructure: the only major U.S. bank operating fully in the public cloud, enabling real-time data processing, faster product iteration and cost efficiencies that are difficult for peers to replicate;
- A history of prudent underwriting and a disciplined credit culture developed through multiple economic and credit cycles; and
- Proven, long-tenured management team led by Richard Fairbank has demonstrated a long-term orientation and disciplined capital deployment across cycles.
Attractive Valuation
We believe shares of Capital One are attractively valued relative to our estimates of normalized earnings power. In our view, the market underappreciates the long-term value creation potential of the Discover integration, including enhanced payment economics and greater strategic control. In addition, Capital One’s ongoing shift toward higher-credit-tier customers and fee-based revenue—combined with its technology-enabled cost advantages—supports margin expansion and more durable earnings. Strong FREE cash flow generation provides ample flexibility to reinvest in growth while continuing to return capital to shareholders through buybacks and dividends.
Compelling Catalysts
Catalysts we have identified for Capital One, which we believe will cause its stock price to appreciate over our three- to five-year investment horizon, include:
- Successful integration of Discover’s network, enabling vertical payment processing and greater fee capture;
- Continued shift in customer mix toward higher credit tiers, driving more stable earnings and increased fee-based revenue;
- Utilization of cloud-based infrastructure and proprietary data to enhance underwriting, deliver personalized product offers and strengthen cross-sell opportunities across lending and deposits; and
- Increased market share in cards, driven by brand strength, customer loyalty and expanded co-brand partnerships with leading merchants that enhance customer engagement and distribution.
Uber Technologies, Inc.
Founded in 2009 and headquartered in San Francisco, California, Uber is a global technology platform that facilitates the movement of people, goods and services across a wide range of markets. What began as a simple ride-hailing app has evolved into a multi-segment leader operating in more than 70 countries, connecting millions of consumers, drivers, couriers and merchants worldwide.
Uber’s operations are organized into three primary business segments: Mobility, which includes ridesharing, car rentals and other personal transportation services (~45% of revenue); Delivery, which spans food, grocery, convenience and retail delivery through the Uber Eats platform (~50%); and Freight, its digital brokerage and logistics arm (~5%). These segments are built on a shared platform supported by real-time matching technology, global app penetration, strong network effects and one of the most recognized consumer brands globally—reflected in the familiar phrase, “I’ll call an Uber.”
High-Quality Business
Some of the quality characteristics we have identified for Uber include:
- Global scale and platform efficiency, underpinned by strong brand recognition and an asset-light, supply-led model that enables rapid expansion, high operating leverage and efficient capital deployment;
- Integrated, cross-segment ecosystem, where offerings like Uber One memberships drive customer activity and loyalty (i.e., the majority of gross delivery bookings come from members); and
- Market leadership across core categories, including approximately 70% market share in U.S. ridesharing, a strong #2 position in U.S. delivery, and leading positions in key international delivery markets, such as the U.K., France and Australia.
Attractive Valuation
Uber has scaled to sustainably FREE cash flow with continued progress on margin expansion driven by scale and disciplined cost control. Based on our analysis, shares of the company currently trade at a greater than 10% normalized Cash Flow Return on Economic Value, reflecting what we believe is meaningful upside potential. Uber’s strong balance sheet—with approximately $7 billion in cash—also provides flexibility to reinvest in growth, pursue strategic initiatives or return capital to shareholders.
Compelling Catalysts
Catalysts we have identified for Uber, which we believe will cause its stock price to appreciate over our three- to five-year investment horizon, include:
- Increased profitability and stronger FREE cash flow generation as enhanced cross-promotion between Mobility and Delivery deepens user engagement and significantly lowers customer acquisition costs;
- Further partnerships—such as with taxi fleets, travel platforms and autonomous vehicle companies—should continue to expand Uber’s reach and reduce supply costs; and
- Continued expansion in non-urban markets, with new features like Uber Reserve broadening addressable demand and improving service in suburban areas.
Conclusion
As the world continues to navigate shifting trade dynamics, complex monetary and fiscal policy decisions, and heightened geopolitical uncertainty, the broader implications for the global economy remain unclear. While we are mindful of these macroeconomic forces, we do not attempt to predict their timing or short-term market impact. Instead, we anchor our investment approach in what we believe to be more reliable and enduring: the fundamentals of individual businesses and their long-term potential. By concentrating on high-quality companies with management teams we consider proven, we aim to build portfolios capable of withstanding a wide range of economic environments and delivering attractive returns over full market cycles.
The opinions expressed herein are those of Aristotle Capital Management, LLC (Aristotle Capital) and are subject to change without notice. Past performance is not a guarantee or indicator of future results. This material is not financial advice or an offer to buy or sell any product. You should not assume that any of the securities transactions, sectors or holdings discussed in this report were or will be profitable, or that recommendations Aristotle Capital makes in the future will be profitable or equal the performance of the securities listed in this report. The portfolio characteristics shown relate to the Aristotle Global Equity strategy. Not every client’s account will have these characteristics. Aristotle Capital reserves the right to modify its current investment strategies and techniques based on changing market dynamics or client needs. There is no assurance that any securities discussed herein will remain in an account’s portfolio at the time you receive this report or that securities sold have not been repurchased. The securities discussed may not represent an account’s entire portfolio and, in the aggregate, may represent only a small percentage of an account’s portfolio holdings. The performance attribution presented is of a representative account from Aristotle Capital’s Global Equity Composite. The representative account is a discretionary client account which was chosen to most closely reflect the investment style of the strategy. The criteria used for representative account selection is based on the account’s period of time under management and its similarity of holdings in relation to the strategy. Recommendations made in the last 12 months are available upon request.
Returns are presented gross and net of model fees and include the reinvestment of all income. Gross returns will be reduced by fees and other expenses that may be incurred in the management of the account. Net returns are presented net of model fees. Net returns are calculated by subtracting a model fee of .50% on an annual basis or .04167% on a monthly basis, which includes trading costs and the reinvestment of all income.
All investments carry a certain degree of risk, including the possible loss of principal. Investments are also subject to political, market, currency and regulatory risks or economic developments. International investments involve special risks that may in particular cause a loss in principal, including currency fluctuation, lower liquidity, different accounting methods and economic and political systems, and higher transaction costs. These risks typically are greater in emerging markets. While Large-capitalization companies may have more stable prices than smaller, less established companies, they are still subject to equity securities risk. In addition, large-capitalization equity security prices may not rise as much as prices of equity securities of small-capitalization companies. Securities of small- and medium-sized companies tend to have a shorter history of operations and be more volatile and less liquid. Value stocks can perform differently from the market as a whole and other types of stocks. The material is provided for informational and/or educational purposes only and is not intended to be and should not be construed as investment, legal or tax advice and/or a legal opinion. Investors should consult their financial and tax adviser before making investments. The opinions referenced are as of the date of publication, may be modified due to changes in the market or economic conditions, and may not necessarily come to pass. Information and data presented has been developed internally and/or obtained from sources believed to be reliable. Aristotle Capital does not guarantee the accuracy, adequacy or completeness of such information.
Aristotle Capital Management, LLC is an independent investment adviser registered under the Investment Advisers Act of 1940, as amended. Registration does not imply a certain level of skill or training. More information about Aristotle Capital, including our investment strategies, fees and objectives, can be found in our Form ADV Part 2, which is available upon request. ACM-2506-125
Sources: CAPS CompositeHubTM, MSCI
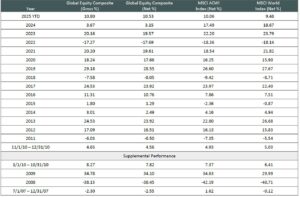
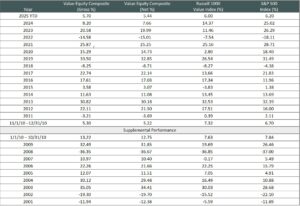
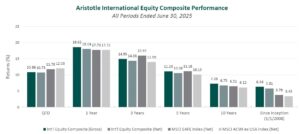
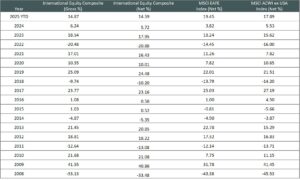
Composite returns for all periods ended June 30, 2025 are preliminary pending final account reconciliation. MSCI ACWI (Net) was stated as the primary benchmark on June 1, 2024 and MSCI World (Net) became the secondary benchmark. The Aristotle Global Equity Composite has an inception date of November 1, 2010; however, the strategy initially began at Howard Gleicher’s predecessor firm in July 2007. A supplemental performance track record from January 1, 2008 through October 31, 2010 is provided on this page and complements the Global Equity Composite presentation that is located at the end of this presentation. The performance results were achieved while Mr. Gleicher managed the strategy at a prior firm. The returns are those of a publicly available mutual fund from the fund’s inception through Mr. Gleicher’s departure from the firm. During that time, Mr. Gleicher had primary responsibility for managing the fund.
Past performance is not indicative of future results. The information provided should not be considered financial advice or a recommendation to purchase or sell any particular security or product. Performance results for periods greater than one year have been annualized. Composite and supplemental returns are presented gross and net of model fees and include the reinvestment of all income. Gross returns will be reduced by fees and other expenses that may be incurred in the management of the account. Net returns are presented net of model fees. Net returns are calculated by subtracting a model fee of .50% on an annual basis or .04167% on a monthly basis, which includes trading costs and the reinvestment of all income.
MSCI ACWI (Net) was stated as the primary benchmark on June 1, 2024 and MSCI World (Net) became the secondary benchmark. The MSCI ACWI captures large and mid-cap representation across 23 developed markets and 24 emerging markets countries. With approximately 2,600 constituents, the Index covers approximately 85% of the global investable equity opportunity set. The MSCI ACWI Equal Weighted Index represents an alternative weighting scheme to its market cap weighted parent index, MSCI ACWI. The Index includes the same constituents as its parent (large and mid-cap securities from 23 developed markets and 24 emerging markets countries. However, at each quarterly rebalance date, all index constituents are weighted equally, effectively removing the influence of each constituent’s current price (high or low). Between rebalances, index constituent weightings will fluctuate due to price performance. The MSCI World Index is a free float-adjusted market capitalization weighted index that is designed to measure the equity market performance of developed markets. The MSCI World Index consists of the following 23 developed market country indexes: Australia, Austria, Belgium, Canada, Denmark, Finland, France, Germany, Hong Kong, Ireland, Israel, Italy, Japan, Netherlands, New Zealand, Norway, Portugal, Singapore, Spain, Sweden, Switzerland, the United Kingdom and the United States. The MSCI Emerging Markets Index is a free float-adjusted market capitalization-weighted index that is designed to measure equity market performance of emerging markets. The MSCI Emerging Markets Index consists of the following 24 emerging market country indexes: Brazil, Chile, China, Colombia, Czech Republic, Egypt, Greece, Hungary, India, Indonesia, Korea, Kuwait, Malaysia, Mexico, Peru, Philippines, Poland, Qatar, Saudi Arabia, South Africa, Taiwan, Thailand, Turkey and United Arab Emirates. The MSCI ACWI Growth Index captures large and mid-cap securities exhibiting overall growth style characteristics across 23 developed markets countries and 24 emerging markets countries. The MSCI ACWI Value Index captures large and mid-cap securities exhibiting overall value style characteristics across 23 developed markets countries and 24 emerging markets countries. The MSCI Europe Index captures large and mid-cap representation across 15 developed markets countries in Europe. With approximately 400 constituents, the Index covers approximately 85% of the free float-adjusted market capitalization across the European developed markets equity universe. The MSCI Japan Index is designed to measure the performance of the large and mid-cap segments of the Japanese market. With approximately 200 constituents, the Index covers approximately 85% of the free float-adjusted market capitalization in Japan. The S&P 500® Index is the Standard & Poor’s Composite Index of 500 stocks and is a widely recognized, unmanaged index of common stock prices. The S&P 500 Equal Weight Index is designed to be the size-neutral version of the S&P 500. It includes the same constituents as the cap-weighted S&P 500, but each company in the S&P 500 Equal Weight Index is allocated the same weight at each quarterly rebalance. The Bloomberg Global Aggregate Bond Index is a flagship measure of global investment grade debt from 27 local currency markets. This multi-currency benchmark includes Treasury, government-related, corporate and securitized fixed rate bonds from both developed and emerging markets issuers. The Brent Crude Oil Index is a major trading classification of sweet light crude oil that serves as a major benchmark price for purchases of oil worldwide. The U.S. Consumer Price Index is a measure of the average change over time in the prices paid by urban consumers for a market basket of consumer goods and services. The U.K. Consumer Price Index is a measure of inflation that is calculated by the Office for National Statistics (ONS). It measures the change in the price of a basket of goods and services consumed by households in the U.K. The Japanese core Consumer Price Index measures changes in the prices paid by consumers for a basket of goods and services, excluding fresh food costs. The volatility (beta) of the Composite may be greater or less than the benchmarks. It is not possible to invest directly in these indexes.