Commentary
Global Equity 4Q 2024
(All MSCI index returns are shown net and in U.S. dollars unless otherwise noted.)
Markets Review
Sources: CAPS CompositeHubTM, Bloomberg
Past performance is not indicative of future results. Aristotle Global Equity Composite returns are presented gross and net of investment advisory fees and include the reinvestment of all income. Gross returns will be reduced by fees and other expenses that may be incurred in the management of the account. Net returns are presented net of actual investment advisory fees and after the deduction of all trading expenses. Aristotle Capital Composite returns are preliminary pending final account reconciliation. Please see important disclosures at the end of this document.
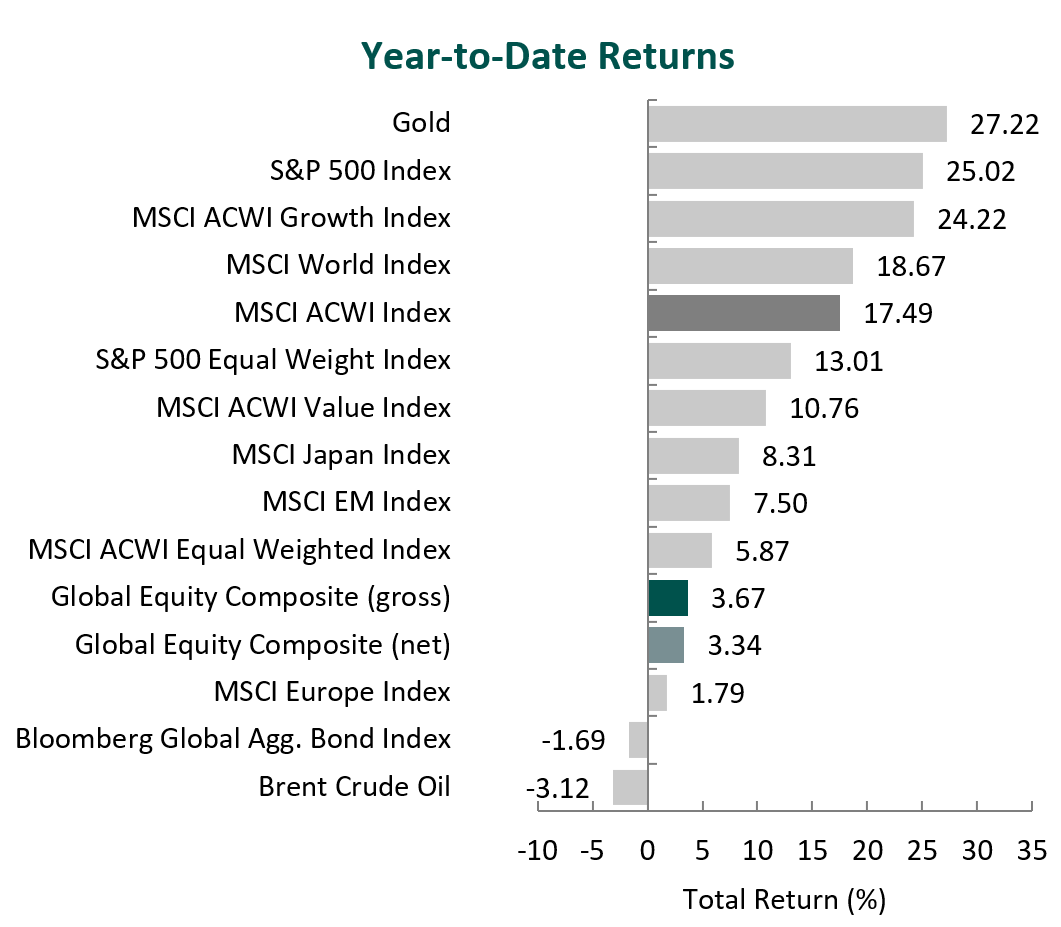
Global equity markets ended the year slightly down, with the MSCI ACWI Index returning -0.99% in the fourth quarter. Concurrently, the Bloomberg Global Aggregate Bond Index fell by 5.10%. In terms of style, value stocks lagged their growth counterparts during the quarter, with the MSCI ACWI Value Index underperforming the MSCI ACWI Growth Index by 7.35%.
Latin America and Europe were the weakest regions, while North America was the only positive performer and Japan declined the least. On a sector basis, seven out of the eleven sectors within the MSCI ACWI Index finished lower, with Materials, Health Care and Real Estate falling the most. Meanwhile, Consumer Discretionary, Communication Services and Information Technology were the strongest performers.
Geopolitics continued to make headlines, as the conflicts in Ukraine and the Middle East escalated. For the first time during the war, Ukraine launched U.S.-made missiles deep into Russian territory, while Russia continued to bombard Ukraine’s power grid in the midst of winter. Russian President Vladimir Putin announced that aggression from a non-nuclear country – with the direct or indirect participation of a nuclear country – would be considered a joint attack on Russia, lowering the bar for the use of nuclear weapons.
In the Middle East, a tenuous ceasefire was made between Israel and Hezbollah, as well as seeming progress toward a ceasefire between Israel and Hamas. However, tensions also escalated as Israel, in response to an Iranian missile attack, conducted a precision strike on military targets in Iran. Concerns over a regional conflict have intensified, as the two countries have drawn closer to a potentially more forceful direct encounter. The Middle East also experienced a shock in politics, as the Islamist militant group Hayat Tahrir al-Sham overthrew the Iranian and Russian-backed dictator Bashar al-Assad in Syria. Europe and Asia were not immune to instability, as the French parliament passed a vote of no confidence against Prime Minister Michel Barnier, and the South Korean National Assembly voted to impeach President Yoon Suk Yeol after he declared martial law.
Even with the continued uncertainty stoked by geopolitical conflicts and political regime changes across the globe, the IMF projects global economic growth to hold steady at 3.2% for 2024 and 2025. Additionally, global inflation continues to decline, resulting in global headline inflation projections of 3.5% for 2025 – below the 2000-2019 average of 3.6%. As western countries continue to target a 2% annual rate of inflation, the Federal Reserve, European Central Bank and Bank of England all cut key interest rates during the period. In Asia, Japan’s index of service-sector inflation hit its highest level since 1995, as rising wages have caused companies to pass on higher costs. Though the Bank of Japan did not raise rates at its most recent meeting, Governor Kazuo Ueda has indicated that the central bank would continue to raise rates if inflation sustainably hit a 2% annual rate. Meanwhile, China announced a $1.4 trillion stimulus package to address local government debt issues and support its economy. The Chinese government hopes to repair municipal balance sheets rather than directly injecting money into the economy (which it has done in the past).
Annual Markets Review
Global equity markets continued climbing in 2024 following a strong year in 2023, as the MSCI ACWI posted a full-year return of 17.49%. Additionally, growth outperformed value, as the MSCI ACWI Growth Index outperformed the MSCI ACWI Value Index by 13.46% in 2024. Meanwhile, fixed income markets lagged, as the Bloomberg Global Aggregate Bond Index fell by 1.69%.
Although the equity market remained strong in 2024 amid resilient global growth, uncertainty heading into 2025 is high, as geopolitical conflicts remain unsolved, central bank policy effects have yet to fully play out and countries’ governments are changing leadership.
Therefore, rather than trying to predict the unpredictable, we choose to focus on individual businesses and their long-term prospects. We believe by focusing on what is analyzable in the long run, we will be able to weather short-term volatility and provide attractive returns over the long term for our clients.
Performance and Attribution Summary
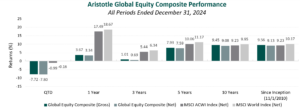
For the fourth quarter of 2024, Aristotle Capital’s Global Equity Composite posted a total return of -7.72% gross of fees (-7.80% net of fees), underperforming the MSCI ACWI Index, which returned -0.99%, and the MSCI World Index, which returned -0.16%. Please refer to the table below for detailed performance.
| Performance (%) | 4Q24 | YTD | 1 Year | 3 Years | 5 Years | 10 Years | Since Inception* |
|---|---|---|---|---|---|---|---|
| Global Equity Composite (gross) | -7.72 | 3.67 | 1.01 | 7.93 | 9.45 | 9.45 | 9.56 |
| Global Equity Composite (net) | -7.80 | 3.34 | 0.69 | 7.59 | 9.08 | 9.08 | 9.13 |
| MSCI ACWI Index (net) | -0.99 | 17.49 | 5.44 | 10.06 | 9.23 | 9.23 | 9.23 |
| MSCI World Index (net) | -0.16 | 18.67 | 6.34 | 11.17 | 9.95 | 9.95 | 10.17 |
Source: FactSet
Past performance is not indicative of future results. Attribution results are based on sector returns which are gross of investment advisory fees. Attribution is based on performance that is gross of investment advisory fees and includes the reinvestment of income.
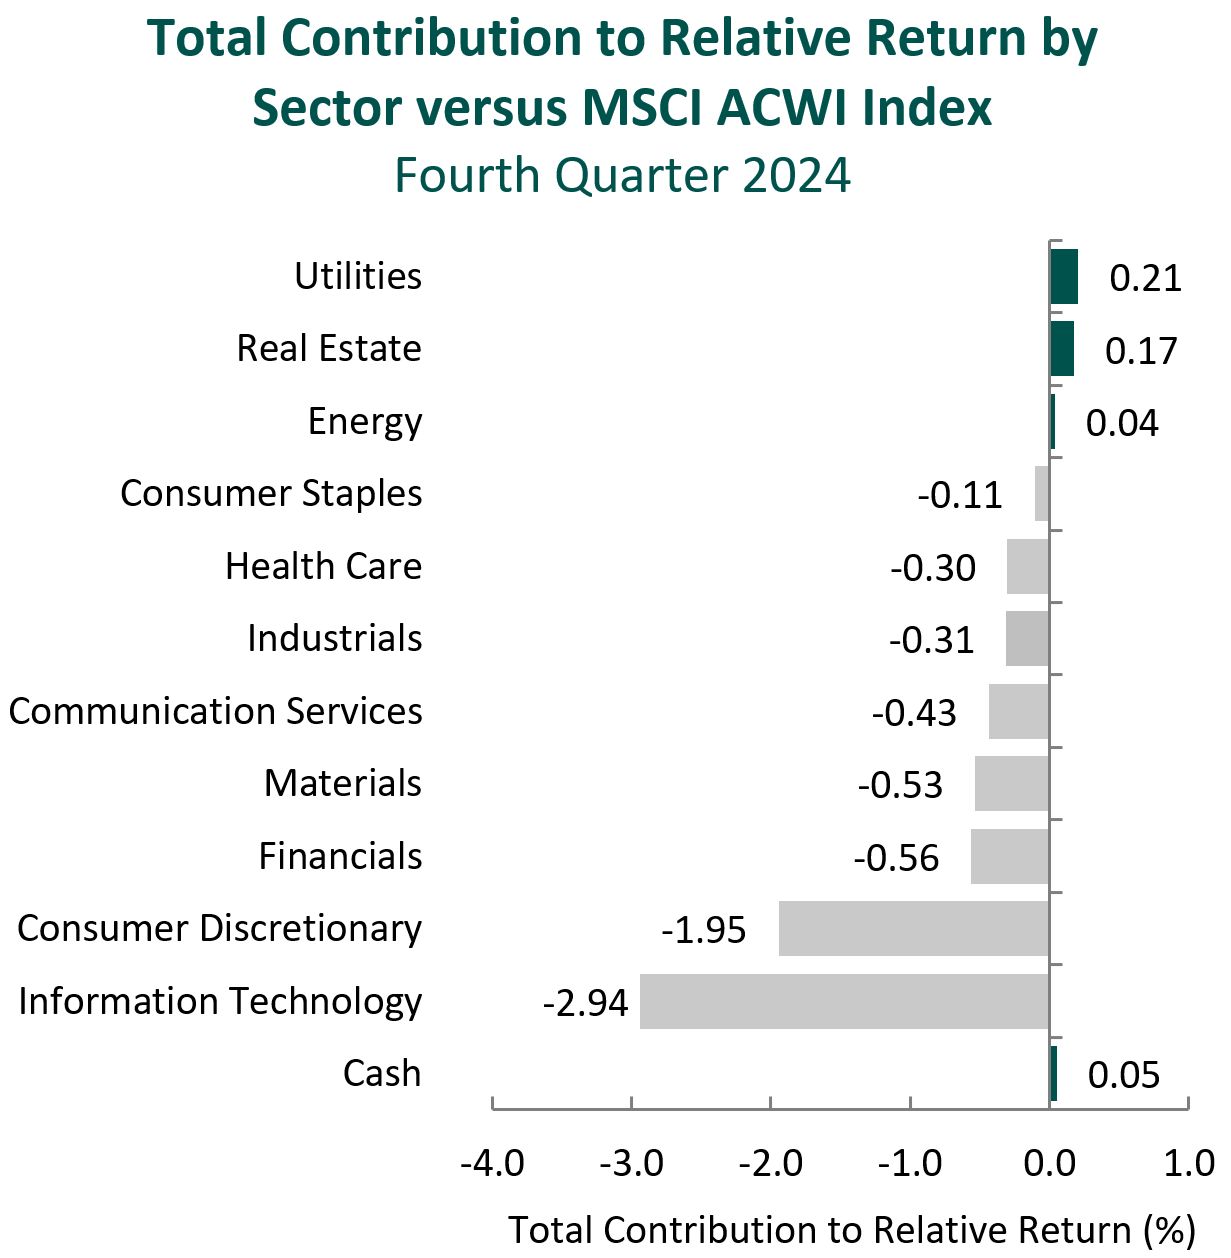
From a sector perspective, the portfolio’s underperformance relative to the MSCI ACWI Index can be primarily attributed to security selection, while allocation effects also had a negative impact. Security selection in Information Technology and Consumer Discretionary and an overweight in Materials detracted the most from the portfolio’s relative performance. Conversely, security selection in Materials, an overweight in Consumer Discretionary and a lack of exposure to Utilities contributed to relative return.
Regionally, security selection was primarily responsible for the portfolio’s underperformance relative to the MSCI ACWI Index, while allocation effects also had a negative impact. Security selection in North America and Europe detracted the most from relative performance, while security selection in Japan and an underweight in Emerging Markets contributed.
Contributors and Detractors for 4Q 2024
| Relative Contributors | Relative Detractors |
|---|---|
| Cameco | Lennar |
| Norwegian Cruise Line Holdings | Microchip Technology |
| Sony | DSM-Firmenich |
| DBS Group | Amgen |
| Brookfield | Michelin |
Microchip Technology, the microcontroller (MCU) and analog semiconductor producer, was one of the largest detractors for the period. Revenues continued to decline amid the severe inventory correction, which has persisted in most end markets other than defense and aerospace since early 2023. In addition, Microchip’s board unexpectedly announced that CEO Ganesh Moorthy (who led the company since 2021) would retire with the current chairman and long-tenured former CEO Steve Sanghi returning. Mr. Sanghi returned on an interim basis, allowing the company to focus on turnaround efforts without near-term plans to search for a replacement. We have admired Mr. Sanghi’s skill at navigating past chip cycles and will closely track the company’s ability to execute on restructuring initiatives, which aim to resize its manufacturing footprint and reduce inventory. This includes plans to soon shut down the company’s wafer fabrication facility in Arizona, which the company expects should generate annual cash savings of approximately $90 million. Despite recent missteps in inventory management that were exacerbated by cyclical headwinds, we are optimistic about management’s plans to right-size its business. Moreover, we remain confident that Microchip’s broad portfolio is uniquely positioned to increase its market share in 16- and 32-bit MCUs and areas including IoT, 5G infrastructure, autonomous driving and data centers.
DSM-Firmenich (DSM), the Dutch-Swiss nutrition, health and bioscience company, was one of the largest detractors. Despite a decline in share price, the company continued to increase its sales across segments following customer destocking in 2023. Within its largest segment – Perfumery & Beauty – we believe DSM will uniquely benefit, as customers look to differentiate their products and increase fragrance dosage levels. The company has also made progress on the integration of its 2023 merger with Firmenich, a catalyst we previously identified, which we expect to create further sales and product development synergies. With low leverage, the company is in a strong position to pursue additional bolt-on acquisitions and return cash to shareholders, all while it executes on shedding lower-margin segments. As such, during the quarter, the company completed the sale of its yeast extracts and marine lipid business and remains on track with plans to divest its Animal Nutrition & Health segment. We believe this should enhance overall profitability, as DSM’s global scale, close relationships with customers and ability to innovate allow the company to continue to gain global market share across the businesses it operates.
Norwegian Cruise Line Holdings, one of the world’s largest cruise ship operators, was a major contributor during the quarter. With post pandemic consumer sentiment regarding the cruise industry continuing to improve, the company has seen strong advanced booking trends, improving occupancy levels and an upward momentum in pricing. Norwegian Cruise Line has also simultaneously executed on optimizing ship operating costs and instituting a new fuel purchasing program, which has allowed the company to offset inflation. Furthermore, the company continues to make progress on its multibillion-dollar efforts to upgrade and expand its fleet, with one of the company’s newest ships, Allura, ready to set sail in 2025. We believe the company’s cost-saving initiatives and fleet improvements will lead to higher levels of profitability and FREE cash flow, allowing the company to continue to reduce debt and increase its intrinsic value.
Sony, the global provider of videogames and consoles, image sensors, music, and movies, was a top contributor for the period. The company reported strong results driven by third-party gaming revenue and record PlayStation 5 console profitability. This was achieved despite lower console sales, which, in our view, exemplifies the strength of PlayStation’s network effects. PlayStation is the world’s largest gaming platform with 116 million monthly active users, making it an attractive market for game developers and allowing users to play the most advanced games at lower costs than PCs. In its Pictures segment, Crunchyroll (the anime business Sony acquired from AT&T in 2020) signed a distribution agreement with YouTube Primetime Channels, the market share leader in streaming services, which we believe will increase Crunchyroll’s subscriber base. Though a singular example, it illustrates management’s ability to better execute and further improve the segment’s profitability, a catalyst we previously identified. In addition, Sony reported improved sales of image sensors for mobile products as the global smartphone market continued its gradual recovery. Sony’s image sensor business has the largest global market share, and we believe, longer term, it is uniquely positioned to benefit from increasing demand for both autonomous driving technology in vehicles and improved image quality in smartphone cameras. As such, we continue to admire Sony’s capacity to build on its industry leadership and optimize its operations, which includes its plan for a partial spinoff of its Financial Services segment in October 2025.
Recent Portfolio Activity
| Buys | Sells |
|---|---|
| None | None |
Consistent with our long-term horizon and low turnover, there were no new purchases or sales completed during the quarter.
Conclusion
While in 2024 we delivered positive absolute returns, our portfolio’s relative performance is nevertheless disappointing. Despite this, we remain confident in our time-tested investment process which has a longer-term orientation. By definition, value investors often seek to invest in companies that are not “in vogue” with investors. As a result, we believe our quality oriented approach to intrinsic value investing is best measured over a full market cycle, which we define as three to five years. While the market in 2024 was largely driven by narrowly focused investment themes, we remain confident that, over the long term, stock prices will track business fundamentals.
The opinions expressed herein are those of Aristotle Capital Management, LLC (Aristotle Capital) and are subject to change without notice. Past performance is not a guarantee or indicator of future results. This material is not financial advice or an offer to buy or sell any product. You should not assume that any of the securities transactions, sectors or holdings discussed in this report were or will be profitable, or that recommendations Aristotle Capital makes in the future will be profitable or equal the performance of the securities listed in this report. The portfolio characteristics shown relate to the Aristotle Global Equity strategy. Not every client’s account will have these characteristics. Aristotle Capital reserves the right to modify its current investment strategies and techniques based on changing market dynamics or client needs. There is no assurance that any securities discussed herein will remain in an account’s portfolio at the time you receive this report or that securities sold have not been repurchased. The securities discussed may not represent an account’s entire portfolio and, in the aggregate, may represent only a small percentage of an account’s portfolio holdings. The performance attribution presented is of a representative account from Aristotle Capital’s Global Equity Composite. The representative account is a discretionary client account which was chosen to most closely reflect the investment style of the strategy. The criteria used for representative account selection is based on the account’s period of time under management and its similarity of holdings in relation to the strategy. Recommendations made in the last 12 months are available upon request.
Returns are presented gross and net of investment advisory fees and include the reinvestment of all income. Gross returns will be reduced by fees and other expenses that may be incurred in the management of the account. Net returns are presented net of actual investment advisory fees and after the deduction of all trading expenses.
All investments carry a certain degree of risk, including the possible loss of principal. Investments are also subject to political, market, currency and regulatory risks or economic developments. International investments involve special risks that may in particular cause a loss in principal, including currency fluctuation, lower liquidity, different accounting methods and economic and political systems, and higher transaction costs. These risks typically are greater in emerging markets. Securities of small‐ and medium‐sized companies tend to have a shorter history of operations, be more volatile and less liquid. Value stocks can perform differently from the market as a whole and other types of stocks.
The material is provided for informational and/or educational purposes only and is not intended to be and should not be construed as investment, legal or tax advice and/or a legal opinion. Investors should consult their financial and tax adviser before making investments. The opinions referenced are as of the date of publication, may be modified due to changes in the market or economic conditions, and may not necessarily come to pass. Information and data presented has been developed internally and/or obtained from sources believed to be reliable. Aristotle Capital does not guarantee the accuracy, adequacy or completeness of such information.
Aristotle Capital Management, LLC is an independent investment adviser registered under the Investment Advisers Act of 1940, as amended. Registration does not imply a certain level of skill or training. More information about Aristotle Capital, including our investment strategies, fees and objectives, can be found in our Form ADV Part 2, which is available upon request. ACM-2501-64
Sources: CAPS CompositeHubTM, MSCI
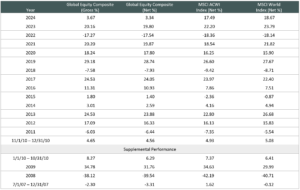
Composite returns for all periods ended December 31, 2024 are preliminary pending final account reconciliation. MSCI ACWI (Net) was stated as the primary benchmark on June 1, 2024 and MSCI World (Net) became the secondary benchmark.
The Aristotle Global Equity Composite has an inception date of November 1, 2010; however, the strategy initially began at Howard Gleicher’s predecessor firm in July 2007. A supplemental performance track record from January 1, 2008 through October 31, 2010 is provided on this page and complements the Global Equity Composite presentation that is located at the end of this presentation. The performance results were achieved while Mr. Gleicher managed the strategy at a prior firm. The returns are those of a publicly available mutual fund from the fund’s inception through Mr. Gleicher’s departure from the firm. During that time, Mr. Gleicher had primary responsibility for managing the fund.
Past performance is not indicative of future results. The information provided should not be considered financial advice or a recommendation to purchase or sell any particular security or product. Performance results for periods greater than one year have been annualized. Returns are presented gross and net of investment advisory fees and include the reinvestment of all income. Gross returns will be reduced by fees and other expenses that may be incurred in the management of the account. Net returns are presented net of actual investment advisory fees and after the deduction of all trading expenses.
MSCI ACWI (Net) was stated as the primary benchmark on June 1, 2024 and MSCI World (Net) became the secondary benchmark. The MSCI ACWI captures large and mid-cap representation across 23 developed markets and 24 emerging markets countries. With approximately 2,700 constituents, the Index covers approximately 85% of the global investable equity opportunity set. The MSCI ACWI Equal Weighted Index represents an alternative weighting scheme to its market cap weighted parent index, MSCI ACWI. The Index includes the same constituents as its parent (large and mid-cap securities from 23 developed markets and 24 emerging markets countries. However, at each quarterly rebalance date, all index constituents are weighted equally, effectively removing the influence of each constituent’s current price (high or low). Between rebalances, index constituent weightings will fluctuate due to price performance. The MSCI World Index is a free float-adjusted market capitalization weighted index that is designed to measure the equity market performance of developed markets. The MSCI World Index consists of the following 23 developed market country indexes: Australia, Austria, Belgium, Canada, Denmark, Finland, France, Germany, Hong Kong, Ireland, Israel, Italy, Japan, Netherlands, New Zealand, Norway, Portugal, Singapore, Spain, Sweden, Switzerland, the United Kingdom and the United States. The MSCI Emerging Markets Index is a free float-adjusted market capitalization-weighted index that is designed to measure equity market performance of emerging markets. The MSCI Emerging Markets Index consists of the following 24 emerging market country indexes: Brazil, Chile, China, Colombia, Czech Republic, Egypt, Greece, Hungary, India, Indonesia, Korea, Kuwait, Malaysia, Mexico, Peru, Philippines, Poland, Qatar, Saudi Arabia, South Africa, Taiwan, Thailand, Turkey and United Arab Emirates. The MSCI ACWI Growth Index captures large and mid-cap securities exhibiting overall growth style characteristics across 23 developed markets countries and 24 emerging markets countries. The MSCI ACWI Value Index captures large and mid-cap securities exhibiting overall value style characteristics across 23 developed markets countries and 24 emerging markets countries. The MSCI Europe Index captures large and mid-cap representation across 15 developed markets countries in Europe. With more than 400 constituents, the Index covers approximately 85% of the free float-adjusted market capitalization across the European developed markets equity universe. The MSCI Japan Index is designed to measure the performance of the large and mid-cap segments of the Japanese market. With approximately 200 constituents, the Index covers approximately 85% of the free float-adjusted market capitalization in Japan. The S&P 500® Index is the Standard & Poor’s Composite Index of 500 stocks and is a widely recognized, unmanaged index of common stock prices. The S&P 500 Equal Weight Index is designed to be the size-neutral version of the S&P 500. It includes the same constituents as the cap-weighted S&P 500, but each company in the S&P 500 Equal Weight Index is allocated the same weight at each quarterly rebalance. The Bloomberg Global Aggregate Bond Index is a flagship measure of global investment grade debt from 28 local currency markets. This multi-currency benchmark includes Treasury, government-related, corporate and securitized fixed rate bonds from both developed and emerging markets issuers. The Brent Crude Oil Index is a major trading classification of sweet light crude oil that serves as a major benchmark price for purchases of oil worldwide. The volatility (beta) of the Composite may be greater or less than the benchmarks. It is not possible to invest directly in these indexes.