
Morgan Stanley
Small/Mid Cap Equity 4Q 2021
FOR FINANCIAL ADVISORS ONLY. NOT FOR PUBLIC DISTRIBUTION.
Markets Review
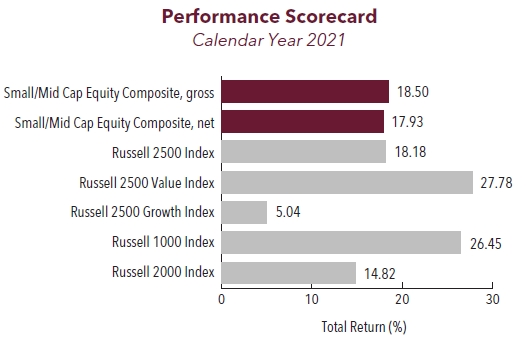
The small/mid cap segment of the equity market, as measured by the Russell 2500 Index, appreciated 3.82% in the fourth quarter, capping a strong 2021 in which the asset class returned 18.18% for the full calendar year. Despite posting positive returns during the quarter, the period was not without volatility, as the emergence of the highly infectious Omicron variant captured headlines and led to a 10% intra-quarter decline in the Russell 2500 Index. Small/mid caps quickly recovered into year-end however, as global data indicated the new variant may have a lower probability of hospitalization as compared to prior variants.
On the policy front, the U.S. Federal Reserve (Fed) took center stage, as the rapidly tightening labor market and persistent inflationary pressures pushed the Fed to adopt a more hawkish stance. The shift in Fed posturing appears to have been triggered by recent inflation and labor market data. In November, U.S. headline inflation posted a 39-year high, clocking in at 6.8% on a year-over-year basis, while the unemployment rate ticked down to just 4.2%. At the time of this writing, markets are currently pricing in three rate hikes in 2022; however, the situation remains fluid as a host of uncertainties could potentially alter the pace and direction of hikes throughout the year.
Stylistically, value outperformed growth in the fourth quarter, as measured by the Russell 2500 Value Index’s return of 6.36% compared to the 0.20% return of the Russell 2500 Growth Index. For the full year, the Russell 2500 Value turned in strong relative performance versus the Russell 2500 Growth, generating a total return of 27.78% compared to 5.04% and marking the first time in the last five calendar years where value has led the market. Fundamentally, companies with lower valuations, stronger profitability and higher return on equity generally outperformed, signaling a recent shift in sentiment towards more reasonably valued, higher quality companies within the small/mid cap space.
At the sector level, nine of the eleven sectors within the Russell 2500 Index generated positive returns during the quarter, led by Utilities (+12.14%), Real Estate (+11.49%) and Materials (+10.75%). Communication Services (-7.93%), Health Care (-6.05%) and Consumer Discretionary (+1.79%) underperformed, trailing the broader market as represented by the Russell 2500 Index.
Sources: SS&C Advent; Russell Investments
Past performance is not indicative of future results. Returns are presented gross and net of investment advisory fees and include the reinvestment of all income. Aristotle Boston Composite returns are preliminary pending final account reconciliation. Please see important disclosures at the end of this document. price-to-earnings data. Past performance is not indicative of future results. Please see important disclosures at the end of this document.
Performance Review
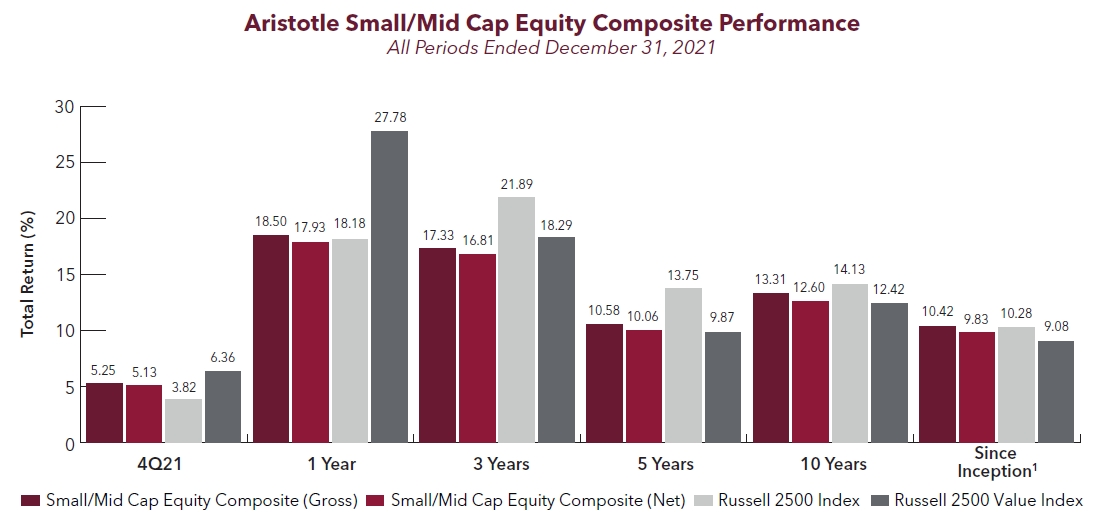
For the fourth quarter of 2021, the Aristotle Small/Mid Cap Equity Composite generated a total return of 5.25% gross of fees (5.13% net of fees), outperforming the 3.82% total return of the Russell 2500 Index and underperforming the 6.36% total return of the Russell 2500 Value Index. Overall, security selection accounted for the majority of the strategy’s outperformance during the quarter. Security selection within the Information Technology, Industrials and Consumer Staples sectors added the most value on a relative basis, while selection within Materials, Energy and Consumer Discretionary detracted. From an allocation perspective, the portfolio benefited from an underweight in Communication Services and an overweight in Industrials; however, this was partially offset by underweights in Real Estate and Utilities.
| Relative Contributors | Relative Detractors |
|---|---|
| Rogers | Merit Medical Systems |
| Bottomline Technologies | HealthEquity |
| Dycom Industries | Range Resources |
| MACOM Technology Solutions | 1-800-FLOWERS.COM |
| Ciena | Charles River Laboratories |
CONTRIBUTORS
Security selection added the most value within the Information Technology, Industrials and Consumer Staples sectors. From an allocation perspective, an underweight in Communication Services and an overweight in Industrials contributed positively to relative performance. Additionally, the portfolio’s orientation toward companies with reasonable valuations and strong free cash flow profiles also contributed. At the company level, Rogers and Bottomline Technologies were two of the largest contributors during the quarter.
- Rogers (ROG), a designer/manufacturer of highly engineered materials for a variety of end markets, appreciated following an announcement that the company was being acquired in an all-cash transaction by DuPont (DD).
- Bottomline Technologies (EPAY), a New Hampshire-based FinTech company offering digital banking, legal spend management and online bill pay solutions for corporations, appreciated on the news it is being acquired by private equity sponsor Thoma Bravo.
DETRACTORS
Security selection detracted within the Materials, Energy and Consumer Discretionary sectors. Additionally, underweight exposures in Real Estate and Utilities detracted from relative performance. At the company level, Merit Medical Systems and HealthEquity were two of the largest detractors during the quarter.
- Merit Medical Systems (MMSI), a Utah-based developer and manufacturer of disposable medical products, pulled back following a strong rebound from the pandemic-induced lows. Concerns about the impact from a potential slowdown in elective medical procedures as a result of the spread of the Omicron variant may be contributing to the pullback. Nevertheless, we continue to maintain a position, as we believe company-specific self-help initiatives introduced in 2019 have begun to produce financial benefits for the company. Furthermore, we believe the long-term secular outlook for the company’s products remains solid.
- HealthEquity (HQY), a Utah-based provider of Health Savings Accounts (HSA) and Consumer Directed Benefits (CDB) services, pulled back on disappointing fundamental performance, as a continued delay in return-to-work has weighed on the CDB portion of their business. We continue to maintain a position due to the attractive secular and stable outlook for the company’s core HSA business, along with the expectation that the CDB part of the business will eventually rebound.
Recent Portfolio Activity
| Buys | Sells |
|---|---|
| United Community Banks | Fulton Financial |
| Team |
BUYS/ACQUISITIONS
- United Community Banks (UCBI), is a bank holding company that provides business and consumer banking services in the southeast region of the U.S. In addition to shares being attractively valued, we believe the company’s exposure to markets growing faster than the national average, strong credit performance of their loan portfolio and balance sheet capacity to grow their loan portfolio should create value for shareholders going forward.
SELLS/LIQUIDATIONS
- Fulton Financial (FULT), a Pennsylvania-based regional bank, was eliminated from the portfolio due to our view that the fundamental outlook for the business was reflected in the valuation and that there were more attractive investment opportunities elsewhere.
- Team (TISI), a provider of specialty industrial services for the refining, petrochemical, power and pipeline industries, was removed from the portfolio as a result of ongoing disappointing fundamental performance, along with a surprising negative legal development that called into question the ongoing viability of the business.
Outlook and Positioning
Global equity markets, including U.S. small/mid caps, posted healthy returns in 2021, although the year was not without its challenges. Inflationary pressures continue to linger, central banks are becoming more aggressive, supply chain issues remain and pandemic-related uncertainties persist. While each of these factors, along with a plethora of others, may contribute to uncertainty and affect investors’ risk appetites over the near term, we believe equity markets will continue to be driven by business fundamentals over the long term.
From a fundamental standpoint, we believe the economic backdrop in the U.S. remains supportive of small/mid cap equities over the next multi-year horizon. While we are, by no means, market prognosticators, the company-specific insights that we have obtained through our bottom-up research lead us to believe that there is the opportunity for further appreciation, especially for companies with solid fundamentals and compelling valuations. Additionally, as the Fed continues its path towards interest rate normalization, and as company fundamentals and valuations become increasingly more important, we believe this development should be beneficial for fundamentally-oriented, active managers like ourselves.
Our current positioning is a function of our bottom-up security selection process and our ability to identify what we view as attractive investment candidates, regardless of economic sector definitions. Overweights in Industrials, Information Technology and Financials are broad-based with recent purchases across a variety of industries and end markets. Conversely, we continue to be underweight in Consumer Discretionary, as we have been unable to identify what we consider to be compelling opportunities that fit our discipline given the rising risk profiles as a result of structural headwinds for various brick and mortar businesses. We also continue to be underweight in Real Estate as a result of valuations and structural challenges for various end markets within the sector. Given our focus on long-term business fundamentals, patient investment approach and low portfolio turnover, the strategy’s sector positioning generally does not change significantly from quarter to quarter; however, we may take advantage of periods of volatility by adding selectively to certain companies when appropriate. As always, our focus remains on identifying what we view as attractive, long-term investment opportunities that can create value for shareholders over the next three to five years, which we believe gives us the best opportunity to generate alpha for our clients.
The opinions expressed herein are those of Aristotle Capital Boston, LLC (Aristotle Boston) and are subject to change without notice.
Past performance is not indicative of future results. The information provided in this report should not be considered financial advice or a recommendation to purchase or sell any particular security. There is no assurance that any securities discussed herein will remain in an account’s portfolio at the time you receive this report or that securities sold have not been repurchased. The securities discussed may not represent an account’s entire portfolio and, in the aggregate, may represent only a small percentage of an account’s portfolio holdings. The performance attribution presented is of a representative account from Aristotle Boston’s Small/Mid Cap Equity Composite. The representative account is a discretionary client account which was chosen to most closely reflect the investment style of the strategy.
The criteria used for representative account selection is based on the account’s period of time under management and its similarity of holdings in relation to the strategy. It should not be assumed that any of the securities transactions, holdings or sectors discussed were or will be profitable, or that the investment recommendations or decisions Aristotle Boston makes in the future will be profitable or equal the performance of the securities discussed herein. Aristotle Boston reserves the right to modify its current investment strategies and techniques based on changing market dynamics or client needs. Recommendations made in the last 12 months are available upon request.
Returns are presented gross and net of investment advisory fees and include the reinvestment of all income. Gross returns will be reduced by fees and other expenses that may be incurred in the management of the account. For example, a 0.5% annual fee deducted quarterly (0.125%) from an account with a ten-year annualized growth rate of 5.0% will produce a net result of 4.4%. Actual performance results will vary from this example.
The Russell 2500 Index is a subset of the Russell 3000® Index representing approximately 10% of the total market capitalization of that index. It includes approximately 2000 of the smallest securities based on a combination of their market cap and current index membership. The Russell 2500 Growth® Index measures the performance of the small/mid cap companies located in the United States that also exhibit a growth probability. The Russell 2500 Value® Index measures the performance of the small/mid cap companies located in the United States that also exhibit a value probability. The Russell 2000® Index measures the performance of the small cap segment of the U.S. equity universe. The Russell 2000 Index is a subset of the Russell 3000® Index representing approximately 10% of the total market capitalization of that index. It includes approximately 2000 of the smallest securities based on a combination of their market cap and current index membership. The Russell 1000® Index measures the performance of the large cap value segment of the U.S. equity universe. The volatility (beta) of the composite may be greater or less than the benchmarks. It is not possible to invest directly in these indices.
This presentation is to report on the investment strategies as reported by Aristotle Capital Management, LLC and is for illustrative purposes only. The information contained herein is obtained from multiple sources and believed to be reliable. Information has not been verified by Morgan Stanley Wealth Management, and may differ from documents created by Morgan Stanley Wealth Management. The financial advisor should refer to the Profile. This must be preceded or accompanied by the Morgan Stanley Wealth Management Profile, which you can obtain from the Morgan Stanley Wealth Management Performance Analytics. For additional information on other programs, please speak to Patrick Schussman at Aristotle Capital at (310) 954-8156.
Aristotle Capital Boston, LLC is an independent investment adviser registered under the Investment Advisers Act of 1940, as amended. Registration does not imply a certain level of skill or training. More information about Aristotle Boston, including our investment strategies, fees and objectives, can be found in our Form ADV Part 2, which is available upon request. ACB-2201-18-MSFA
Sources: SS&C Advent, Russell Investments
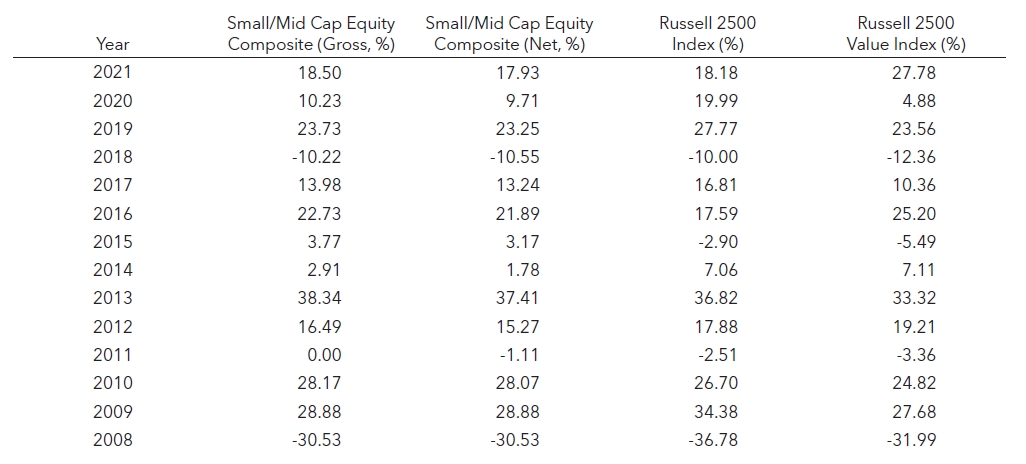
Composite returns for periods ended December 31, 2021 are preliminary pending final account reconciliation.
1The Aristotle Small/Mid Cap Equity Composite has an inception date of January 1, 2008 at a predecessor firm. During this time, Jack McPherson and Dave Adams had primary responsibility for managing the strategy. Performance starting January 1, 2015 was achieved at Aristotle Boston.
Past performance is not indicative of future results. Performance results for periods greater than one year have been annualized.
Returns are presented gross and net of investment advisory fees and include the reinvestment of all income. Gross returns will be reduced by fees and other expenses that may be incurred in the management of the account. Please see important disclosures enclosed within this document