Commentary
Corporate Credit 1Q 2024
Summary
U.S. corporate credit markets ended the first quarter with mixed performance, as a strong rally across risk assets saw U.S. yields edge higher and corporate credit spreads narrow to near cycle tights. Longer duration bonds felt the impact of higher rates, and the Bloomberg U.S. Aggregate Bond Index ended the quarter lower, with a total return of -0.78%. Following a strong 2023, bank loans outperformed both high yield bonds and investment grade corporate bonds during the quarter, as the Credit Suisse Leveraged Loan Index gained 2.52%. High yield bonds benefited from tighter credit spreads, as the Bloomberg U.S. High Yield Corporate Bond Index returned 1.47%, while investment grade corporate bonds felt the impact of higher yields, as the Bloomberg U.S. Corporate Bond Index returned -0.40%.
U.S. equity markets staged an impressive rally to begin the year, with the S&P 500 Index gaining 10.56%, its largest first-quarter gain since 2019. After a sharp rally through the end of 2023, equities continued higher despite rising yields, a stronger dollar and higher oil prices. U.S. equities remained underpinned by solid economic data and supportive Federal Reserve (Fed) rhetoric. U.S. economic growth continued to beat expectations, as fourth quarter GDP showed the economy expanding at an annual rate 3.1% in the fourth quarter. The labor market also remained resilient with nonfarm payrolls exceeding expectations, despite the unemployment rate rising to 3.9% in February. Meanwhile, U.S. inflation remained sticky, as annual CPI exceeded expectations in the first two months of the year, rising to 3.2% in February.
The Fed remained unfazed by slightly hotter-than-expected inflation readings in the first quarter; however, the interest rate futures market began to pare back expectations for rate cuts in 2024, from roughly six at the end of 2023 to three at the end of the first quarter. At its March meeting, the Fed left its benchmark rate unchanged for the fifth consecutive meeting at 5.25% to 5.50%, a 23-year high. According to the Fed’s Summary of Economic Projections (SEP), the committee continues to expect 75 basis points of rate cuts this year and nudged up median rate projections slightly over the next two years. Nonetheless, Chairman Powell suggested the recent higher-than-expected inflation data did not change the Fed’s view of a continued disinflationary trend while signaling rate cuts will remain dependent on incoming inflation data, emphasizing cutting rates too soon or too much could reverse the progress already made by the central bank.
Market Environment
U.S. Treasuries sold off during the first quarter, as yields rose across the curve in a modest bear-flattening move. The yield on the U.S. 2-year note climbed roughly 37 basis points, while the yield on the U.S. 10-year note rose about 31 basis points. As a result, the yield spread between the 2-year and 10-year notes widened to around 42 basis points. The current inversion has persisted since July 2022, surpassing the previous record from 1978 for the longest continuous inversion of this spread.
Corporate credit spreads continued to tighten in the first quarter, as historically attractive all-in yields in corporate credit drove demand for spread product. High yield bond spreads ended the quarter approximately 24 basis points tighter, as measured by the Bloomberg U.S. Corporate High Yield Bond Index. Notably, the spread on the high yield index ended the quarter under 300 basis points, a level not seen since January 2022 and less than 70 basis points above the all-time tight from 2007. Investment grade corporate bond spreads tightened roughly 9 basis points, as measured by the Bloomberg U.S. Corporate Bond Index, ending the quarter around 15 basis points from the all-time low seen in 2005.
U.S. corporate bond issuance picked up sharply during the quarter, and the majority was related to refinancing. High yield bond supply topped $87 billion, making it the busiest quarter in more than two years. Leveraged loan supply also surged, totaling more than $315 billion, more than triple the total from the same period a year ago and well above the 10-year average. Additionally, investment grade corporate bond issuance surged to nearly $500 billion, a record quarterly sum.
Following two years of retail outflows, high yield bond and leveraged loan fund flows turned around in the first quarter. High yield bond inflows topped $2.6 billion during the quarter, which was a sharp reversal compared to the nearly $14 billion of outflows seen in the first quarter of 2023. Leveraged loan funds inflows totaled roughly $2.8 billion during the period compared to the nearly $11 billion first-quarter outflow last year. Leveraged loans were bolstered by robust collateralized loan obligation (CLO) demand, with CLO volume topping $48 billion ex-refi/resets during the quarter, a 40% increase compared to the first quarter of 2023. Continuing the positive trend from 2023, investment grade corporate bond funds experienced solid inflows in the first quarter totaling more than $55 billion.
Within the high yield bond market, lower-quality bonds outperformed by a small margin in the first quarter, as ‘CCC’s (+2.14%) outperformed ‘B’s (+1.36%) and ‘BB’s (+1.13%). From an industry perspective, within the Bloomberg U.S. High Yield Bond Index, Retailers & Restaurants (+3.72%) and Financials (+2.86%) outperformed, while Cable & Satellite (-3.38%) and Telecommunications (-1.43%) underperformed.
Defaults and distressed exchanges moderated in the first quarter. The 12-month trailing, par-weighted U.S. high yield default rate, including distressed exchanges, declined around 25 basis points to end the quarter at 2.59% (1.67%, excluding distressed exchanges), more than 50 basis points below its long-term historical average. Meanwhile, the loan par-weighted default rate, including distressed exchanges, increased roughly 37 basis points to end March at 3.52% (1.86%, excluding distressed exchanges), which is now about 50 basis points above its long-term historical average.
Performance and Attribution Summary
High Yield Bond
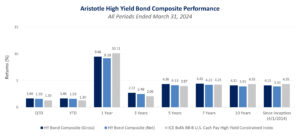
The Aristotle High Yield Bond Composite returned 1.66% gross of fees (1.59% net of fees) in the first quarter, outperforming the 1.30% return of the ICE BofA BB-B U.S. Cash Pay High Yield Constrained Index. Industry allocation was the primary contributor to relative performance, while sector rotation detracted from relative performance.
Industry allocation contributed to relative performance led by an underweight in Cable & Satellite and an overweight in Energy. This was partially offset by underweights in Brokerage and Healthcare. Security selection also contributed to relative performance led by holdings in Finance Companies and Utilities. This was partially offset by selection in Retailers & Restaurants and Cable & Satellite. Conversely, sector rotation detracted from relative performance led by the allocation to investment grade corporate bonds, which was partially offset by the allocation to bank loans.
| Top Five Contributors | Top Five Detractors |
|---|---|
| Air Lease | Venture Global LNG |
| Next Alt SARL | Telecom Italia |
| Energy Transfer | ADT Corporation |
| Teine Energy | OutFront Media |
| Precision Drilling | QVC |
Short Duration High Yield Bond
The Aristotle Short Duration High Yield Bond Composite returned 1.30% pure gross of fees (1.17% net of fees) in the first quarter, underperforming the 1.54% return of the ICE BofA 1-3 Year BB-B U.S. Cash Pay Fixed Maturity High Yield Constrained Index. Security selection was the primary detractor from relative performance, while industry allocation contributed to relative performance.
Security selection detracted from relative performance led by holdings in Building Materials & Home Construction and Cable & Satellite. This was partially offset by selection in Lodging & Leisure and Telecommunications. Sector rotation also detracted marginally from relative performance led by the allocation to investment grade corporate bonds. The allocation to cash also detracted slightly from relative performance, with no offsetting contributors. Conversely, industry allocation contributed to relative performance led by underweights in Cable & Satellite and Media & Entertainment. This was partially offset by underweights in Gaming and Industrials.
| Top Five Contributors | Top Five Detractors |
|---|---|
| Next Alt SARL | Beazer Homes |
| Global Partners | Staples |
| Millenium Escrow | U.S. Acute Care Solutions |
| Petrofac | SBA Communications |
| Marriott | Spirit Airlines |
Outlook
U.S. corporate credit markets had a relatively strong start to the year, as underlying fundamentals remained solid while technical factors and the macroeconomic backdrop continued to be supportive. We believe current all-in yields remain attractive in U.S. corporate credit, which should continue to drive demand. In our view, while valuations and spreads sit near historically rich levels, the yield available in corporate credit will continue to present opportunities and the potential for positive total returns this year.
Overall, the macroeconomic backdrop remains favorable for risk assets. In our opinion, the U.S. economy has been resilient, as labor market and growth data remain supportive despite interest rates sitting at 23-year highs. Compared to the rest of the world, the U.S. economy continues to be the strongest performer, while the European and Chinese economies have both shown modest improvement over the last several months. With the U.S. economy in a late-cycle expansion, we believe the strong consumer and continued impact of fiscal stimulus will help support risk assets, although we acknowledge the economy may face greater risks as the year progresses. As always, it will be important to monitor incoming economic data for any warning signs ahead.
With the U.S. economy continuing to outperform expectations, one of the biggest risks is a scenario in which inflation reaccelerates and leads to persistently higher-for-longer rates. Equity and credit markets shrugged off higher commodity prices and a stronger U.S. dollar in the first quarter, but should inflation begin to tick up further, there is a chance the Fed pares back expectations for rate cuts in the second half of the year. Most companies have been able to weather interest rates at current levels due to prudent refinancing decisions in the past few years. However, the longer rates stay at elevated levels, especially into next year, the greater the potential for cracks to emerge in rate-sensitive areas of the economy such as commercial real estate and smaller companies with weaker balance sheets.
In our view, corporate balance sheets remain quite strong and currently compressed credit spreads reflect this reality. We expect the yield curve to steepen in 2024, with longer-end U.S. yields likely to be rangebound with a bias to the topside. As a result, we continue to favor the front end of the curve. Furthermore, geopolitical tensions continue to rise, and while markets have quickly brushed off geopolitical risks in the past year, we believe an abrupt escalation of tensions could result in a risk-off scenario, leading to wider credit spreads and a steeper yield curve with lower front-end rates.
We believe there is limited room for credit spreads to tighten significantly from here, especially given current valuations. However, technical factors continue to be supportive of corporate credit. While new issue activity has picked up, it has largely been focused on refinancing. Additionally, with more rising stars than fallen angels, the high yield bond market remains constrained. We expect corporate fundamentals to remain healthy, with higher-quality credits maintaining moderate leverage and solid interest coverage, which should contain default activity in the coming months. We are also seeking to avoid some of the lower-quality large-cap structures in the market that have begun to face difficulties. We continue to focus on companies with sound capital structures, which should be able to withstand an extended period of elevated interest rates. We believe the higher-quality segment of the high yield bond market, particularly in the short to intermediate part of the curve, presents relatively attractive opportunities for income and the potential for positive total returns.
High Yield Bond Positioning
In our high yield bond portfolios, we continue to favor higher-quality credits in the short to intermediate part of the curve, while maintaining overall duration below the benchmark. We favor industries with a domestic focus, which we believe should benefit from a healthy U.S. consumer, as well as credits that have prudently managed their balance sheets to withstand persistent higher rates.
While higher-quality credits underperformed during the quarter, mostly due to rate sensitivity, they began to outperform at the end of the quarter. We continue to favor the higher-quality segment of the market, and we believe certain lower-quality areas will likely face the worst of any potential refinancing risks, which could emerge later this year as a result of an extended period of higher-for-longer rates. We are maintaining a modest duration underweight relative to the benchmark and continue to look for attractive opportunities in the belly of the curve that may benefit from a steeper yield curve.
Industry-wise, we favor credits with a domestic focus in areas of the market we believe should benefit from a strong consumer. We are maintaining an overweight in Energy and Retailers & Restaurants while avoiding companies facing significant financing risks in Cable & Satellite and Telecommunications. At the end of the quarter, we held overweights in Energy, Transportation and Retailers & Restaurants alongside underweights in Cable & Satellite, Technology and Chemicals.
All investments carry a certain degree of risk, including the possible loss of principal. Investments are also subject to political, market, currency and regulatory risks or economic developments. There are risks specifically associated with fixed income investments such as interest rate risk and credit risk. Bond values fluctuate in price in response to market conditions. Typically, when interest rates rise, there is a corresponding decline in bond values. This risk may be more pronounced for bonds with longer-term maturities. Credit risk refers to the possibility that the bond issuer will not be able to make principal and interest payments. High yield securities are generally rated lower than investment grade securities and may be subject to greater market fluctuations, increased price volatility, risk of issuer default, less liquidity, or loss of income and principal compared to investment grade securities.
The material is provided for informational and/or educational purposes only and is not intended to be and should not be construed as investment, legal or tax advice and/or a legal opinion. Investors should consult their financial and tax adviser before making investments. The opinions referenced are as of the date of publication, may be modified due to changes in the market or economic conditions, and may not necessarily come to pass. Information and data presented has been developed internally and/or obtained from sources believed to be reliable. Aristotle Credit does not guarantee the accuracy, adequacy or completeness of such information.
The opinions expressed herein are those of Aristotle Credit Partners, LLC (Aristotle Credit) and are subject to change without notice. Past performance is not a guarantee or indicator of future results. This material is not financial advice or an offer to buy or sell any product. You should not assume that any of the securities transactions, sectors or holdings discussed in this report are or will be profitable, or that recommendations Aristotle Credit makes in the future will be profitable or equal the performance of the securities listed in this report. The portfolio characteristics shown relate to the Aristotle Credit High Yield Bond strategy and the Aristotle Credit Short Duration High Yield Bond strategy. Not every client’s account will have these characteristics. Aristotle Credit reserves the right to modify its current investment strategies and techniques based on changing market dynamics or client needs. There is no assurance that any securities discussed herein will remain in an account’s portfolio at the time you receive this report or that securities sold have not been repurchased. The securities discussed may not represent an account’s entire portfolio and, in the aggregate, may represent only a small percentage of an account’s portfolio holdings. For a full list of all recommendations made by Aristotle Credit during the last 12 months, please contact us at (949) 681-2100. This is not a recommendation to buy or sell a particular security.
Past performance is not indicative of future results. Performance results for periods greater than one year have been annualized. Composite returns are preliminary pending final account reconciliation.
High Yield Bond Returns: Composite and benchmark returns reflect the reinvestment of income. Composite returns are presented gross and net of investment advisory fees and include the reinvestment of all income. Gross returns will be reduced by fees and other expenses that may be incurred in the management of the account. Net returns are presented net of actual investment advisory fees and after the deduction of all trading expenses.
Short Duration High Yield Bond Returns – Pure Gross: Pure gross returns do not reflect the deduction of any trading costs, fees or expenses. Pure gross returns prior to September 2017 reflect the deduction of transaction costs. Model Net Performance: Starting from September 2017, composite returns are presented pure gross and net of the highest wrap fee stated. Performance for periods prior to September 2017 are presented pure gross and net of actual investment advisory fees.
Aristotle Credit Partners, LLC is an independent registered investment adviser under the Advisers Act of 1940, as amended. Registration does not imply a certain level of skill or training. More information about Aristotle Credit, including our investment strategies, fees and objectives, can be found in our Form ADV Part 2, which is available upon request. ACP-2404-1

Sources: SS&C Advent; ICE BofA
*Composite returns are preliminary pending final account reconciliation.
**2014 is a partial-year period of nine months, representing data from April 1, 2014 to December 31, 2014.
***2009 is a partial-year period of ten months, representing data from March 1, 2009 to December 31, 2009.
Past performance is not indicative of future results. Composite returns are presented gross and net of investment advisory fees and include the reinvestment of all income. Gross returns will be reduced by fees and other expenses that may be incurred in the management of the account. Net returns are presented net of actual investment advisory fees and after the deduction of all trading expenses. The Aristotle High Yield Bond strategy has an inception date of April 1, 2014; however, the strategy initially began at Douglas Lopez’s predecessor firm. A supplemental performance track record from March 1, 2009 to December 31, 2013 (Mr. Lopez’s departure from the firm) is provided. The returns are based on a separate account from the strategy while it was being managed at Doug Lopez’s predecessor firm and performance results are based on custodian data. During this time, Mr. Lopez had primary responsibility for managing the account. Please refer to disclosures at the end of this document.


Sources: SS&C Advent; ICE BofA
*Composite returns are preliminary pending final account reconciliation.
**2014 is a partial-year period of nine months, representing data from April 1, 2014 to December 31, 2014.
Past performance is not indicative of future results. Composite and benchmark returns reflect the reinvestment of income. Pure Gross: Pure gross returns do not reflect the deduction of any trading costs, fees or expenses. Pure gross returns prior to September 2017 reflect the deduction of transaction costs. Model Net Performance: Starting from September 2017, composite returns are presented pure gross and net of the highest wrap fee stated. Performance for periods prior to September 2017 are presented pure gross and net of actual investment advisory fees. Please refer to disclosures at the end of this document.
The Bloomberg U.S. Aggregate Bond Index is a broad base, market capitalization-weighted bond market index representing intermediate term investment grade bonds traded in the United States. The Index is frequently used as a stand-in for measuring the performance of the U.S. bond market. In addition to investment grade corporate debt, the Index tracks government debt, mortgage-backed securities (MBS) and asset-backed securities (ABS) to simulate the universe of investable bonds that meet certain criteria. In order to be included in the Index, bonds must be of investment grade or higher, have an outstanding par value of at least $100 million and have at least one year until maturity. The Bloomberg U.S. Corporate Bond Index measures the investment grade, fixed-rate, taxable corporate bond market. It includes securities publicly issued by U.S. and non-U.S. industrial, utility and financial issuers that are all U.S. dollar denominated. The Bloomberg U.S. Corporate Bond Index is a component of the Bloomberg U.S. Credit Bond Index. The Bloomberg U.S. Corporate High Yield Bond Index measures the U.S. dollar-denominated, high yield, fixed-rate corporate bond market. Securities are classified as high yield if the middle rating of Moody’s, Fitch and S&P is Ba1/BB+/BB+ or below. Bonds from issuers with an emerging markets country of risk, based on Bloomberg EM country definition, are excluded. The S&P 500 Index is the Standard & Poor’s Composite Index and is a widely recognized, unmanaged index of common stock prices. It is market cap weighted and includes 500 leading companies, capturing approximately 80% coverage of available market capitalization. The ICE Bank of America (ICE BofA) BB-B U.S. Cash Pay High Yield Constrained Index measures the performance of the U.S. dollar-denominated BB-rated and B-rated corporate debt issued in the U.S. domestic market, a fixed coupon schedule and a minimum amount outstanding of $100 million, issued publicly. Allocations to an individual issuer in the Index will not exceed 2%. The Credit Suisse Leveraged Loan Index is a market-weighted index designed to track the performance of the investable universe of the U.S. dollar-denominated leveraged loan market. The ICE Bank of America (ICE BofA) 1-3 Year BB-B U.S. Cash Pay Fixed Maturity High Yield Constrained Index tracks the performance of the U.S. dollar-denominated below investment grade corporate debt, currently in a coupon paying period, that is publicly issued in the U.S. domestic market; including 144A securities, both with and without registration rights. Qualifying securities must have risk exposure to countries are members of the FX-G10, Western Europe, or territories of the United States and Western Europe. The FX-G10 includes all Euro members: the United States, Japan, the United Kingdom, Canada, Australia, New Zealand, Switzerland, Norway and Sweden. Qualifying securities include only those rated BB1 through B3. Perpetual securities are not included as all securities must have a fixed final maturity date. All final maturity dates must range between one and three years. It is a capitalization-weighted index, constrained to 2% maximum weighting per issuer. The Consumer Price Index is a measure of the average change over time in the prices paid by urban consumers for a market basket of consumer goods and services. The volatility (beta) of the Composites may be greater or less than the indices. It is not possible to invest directly in these indices. Composite and index returns reflect the reinvestment of income.