FOR FINANCIAL ADVISORS ONLY. NOT FOR PUBLIC DISTRIBUTION.

Summary

U.S. corporate credit markets declined sharply in the first quarter amidst a large backup in interest rates as bank loans significantly outperformed high yield bonds and investment grade corporate bonds in the first quarter. Bank loans returned -0.10% during the period as measured by the Credit Suisse Leveraged Loan Index. High yield bonds faced their worst quarter since the first quarter of 2020 and returned -4.84% as measured by the Bloomberg U.S. Corporate High Yield Bond Index. Investment grade corporate bonds underperformed amidst a rout in longer duration assets and returned -7.69%, the worst quarterly return since 2008, as measured by the Bloomberg U.S. Corporate Bond Index.

U.S. equities fell as the S&P 500 Index returned -4.60% during the period. The decline was driven by several factors including an aggressive hawkish pivot from global central banks led by the Federal Reserve (Fed), persistent inflationary pressures and a spike in geopolitical tensions emerging from Russia’s invasion of Ukraine in February. U.S. economic data painted a mixed picture as the labor market continued to improve while inflation continued to rise. The unemployment rate fell to 3.8% in February, its lowest level since February 2020, while inflation accelerated further from already elevated levels as the February Consumer Price Index (CPI) rose by 7.9% year-over-year, the fastest annual pace in nearly 40 years. At its March meeting, the Fed voted to raise the target for the benchmark federal funds rate by 25 basis points, the first increase since 2018. The Fed reiterated additional interest rate hikes will be needed, and it will accelerate the pace of tapering, reducing its holdings of Treasuries, agency debt and agency mortgage-backed securities (MBS). Geopolitical tensions also rose significantly with Russia’s invasion of Ukraine, further clouding the global economic outlook and sparking a broad-based rally in commodities. On the COVID-19 front, while trends continued to improve in the U.S., a resurgence in China toward the end of the quarter led to regional lockdowns and added further uncertainty to the global growth outlook.

Market Environment

U.S. Treasury yields rose sharply in the first quarter with the front end of the curve leading the way, resulting in significant bear flattening. The yield on the U.S. 2-Year note climbed roughly 160 basis points during the period, while the yield on the U.S. 10-Year note rose roughly 83 basis points. The curve flattened further and threatened inversion beyond the 2-Year point toward the end of the quarter as the Treasury market rapidly repriced the Fed’s tightening cycle. Longer duration bonds underperformed as the Bloomberg U.S. Aggregate Bond Index fell 5.93%, its largest quarterly decline in more than 40 years.

Alongside the selloff in risk assets, corporate credit spreads widened modestly but ended the quarter well off their widest levels seen in early March. High yield bond spreads widened roughly 38 basis points but ended the quarter more than 80 basis points below the March high as measured by the Bloomberg U.S. Corporate High Yield Bond Index. Investment grade corporate bond spreads also widened roughly 22 basis points as measured by the Bloomberg U.S. Corporate Bond Index.

High yield bond issuance slowed markedly in the first quarter with issuance totaling roughly $43 billion, the lowest first quarter total since 2016, as borrowers were cautious amidst the market turmoil and sharp backup in yields. Investment grade corporate bond issuance topped $450 billion in the first quarter with issuance rebounding in March, as monthly supply topped $230 billion. Additionally, leveraged loan supply totaled close to $110 billion in the first quarter, a modest slowdown compared to last year’s pace.

On the demand side, investors continued to favor bank loan funds over high yield bond and investment grade corporate bond funds amidst robust demand for floating-rate instruments. U.S. leveraged loan funds experienced inflows of nearly $20 billion in the first quarter, while U.S. high yield bond funds experienced outflows of nearly $25 billion and investment grade corporate bond funds experienced outflows of more than $10 billion.

Within the high yield bond market, the riskier segments outperformed as ‘B’s (-3.53%) and ‘CCC’s (-3.88%) outperformed ‘BB’s (-5.94%) with higher quality bonds bearing more interest rate risk than the lower quality segments of the market. From an industry perspective, Energy (-2.60%) outperformed led by the rally in commodities, while Communications (-6.60%) trailed the broader high yield bond market. Default activity remained very low by historical standards with only $1.6 billion of actual defaults during the quarter as the 12-month trailing, par-weighted U.S. high-yield default rate fell to a record low of 0.23% at the end of March.

Performance and Attribution Summary

High Yield Bond – SMA

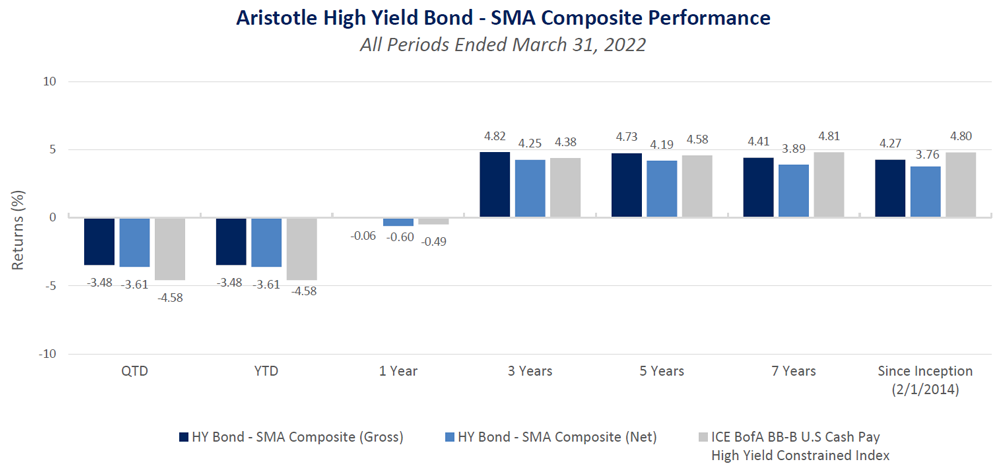
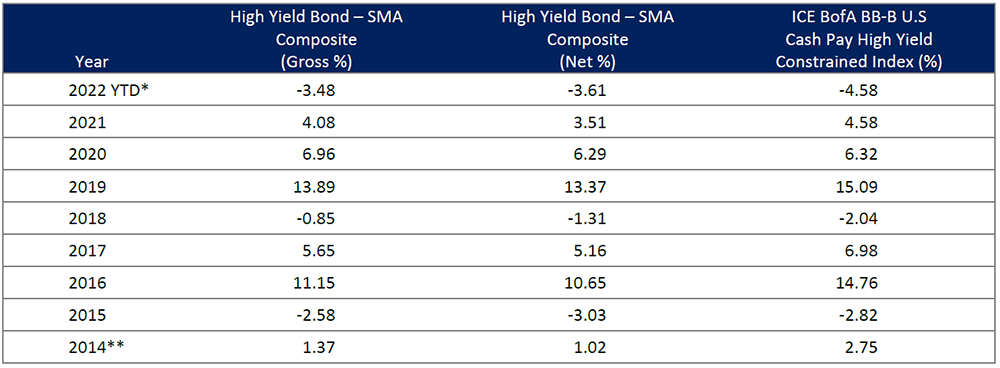
The Aristotle High Yield Bond – SMA Composite returned -3.48% gross of fees (-3.61% net of fees) in the first quarter, outperforming the -4.58% return of the ICE BofA BB-B U.S. Cash Pay High Yield Constrained Index.

Security selection contributed to relative performance led by holdings in Media & Entertainment and Automotive & Captive Finance. This was partially offset by security selection in Telecommunications and Diversified Manufacturing & Construction Machinery. Industry allocation also contributed to relative performance led by an underweight in Food, Beverage & Tobacco and an overweight in Media & Entertainment. This was partially offset by an underweight in Energy and an overweight in Automotive & Captive Finance. Additionally, sector rotation contributed modestly to relative performance led by the allocation to cash, which was partially offset by the allocation to investment grade corporate bonds.

Top Five Contributors Top Five Detractors
Quad/GraphicsPBF Energy
Kraft HeinzLevel 3 Financing
TennecoDell
Murphy OilTelecom Italia
Mercer InternationalAirlease
*Bold securities held in representative account

High Yield Bond Focused ESG

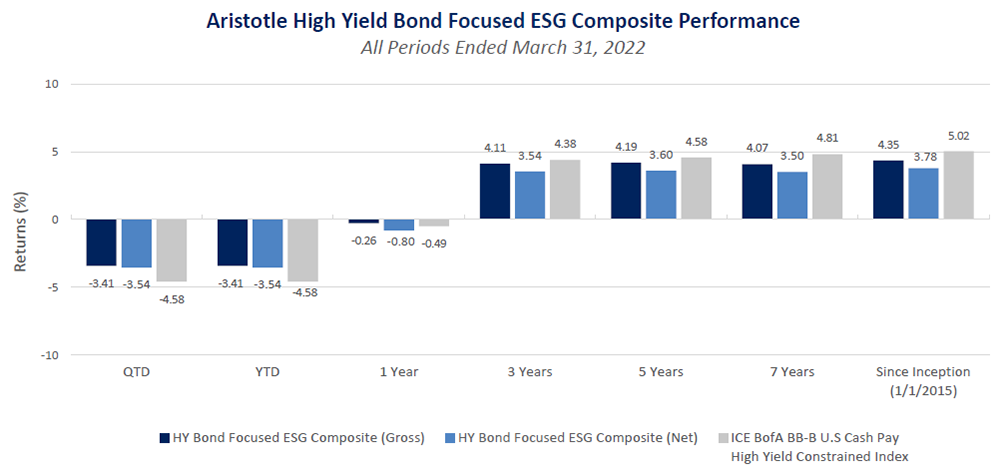
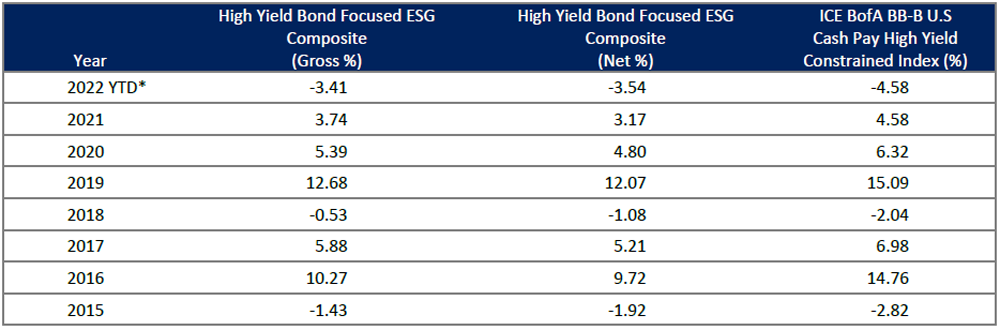
The Aristotle High Yield Bond Focused ESG Composite returned -3.41% gross of fees (-3.54% net of fees) in the first quarter, outperforming the -4.58% return of the ICE BofA BB-B U.S. Cash Pay High Yield Constrained Index.

Security selection contributed to relative performance led by holdings in Media & Entertainment and Retailers & Restaurants. This was partially offset by security selection in Diversified Manufacturing & Construction Machinery and Telecommunications. Industry allocation also contributed modestly to relative performance led by an underweight in Food, Beverage & Tobacco and an overweight in Lodging & Leisure. This was partially offset by an overweight in Retailers & Restaurants and an underweight in Energy. Additionally, sector rotation contributed modestly to relative performance led by the allocation to cash, which was partially offset by the allocation to investment grade corporate bonds.

Top Five Contributors Top Five Detractors
Quad/GraphicsTelecom Italia
Murphy OilDell
Kraft HeinzScotts Miracle-Gro
iHeartMediaUnited Rentals
Macy’sAir Lease
*Bold securities held in representative account

Short Duration High Yield Bond

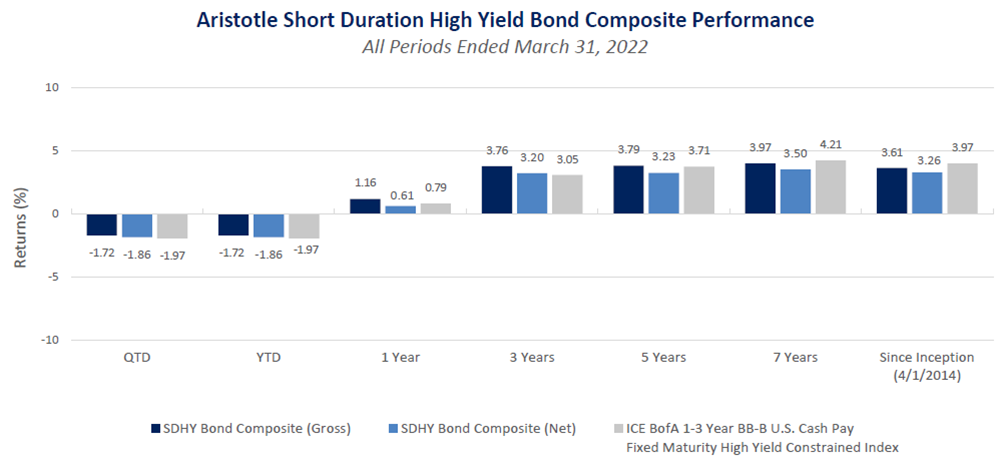
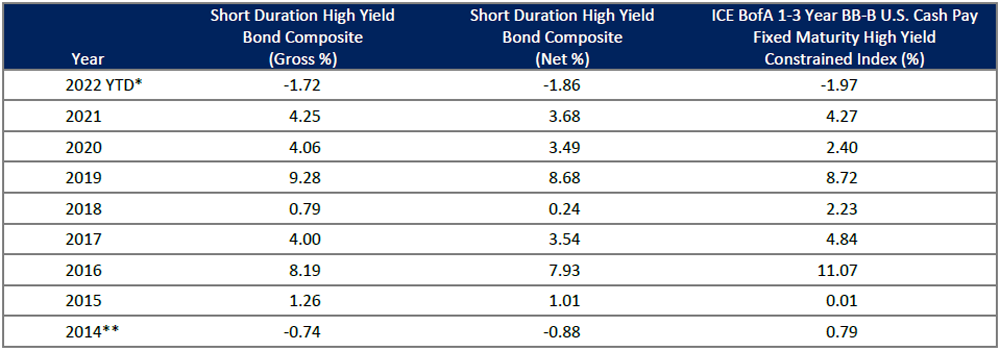
The Aristotle Short Duration High Yield Bond Composite returned -1.72% gross of fees (-1.86% net of fees) in the first quarter, outperforming the -1.97% return of the ICE BofA 1-3 Year BB-B U.S. Cash Pay Fixed Maturity High Yield Constrained Index. Security selection was the primary contributor to relative performance, while industry allocation was the primary detractor from relative performance.

Security selection contributed to relative performance led by holdings in Chemicals and Healthcare. This was partially offset by security selection in Finance Companies and Lodging & Leisure. Sector rotation also contributed modestly to relative performance led by the allocation to cash, which was partially offset by the allocation to investment grade corporate bonds.

Industry allocation detracted modestly from relative performance led by an overweight in Chemicals and an underweight in Paper & Packaging. This was partially offset by an overweight in Media & Entertainment and an underweight in Technology.

Top Five Contributors Top Five Detractors
Uralkali PJSCEquitrans Midstream
Murphy OilRoyal Carribbean
Intesa SanpaoloService Properties Trust
Delta Air LinesMGM Resorts
Macy’sCitgo
*Bold securities held in representative account

Outlook

We believe three major themes have shaped the performance of corporate credit markets thus far in 2022: A more hawkish Fed, more persistent and higher-than-expected inflation and increased geopolitical risk resulting from Russia’s invasion of Ukraine. Despite the increase in uncertainty generated by these three themes, we continue to believe there are opportunities in U.S. corporate credit markets and maintain a positive outlook, especially for shorter duration high yield bonds.

The overall global macroeconomic backdrop has become significantly cloudier than it was at the end of 2021. While the Fed telegraphed tighter policy toward the end of last year, the Fed’s hawkishness so far in 2022 has caught the market by surprise and led to a rapid selloff, concentrated in the front end of the yield curve. With the Fed signaling quantitative tightening will begin in June, we believe there is the potential for the yield curve to steepen given the backdrop of a still strong economy and the extent of the repricing that has already occurred in the front end of the yield curve.

We also believe inflation risks could prove to be more stubborn than originally forecasted toward the end of last year. The impact of the war in Ukraine on commodity prices is just one example of how exogenous shocks have only magnified issues that could lead to stickier inflation. We believe consumers are already beginning to adapt their behavior to higher inflation, and the resulting rise in consumer inflation expectations could lead to more endemic inflation. In our opinion, there is a possibility that companies could eventually face a slowdown in topline demand as consumers’ discretionary income comes under pressure. For companies, the resulting pressure on margins and pricing power could push them to seek topline growth through more leveraged, shareholder-friendly policies.

High yield supply decreased more than we originally expected in the first quarter, and we believe issuance may continue to fall below expectations over the next few quarters. In our opinion, the opportunistic refinancing window for corporates is closed, thus the issuance that does occur this year could be used to fund share repurchases and mergers and acquisitions (M&A). We believe a shift from refinancing-related issuance to M&A and share repurchase-related issuance would be negative for credit market fundamentals. In the investment grade market, we also expect issuance to slow down, which would be positive on the margin for the supply/demand picture.

We believe overall risk, from geopolitical to credit risk, has increased significantly over the past three months. While we see these risks persisting in the coming quarters, we believe the best strategy to protect against these risks is to focus on credit fundamentals and segments of the market that, in our opinion, have already priced in what we believe to be a significant amount of risk, while seeking to avoid the segments of the market that could succumb to less balance sheet-friendly activities.

High Yield Bond Positioning

In our high yield bond portfolios, we continue to favor short duration high yield bonds, especially after the rapid repricing of the 2- to 3-year segment of the yield curve over the past quarter. From an industry perspective, we adjusted our portfolios to add exposure to companies that focus on providing consumer experiences rather than consumer goods.

While duration and interest rates are typically inversely correlated, duration has increased for many high yield bond benchmarks over the past quarter despite the large backup in U.S. yields. Before the increase in interest rates, many bonds had been trading to their call date but as interest rates have increased, these bonds are now trading to their maturity date. We believe most of this adjustment has already happened, and we continue to hold a duration underweight relative to the benchmark in our high yield bond portfolios.

With the reopening of the economy, we also believe there is pent-up demand for consumer experiences (e.g., travel and concerts), which could benefit companies in certain industries. Despite rising input costs, we believe some of the areas that may benefit are concert and event providers, conference-oriented lodging providers and airlines. As a result, we increased exposure to these areas, holding overweights in Media & Entertainment, Transportation and Lodging & Leisure alongside underweights in Technology, Telecommunications and Healthcare.

Disclosures

The opinions expressed herein are those of Aristotle Credit Partners, LLC (Aristotle Credit) and are subject to change without notice. Past performance is not a guarantee or indicator of future results. This material is not financial advice or an offer to buy or sell any product. You should not assume that any of the securities transactions, sectors or holdings discussed in this report are or will be profitable, or that recommendations Aristotle Credit makes in the future will be profitable or equal the performance of the securities listed in this report. The portfolio characteristics shown relate to the Aristotle Credit High Yield Bond – SMA strategy, the Aristotle Credit High Yield Bond Focused ESG strategy and the Aristotle Credit Short Duration High Yield Bond strategy. Not every client’s account will have these characteristics. Aristotle Credit reserves the right to modify its current investment strategies and techniques based on changing market dynamics or client needs. There is no assurance that any securities discussed herein will remain in an account’s portfolio at the time you receive this report or that securities sold have not been repurchased. The securities discussed may not represent an account’s entire portfolio and, in the aggregate, may represent only a small percentage of an account’s portfolio holdings. For a full list of all recommendations made by Aristotle Credit during the last 12 months, please contact us at (949) 681-2100. This is not a recommendation to buy or sell a particular security.

Returns are presented gross and net of investment advisory fees and include the reinvestment of all income. Gross returns will be reduced by fees and other expenses that may be incurred in the management of the account. For example, a 0.5% annual fee deducted quarterly (0.125%) from an account with a ten-year annualized growth rate of 5.0% will produce a net result of 4.4%. Actual performance results will vary from this example.

The Bloomberg U.S. Corporate Bond Index measures the investment grade, fixed-rate, taxable corporate bond market. It includes securities publicly issued by U.S. and non-U.S. industrial, utility and financial issuers that are all U.S. dollar denominated. The Bloomberg U.S. Corporate Bond Index is a component of the Bloomberg U.S. Credit Bond Index. The Bloomberg U.S. Corporate High Yield Bond Index measures the U.S. dollar-denominated, high yield, fixed-rate corporate bond market. Securities are classified as high yield if the middle rating of Moody’s, Fitch and S&P is Ba1/BB+/BB+ or below. Bonds from issuers with an emerging markets country of risk, based on Bloomberg EM country definition, are excluded. The Credit Suisse Leveraged Loan Index is a market-weighted index designed to track the performance of the investable universe of the U.S. dollar-denominated leveraged loan market. The Bloomberg U.S. Aggregate Bond Index is a broad base, market capitalization-weighted bond market index representing intermediate term investment grade bonds traded in the United States. The Index is frequently used as a stand-in for measuring the performance of the U.S. bond market. In addition to investment grade corporate debt, the Index tracks government debt, mortgage-backed securities (MBS) and asset-backed securities (ABS) to simulate the universe of investable bonds that meet certain criteria. In order to be included in the Index, bonds must be of investment grade or higher, have an outstanding par value of at least $100 million and have at least one year until maturity. The S&P 500 Index is the Standard & Poor’s Composite Index and is a widely recognized, unmanaged index of common stock prices. It is market cap weighted and includes 500 leading companies, capturing approximately 80% coverage of available market capitalization. The ICE Bank of America (ICE BofA) BB-B U.S. Cash Pay High Yield Constrained Index measures the performance of the U.S. dollar-denominated BB-rated and B-rated corporate debt issued in the U.S. domestic market, a fixed coupon schedule and a minimum amount outstanding of $100 million, issued publicly. Allocations to an individual issuer in the Index will not exceed 2%. The ICE Bank of America (ICE BofA) 1-3 Year BB-B U.S. Cash Pay Fixed Maturity High Yield Constrained Index tracks the performance of the U.S. dollar-denominated below investment grade corporate debt, currently in a coupon paying period, that is publicly issued in the U.S. domestic market; including 144A securities, both with and without registration rights. Qualifying securities must have risk exposure to countries are members of the FX-G10, Western Europe, or territories of the United States and Western Europe. The FX-G10 includes all Euro members: the United States, Japan, the United Kingdom, Canada, Australia, New Zealand, Switzerland, Norway and Sweden. Qualifying securities include only those rated BB1 through B3. Perpetual securities are not included as all securities must have a fixed final maturity date. All final maturity dates must range between one and three years. It is a capitalization-weighted index, constrained to 2% maximum weighting per issuer. The Consumer Price Index (CPI) is a measure of the average change over time in the prices paid by urban consumers for a market basket of consumer goods and services. The volatility (beta) of the Composites may be greater or less than the indices. It is not possible to invest directly in these indices. Composite and index returns reflect the reinvestment of income.

This presentation is to report on the investment strategies as reported by Aristotle Capital Management, LLC and is for illustrative purposes only. The information contained herein is obtained from multiple sources and believed to be reliable. Information has not been verified by Morgan Stanley Wealth Management, and may differ from documents created by Morgan Stanley Wealth Management. The financial advisor should refer to the Profile. This must be preceded or accompanied by the Morgan Stanley Wealth Management Profile, which you can obtain from the Morgan Stanley Wealth Management Performance Analytics. For additional information on other programs, please speak to Patrick Schussman at Aristotle Capital at (310) 954-8156.

Aristotle Credit Partners, LLC is an independent registered investment adviser under the Advisers Act of 1940, as amended. Registration does not imply a certain level of skill or training. More information about Aristotle Credit, including our investment strategies, fees and objectives, can be found in our Form ADV Part 2, which is available upon request. ACP-2204-14-MSFA

Performance Disclosures


Sources: SS&C Advent; ICE BofA
*Composite returns are preliminary pending final account reconciliation.
**2014 is a partial-year period of eleven months, representing data from February 1, 2014 to December 31, 2014.
Past performance is not indicative of future results. Returns presented are gross and net of investment advisory fees and include the reinvestment of all income. Please refer to disclosures at the end of this document.


Sources: SS&C Advent; ICE BofA
*Composite returns are preliminary pending final account reconciliation.
**2014 is a partial-year period of period of nine months, representing data from April 1, 2014 to December 31, 2014.
Past performance is not indicative of future results. Returns presented are gross and net of investment advisory fees and include the reinvestment ofall income. Please refer to disclosures at the end of this document.

ARISTOTLE CAPITAL BOSTON, LLC

FOR FINANCIAL ADVISORS ONLY. NOT FOR PUBLIC DISTRIBUTION.

Markets Review

After a strong 2021, small/mid cap equities declined alongside other risk assets to begin the year as investors grappled with a myriad of uncertainties, including a shift to tighter monetary policy, the impact of rampant inflation and the ripple effects from Russia’s invasion of Ukraine. On the policy front, the Federal Reserve (Fed) raised the target rate by 0.25%, as expected, making it clear that further increases will be appropriate. Fed officials will now focus on the challenging task of taming inflation without stunting economic growth and sending the U.S. economy into a recession. In related news, supply shortages fueled by the Ukraine-Russia conflict, along with a host of pre-existing factors, drove commodity prices higher during the period. Oil prices were particularly volatile, with crude oil at one point eclipsing $130 a barrel. Natural gas, fertilizer and agriculture-related commodity prices also experienced sharp increases during the period.

From a sector perspective, performance varied widely during the quarter, ranging from the 40.39% total return of the Russell 2500 Energy sector to the 15.16% decline of the Consumer Discretionary sector. To put this type of dispersion into context, Energy’s 40.39% gain versus Consumer Discretionary’s 15.16% loss marked the second largest divergence between any two Russell 2500 sectors in a single quarter. Only Information Technology’s outperformance of Utilities in the fourth quarter of 1999 was greater. Other areas of the small/mid cap market that were hit hard in the first quarter included Health Care (-14.94%) and Information Technology (-9.52%), while Materials (+6.76%) and Utilities (+2.49%) followed Energy as the only other sectors to close the quarter in positive territory.

Stylistically, value continued its outperformance of growth in the first quarter, as evidenced by the Russell 2500 Value Index’s return of -1.50% compared to the -12.30% return of the Russell 2500 Growth Index. This marks the third consecutive quarter of outperformance for the Russell 2500 Value Index relative to the Russell 2500 Growth Index. Factor performance was decidedly mixed during the period, as companies with lower valuations and stronger profitability generally outperformed during the first half of the quarter before ceding leadership to more expensively valued securities during the second half of the quarter. On the other hand, March market performance was particularly bifurcated, as the final three weeks of the month saw pronounced outperformance from the meme stocks, bitcoin and other risk-on proxies, a complete reversal from the first two weeks of the month and factor leadership during the January period.

Sources: SS&C Advent; Russell Investments

Past performance is not indicative of future results. Returns are presented gross and net of investment advisory fees and include the reinvestment of all income. Aristotle Boston Composite returns are preliminary pending final account reconciliation. Please see important disclosures at the end of this document.

Performance Review

For the first quarter of 2022, the Aristotle Small/Mid Cap Equity Composite generated a total return of -4.38% gross of fees (-4.52% net of fees), outperforming the -5.82% total return of the Russell 2500 Index. Outperformance during the quarter was driven entirely by security selection, while allocation effects modestly detracted. Overall, security selection within the Health Care, Energy and Information Technology sectors added the most value on a relative basis, while selection within Financials, Materials and Consumer Discretionary detracted. From an allocation perspective, the portfolio benefited from an underweight in Consumer Discretionary and an overweight in Financials; however, this was offset by an underweight in Energy and an overweight in Information Technology.

Relative ContributorsRelative Detractors
Range ResourcesMACOM Technology Solutions
NexTier Oilfield SolutionsAerCap Holdings
HealthEquityCharles River Laboratories
Cal-Maine FoodsHarsco
KBR1-800-FLOWERS.COM

CONTRIBUTORS

Security selection added the most value within the Health Care, Energy and Information Technology sectors. From an allocation perspective, an underweight in Consumer Discretionary and an overweight in Financials contributed positively to relative performance. At the company level, Range Resources and NexTier Oilfield Solutions were two of the largest contributors during the quarter.

  • Range Resources (RRC), a natural gas focused exploration and production company with operations in the Appalachian Basin, appreciated due to improved investor sentiment following an uptick in natural gas pricing. We maintain a position, as we believe the company’s low-cost acreage allows it to translate the healthy price environment into earnings and cash flow that is being used to reduce financial leverage, which can accrue additional value to equity shareholders in periods to come.
  • NextTier Oilfield Solutions (NEX), a provider of hydraulic fracturing and other completion-oriented oilfield services to exploration and production companies in the U.S., benefited from rising U.S. completion activity and rising prices due to tight supply/demand fundamentals for frac equipment. We maintain a position, as we believe the company’s dedicated service agreements, solid execution and merger synergies from recent mergers and acquisitions activity can unlock additional value for shareholders in periods to come.

DETRACTORS

Security selection detracted within the Financials, Materials and Consumer Discretionary sectors. Additionally, the portfolio’s underweight in Energy and overweight in Information Technology detracted from relative performance. At the company level, MACOM Technology Solutions and AerCap Holdings were two of the largest detractors during the quarter.

  • MACOM Technology Solutions (MTSI), a designer and manufacturer of high-performance semiconductors, declined in the face of industry-wide supply chain issues.  Nevertheless, the company’s fundamentals continue to advance, as we believe the company’s meaningful exposure to growing demand from Data Center and 5G end market applications plus solid company-specific execution has driven faster-than-expected profitability. We believe the underlying demand drivers are sustainable for the foreseeable future and continue to maintain our position.
  • AerCap Holdings (AER), the world’s largest aircraft leasing firm, declined due to negative sentiment associated with the business given its exposure to the airline industry and the recovery of certain eastern European assets. We maintain a position, as we believe the company is well-positioned to weather this period of volatility given its competitive position, robust pipeline of new aircraft orders and strong balance sheet.

Recent Portfolio Activity

Buys/AcquisitionsSells/Liquidations
AZEKEvercore
iStarKraton
Jacobs Engineering Group
Sonos

BUYS/ACQUISITIONS

  • AZEK (AZEK), a leading manufacturer of residential building products, primarily focused on wood-alternative decking, railing and trim, was added to the portfolio. We believe the strong secular demand backdrop for alternative, sustainably sourced building products along with company-specific margin improvements should benefit shareholders in periods to come.
  • iStar (STAR), an internally-managed real estate investment trust specializing in ground leases through its ownership of 65% of Safehold Inc. (SAFE), was added the to the portfolio. We believe the recent sale of the company’s net-lease asset portfolio will allow management to focus on continued investments in its SAFE ground lease business and also paves the way for management to acquire the remaining portion of SAFE that it does not already own.
  • Jacobs Engineering Group (J) is a professional services firm focused on engineering and government services that is in the early stages of transforming its business strategy by divesting several capital-intensive cyclical businesses in favor of asset-light engineering and consulting businesses.  We believe the company is now well-positioned to benefit from several attractive secular trends, including environmental, defense and intelligence spending by government and business customers.
  • Sonos (SONO), a consumer electronics company with proprietary multi-room smart speaker technology, was added to the portfolio on the belief that strong consumer demand for the company’s differentiated product offering plus a multi-year pipeline of upcoming new product introductions are expected to drive shareholder value for the next several years.

SELLS/LIQUIDATIONS

  • Evercore (EVR), a boutique investment bank that provides advisory and wealth management services, was removed from the portfolio due to our belief that shares were fully valued and we were nearing a cyclical peak in demand for the company’s services.
  • Kraton Corporation (KRA), a chemical company that manufactures and sells specialty polymers to various end markets, was removed from the portfolio by virtue of its acquisition by DL Chemical.

Outlook and Positioning

Despite the pickup in volatility over the first few months of 2022, we continue to believe that generally positive fundamentals and low relative valuations support further upside for small/mid cap equities. While near-term price movements and volatility continue to be driven by macroeconomic and geopolitical issues in the short term, we believe business fundamentals will ultimately determine equity values in the long run. Additionally, as the Fed continues its path toward interest rate normalization, and as company fundamentals and valuations become increasingly more important, we believe this development should be beneficial for fundamentally-oriented, active managers like ourselves. As such, we remain optimistic about the prospects for small/mid cap equities going forward, given our views on the overall fundamentals of our individual holdings at this stage in the market cycle. While economic growth may slow globally and even domestically, we continue to believe the U.S. economy is on relatively healthier footing than other markets around the world, which should benefit the more domestically-oriented small/mid cap market. Small/mid caps, which derive the vast majority of their revenues from U.S. sources, may also be less impacted by continued geopolitical turmoil abroad relative to large caps. With that said, we recognize there are certain areas of the market that continue to appear to be stretched in terms of balance sheet quality and valuations, and the small/mid cap market continues to have a high percentage of negative earning companies (roughly one-fifth of constituents). We believe these later cycle conditions, along with the heightened periods of market volatility, favor quality-oriented investors like ourselves and can provide us with additional opportunities to add value on an absolute and relative basis.

Our current positioning is a function of our bottom-up security selection process and our ability to identify what we view as attractive investment candidates, regardless of economic sector definitions. Recent purchases have been spread across industries and are idiosyncratic in nature, as opposed to being tied to an outlook for a particular sector. Overweights in Industrials and Information Technology are mostly a function of the performance of our holdings in these sectors over the past few years. Conversely, we continue to be underweight in Consumer Discretionary, as we have been unable to identify what we consider to be compelling opportunities that fit our discipline given the rising risk profiles as a result of structural headwinds for various brick and mortar businesses. We also continue to be underweight in Real Estate as a result of valuations and structural challenges for various end markets within the sector. Given our focus on long-term business fundamentals, patient investment approach and low portfolio turnover, the strategy’s sector positioning generally does not change significantly from quarter to quarter; however, we may take advantage of periods of volatility by adding selectively to certain companies when appropriate. As always, our focus remains on identifying what we view as attractive, long-term investment opportunities that can create value for shareholders over the next three to five years, which we believe gives us the best opportunity to generate alpha for our clients.

Disclosures

The opinions expressed herein are those of Aristotle Capital Boston, LLC (Aristotle Boston) and are subject to change without notice. Past performance is not indicative of future results. The information provided in this report should not be considered financial advice or a recommendation to purchase or sell any particular security. There is no assurance that any securities discussed herein will remain in an account’s portfolio at the time you receive this report or that securities sold have not been repurchased. The securities discussed may not represent an account’s entire portfolio and, in the aggregate, may represent only a small percentage of an account’s portfolio holdings. The performance attribution presented is of a representative account from Aristotle Boston’s Small/Mid Cap Equity Composite. The representative account is a discretionary client account which was chosen to most closely reflect the investment style of the strategy. The criteria used for representative account selection is based on the account’s period of time under management and its similarity of holdings in relation to the strategy. It should not be assumed that any of the securities transactions, holdings or sectors discussed were or will be profitable, or that the investment recommendations or decisions Aristotle Boston makes in the future will be profitable or equal the performance of the securities discussed herein. Aristotle Boston reserves the right to modify its current investment strategies and techniques based on changing market dynamics or client needs. Recommendations made in the last 12 months are available upon request.

Returns are presented gross and net of investment advisory fees and include the reinvestment of all income. Gross returns will be reduced by fees and other expenses that may be incurred in the management of the account. For example, a 0.5% annual fee deducted quarterly (0.125%) from an account with a ten-year annualized growth rate of 5.0% will produce a net result of 4.4%. Actual performance results will vary from this example.

The Russell 2500 Index is a subset of the Russell 3000® Index representing approximately 10% of the total market capitalization of that index. It includes approximately 2000 of the smallest securities based on a combination of their market cap and current index membership. The Russell 2500 Growth® Index measures the performance of the small/mid cap companies located in the United States that also exhibit a growth probability. The Russell 2500 Value® Index measures the performance of the small/mid cap companies located in the United States that also exhibit a value probability. The volatility (beta) of the composite may be greater or less than the benchmarks. It is not possible to invest directly in these indices.

This presentation is to report on the investment strategies as reported by Aristotle Capital Management, LLC and is for illustrative purposes only. The information contained herein is obtained from multiple sources and believed to be reliable. Information has not been verified by Morgan Stanley Wealth Management, and may differ from documents created by Morgan Stanley Wealth Management. The financial advisor should refer to the Profile. This must be preceded or accompanied by the Morgan Stanley Wealth Management Profile, which you can obtain from the Morgan Stanley Wealth Management Performance Analytics. For additional information on other programs, please speak to Patrick Schussman at Aristotle Capital at (310) 954-8156.

Aristotle Capital Boston, LLC is an independent investment adviser registered under the Investment Advisers Act of 1940, as amended. Registration does not imply a certain level of skill or training. More information about Aristotle Boston, including our investment strategies, fees and objectives, can be found in our Form ADV Part 2, which is available upon request. ACB-2204-21-MSFA

Performance Disclosures


Sources: SS&C Advent, Russell Investments
Composite returns for periods ended March 31, 2022 are preliminary pending final account reconciliation.
*The Aristotle Small/Mid Cap Equity Composite has an inception date of January 1, 2008 at a predecessor firm. During this time, Jack McPherson and Dave Adams had primary responsibility for managing the strategy. Performance starting January 1, 2015 was achieved at Aristotle Boston.
Past performance is not indicative of future results. Performance results for periods greater than one year have been annualized.
Returns are presented gross and net of investment advisory fees and include the reinvestment of all income. Gross returns will be reduced by fees and other expenses that may be incurred in the management of the account. Please see important disclosures enclosed within this document.

Rather than reflect on markets and the performance of our investment strategies (for those interested, please see www.aristotlecap.com for our publications on these matters), this year we would like to share insights on key initiatives within Aristotle1. We hope you come away with refreshed insight into our organization and values.

As we look back on 2021, adapting continued to be top of mind for people around the world and also here at Aristotle. During the year, we prioritized workplace health and safety as our employees settled into a routine with remote/hybrid working environments. Additionally, with over 30 new members joining our firm throughout the year, we remained focused on building a culture of honesty, hard work and integrity. We continued to pursue our purpose of enabling our clients to achieve their individual missions. As a reminder, our six corporate values are shown below:

  • We place our clients’ interests first
  • We act with integrity
  • We seek to achieve excellence through accountability and collaboration
  • We are respectful
  • We empower our employees
  • We value community

In this year’s letter, we highlight key initiatives at our four affiliates and provide an update from the firm’s Diversity, Equity and Inclusion Council and, as well as our Human Resources and Technology departments.

1The term “Aristotle” as a stand-alone refers to Aristotle Capital Management and its affiliates. Aristotle represents a group of affiliated investment advisers that provides equity and fixed income management solutions across a unified platform. Aristotle Capital Management, LLC, Aristotle Capital Boston, LLC, Aristotle Credit Partners, LLC, and Aristotle Atlantic Partners, LLC are independent investment advisers registered under the Investment Advisers Act of 1940, as amended. Registration does not imply a certain level of skill or training.

To read the full letter, please use the link below. 

FOR FINANCIAL ADVISORS ONLY.  NOT FOR PUBLIC DISTRIBUTION.

(All MSCI index returns are shown net and in U.S. dollars unless otherwise noted.)

Markets Review

Global Markets (total return) performed as follows:

Sources: SS&C Advent, Bloomberg
Past performance is not indicative of future results. Aristotle International Equity ADR Composite returns are presented gross and net of investment advisory fees and include the reinvestment of all income. Aristotle Capital Composite returns are preliminary pending final account reconciliation. Please see important disclosures at the end of this document.

After declining in the third quarter of 2021, global equity markets rebounded during the fourth quarter.  Overall, the MSCI ACWI Index climbed 6.68% during the period, which brings its full-year return to 18.54%.  Concurrently, the Bloomberg Global Aggregate Bond Index pulled back 0.67%, which gives the Index a calendar-year return of -4.71%.  In terms of style, value stocks underperformed their growth counterparts during the quarter, with the MSCI ACWI Value Index trailing the MSCI ACWI Growth Index by 0.67%. However, for the full year, the MSCI ACWI Value outperformed the MSCI ACWI Growth by 2.52%.

The MSCI EAFE Index rose 2.69% during the fourth quarter, while the MSCI ACWI ex USA Index gained 1.82%.  Regionally, the U.K. and Europe & Middle East were the strongest performers, while Asia was the weakest.  On a sector basis, nine out of the eleven sectors within the MSCI EAFE Index posted positive returns, led by Utilities, Materials and Consumer Staples.  Conversely, Communication Services, Energy and Real Estate were the worst-performing sectors.

Similar to previous quarters, investors focused on the progress of the global recovery.  Although corporate revenues and earnings continued to rebound during the period, the IMF announced a slight downward revision to its 2021 global real GDP growth projections due to continued supply disruptions and uncertain pandemic dynamics.  These conditions have caused shortages of key inputs, lowered manufacturing activity and fueled inflation across the globe.

In addition to a global shipping crisis and semiconductor shortages, the energy sector also captured numerous headlines as robust demand outpaced supply, causing prices to surge.  After a historic drop in energy consumption in 2020, the global economic recovery and a long and cold winter in the Northern Hemisphere have driven a strong rebound in demand, while the ongoing shift to renewables has impacted production and future investments in fossil fuels.  Although OPEC and countries such as Russia have pledged to boost supply, the energy crunch has highlighted issues in long-term production.  Furthermore, rising energy prices have contributed to an inflation loop as the prices of energy-intensive materials like nickel, steel and silicon have all risen.

Increased inflation, combined with an uncertain recovery, has created policy challenges for central banks.  On one hand, the rhetoric on inflation being “transitory” softened as many central banks took a hawkish approach.  During the quarter, the European Central Bank announced a gradual phaseout of its bond purchase program, while countries like the U.K., Russia and Mexico raised interest rates.  On the other hand, policy in Southeast Asia was largely unchanged, and China announced an easing of its monetary policy that will likely include further cuts to lending rates.

On the COVID front, the Omicron variant became the dominant strain in areas such as the U.K. and the U.S.  The number of new daily cases reached as high as ~1,750,000, the highest reported figure during the pandemic, with Europe and the Americas reporting the greatest number of cases.

Annual Markets Review

In a year filled with uncertainty, global economies proved largely resilient.  Even in the face of supply-chain disruptions and multiple variants of the COVID-19 virus, global recovery continued throughout the period.  Themes from 2020, such as central bank policy decisions and vaccine distribution, persisted.

Although we are happy to report another strong year, the constant twists, turns and pivots of this past year are a reminder of the fragility of the short term. Factors such as the possibility of new variants, the timing of a full recovery, fiscal and monetary policy decisions, and market sentiment are topics better left for reporters. We believe investment managers (and their clients) are best positioned to create lasting value by minimizing distractions and focusing on the long term.

Performance and Attribution Summary

For the fourth quarter of 2021, Aristotle Capital’s International Equity ADR Composite posted a total U.S. dollar return of 4.67% gross of fees (4.56% net of fees), outperforming the MSCI EAFE Index, which returned 2.69%, and the MSCI ACWI ex USA Index, which returned 1.82%.  Please refer to the table below for detailed performance.

Performance (%) 4Q211
Year
3
Years
5
Years
Since
Inception*
Int’l Equity ADR Composite (gross)4.6716.1716.2912.267.99
Int’l Equity ADR Composite (net)4.5615.5815.8111.817.48
MSCI EAFE Index (net)2.6911.2613.539.546.44
MSCI ACWI ex USA Index (net)1.827.8213.179.606.03
*The inception date for the International Equity ADR Composite is June 1, 2013. Past performance is not indicative of future results. Returns are presented gross and net of investment advisory fees and include the reinvestment of all income. Aristotle Capital Composite returns are preliminary pending final account reconciliation. Please see important disclosures at the end of this document.

From a sector perspective, the portfolio’s outperformance relative to the MSCI EAFE Index can be attributed to security selection. Security selection in Information Technology, Financials and Industrials contributed the most to the portfolio’s relative performance.  Conversely, security selection in Consumer Discretionary and Communication Services and a lack of exposure to Utilities detracted from relative return. 

Source: FactSet

Past performance is not indicative of future results. Attribution results are based on sector returns, which are gross of investment advisory fees and include the reinvestment of all income. Please see important disclosures at the end of this document..

Regionally, both security selection and allocation effects were responsible for the portfolio’s outperformance.  Security selection in Europe & Middle East and an overweight in Canada contributed the most to relative performance, while an underweight in Europe & Middle East and security selection in the United Kingdom detracted.

Contributors and Detractors for 4Q 2021

Relative ContributorsRelative Detractors
AccenturePan Pacific International
Brookfield Asset ManagementKDDI
SonyOtsuka Holdings
Dassault SystèmesAIA Group
ExperianCarnival

Accenture, the global IT services and consulting firm, was the top contributor during the quarter. Shares continued their impressive performance as the company reported strong results, benefiting from accelerating digital transformations across all markets and industries—a catalyst we previously identified.  Revenue for every client industry group that Accenture services increased by double digits from the prior year.  Furthermore, the company added 15 Diamond Clients (its most important tier of client) in the first quarter of FY 2022 alone, more than it onboarded for the entirety of FY 2021.  We believe Accenture remains uniquely equipped to capitalize on the continuing trend of compressed digital transformations, where enterprises demand comprehensive digital and cloud transformations in a shorter time period.  What is striking is that Accenture believes only one-third of the industry has implemented compressed transformation, leaving ample runway for further adoption.  In addition, given Accenture’s strong value proposition of providing IT solutions to its long-standing client base of many of the world’s largest companies, we believe it is well positioned to pass on inflationary cost pressures through future price increases, as management intends.

Canada-based alternative asset manager Brookfield Asset Management was also a top contributor during the quarter, as it has continued its fundraising momentum, having raised more than $34 billion in the second half of 2021, and built out significant scale across its private markets offerings. The inflows during the quarter were largely driven by the firm’s flagship funds, including its real estate and infrastructure funds.  Through these funds, Brookfield both develops and operates properties across the globe, as well as infrastructure assets that span utilities, transportation and data centers.  Also positive for Brookfield, carried interest revenue, additional compensation it receives for high-performing investment funds, rose 9% quarter-over-quarter, a testament to its ongoing stronger realizations of incentive fees.  Moreover, the firm has seen sustained outsized demand from institutional investors for its physical asset funds, a catalyst we’ve identified, with management in December expressing its flexibility to potentially increase the future size of these funds.

Pan Pacific International, the Japanese discount and general merchandise retailer, was the quarter’s largest detractor. Operating profits declined more than 30% year-over-year.  This was in part due to lower foot traffic during a rainy season in Japan, coupled with a recently more difficult pandemic environment.  Spending on technology investments, renovations and new store openings also compressed margins.  However, we view these headwinds as temporary, and the investments, renovations and new openings as appropriate capital allocation, and continue to focus on the long-term strength of the business.  Pan Pacific’s Don Quijote stores create a sense of treasure hunt that elicits high entertainment value—a unique business model that we believe will allow for organic market share gains in Japan, as well expansion overseas.  With the company’s demonstrated ability to turn around competitors’ stores, in our opinion, it also stands to benefit from the ongoing conversion of its acquired UNY locations.

AIA Group, a pan-Asian life insurance company headquartered in Hong Kong, was one of the largest detractors for the quarter. Shares declined despite continued improvements in fundamentals and progress further establishing AIA Group’s direct presence in mainland China, a catalyst we previously identified.  AIA Group has benefited from an increasingly technology-enabled and productive agency salesforce; we believe this has helped the company deftly navigate pandemic-related travel restrictions.  In fact, the company’s VONB* advanced 15% in the first nine months of 2021, with all areas outside of Hong Kong exceeding pre-pandemic levels.  In our opinion, the advances in mainland China are more notable than the interim results.  With the recent approval from the China Banking and Insurance Regulatory Commission to begin operations in the Hubei province, AIA Group now has operations in eight provinces, providing what we consider to be a unique platform to further penetrate this increasingly large market.

Recent Portfolio Activity

BuysSells
NoneNone

Consistent with our long-term horizon and low turnover, there were no new purchases or sales completed during the quarter.

Conclusion

As we turn the page on another year, we are reminded of the fleeting nature of headline news.  Our focus is not on factors that will change in the coming months, but rather on the fundamentals of businesses that may persist for years.

Rather than attempting the impossible task of predicting the unpredictable, we remain steadfast in abiding by our investment philosophy and process that have been in place for nearly 25 years.  By utilizing a long-term approach and identifying what we perceive to be high-quality businesses, trading at discounts to our estimates of their intrinsic value, that possess catalysts within management’s control, we believe we can withstand short-term swings and add lasting value for our clients.

Disclosures

*Value of New Business (VONB) is an insurance term for the present value of new business written during a period

The opinions expressed herein are those of Aristotle Capital Management, LLC (Aristotle Capital) and are subject to change without notice. Past performance is not a guarantee or indicator of future results. This material is not financial advice or an offer to buy or sell any product. You should not assume that any of the securities transactions, sectors or holdings discussed in this report were or will be profitable, or that recommendations Aristotle Capital makes in the future will be profitable or equal the performance of the securities listed in this report. The portfolio characteristics shown relate to the Aristotle International Equity ADR strategy. Not every client’s account will have these characteristics. Aristotle Capital reserves the right to modify its current investment strategies and techniques based on changing market dynamics or client needs. There is no assurance that any securities discussed herein will remain in an account’s portfolio at the time you receive this report or that securities sold have not been repurchased. The securities discussed may not represent an account’s entire portfolio and, in the aggregate, may represent only a small percentage of an account’s portfolio holdings. The performance attribution presented is of a representative account from Aristotle Capital’s International Equity ADR Composite. The representative account is a discretionary client account which was chosen to most closely reflect the investment style of the strategy. The criteria used for representative account selection is based on the account’s period of time under management and its similarity of holdings in relation to the strategy. Recommendations made in the last 12 months are available upon request.

Returns are presented gross and net of investment advisory fees and include the reinvestment of all income. Gross returns will be reduced by fees and other expenses that may be incurred in the management of the account. For example, a 0.5% annual fee deducted quarterly (0.125%) from an account with a ten-year annualized growth rate of 5.0% will produce a net result of 4.4%. Actual performance results will vary from this example. Please see important disclosures enclosed within this document.

The MSCI EAFE Index (Europe, Australasia, Far East) is a free float-adjusted market capitalization-weighted index that is designed to measure the equity market performance of developed markets, excluding the United States and Canada. The MSCI EAFE Index consists of the following 21 developed market country indices: Australia, Austria, Belgium, Denmark, Finland, France, Germany, Hong Kong, Ireland, Israel, Italy, Japan, the Netherlands, New Zealand, Norway, Portugal, Singapore, Spain, Sweden, Switzerland and the United Kingdom. The MSCI ACWI captures large and mid cap representation across 23 developed market countries and 25 emerging markets countries. With approximately 3,000 constituents, the Index covers approximately 85% of the global investable equity opportunity set. The MSCI ACWI Growth Index captures large and mid cap securities exhibiting overall growth style characteristics across 23 developed markets countries and 25 emerging markets countries. The MSCI ACWI Value Index captures large and mid cap securities exhibiting overall value style characteristics across 23 developed markets countries and 25 emerging markets countries. The MSCI ACWI ex USA Index captures large and mid cap representation across 22 of 23 developed markets countries (excluding the United States) and 25 emerging markets countries. With over 2,300 constituents, the Index covers approximately 85% of the global equity opportunity set outside the United States. The MSCI Emerging Markets Index is a free float-adjusted market capitalization-weighted index that is designed to measure the equity market performance of emerging markets. The MSCI Emerging Markets Index consists of the following 25 emerging market country indexes: Brazil, Chile, China, Colombia, Czech Republic, Egypt, Greece, Hungary, India, Indonesia, Korea, Kuwait, Malaysia, Mexico, Peru, Philippines, Poland, Qatar, Russia, Saudi Arabia, South Africa, Taiwan, Thailand, Turkey and United Arab Emirates. The S&P 500® Index is the Standard & Poor’s Composite Index of 500 stocks and is a widely recognized, unmanaged index of common stock prices. The Brent Crude Oil Index is a major trading classification of sweet light crude oil that serves as a major benchmark price for purchases of oil worldwide. The MSCI Japan Index is designed to measure the performance of the large and mid cap segments of the Japanese market. With over 250 constituents, the Index covers approximately 85% of the free float-adjusted market capitalization in Japan. The Bloomberg Global Aggregate Bond Index is a flagship measure of global investment grade debt from 28 local currency markets. This multi-currency benchmark includes treasury, government-related, corporate and securitized fixed-rate bonds from both developed and emerging markets issuers. The MSCI United Kingdom Index is designed to measure the performance of the large and mid cap segments of the U.K. market. With nearly 100 constituents, the Index covers approximately 85% of the free float-adjusted market capitalization in the United Kingdom. The MSCI Europe Index captures large and mid cap representation across 15 developed markets countries in Europe. With over 430 constituents, the Index covers approximately 85% of the free float-adjusted market capitalization across the European developed markets equity universe. These indices have been selected as the benchmarks and are used for comparison purposes only. The volatility (beta) of the Composite may be greater or less than the respective benchmarks. It is not possible to invest directly in these indices.

This presentation is to report on the investment strategies as reported by Aristotle Capital Management, LLC and is for illustrative purposes only. The information contained herein is obtained from multiple sources and believed to be reliable. Information has not been verified by Morgan Stanley Wealth Management, and may differ from documents created by Morgan Stanley Wealth Management. The financial advisor should refer to the Profile. This must be preceded or accompanied by the Morgan Stanley Wealth Management Profile, which you can obtain from the Morgan Stanley Wealth Management Performance Analytics. For additional information on other programs, please speak to Patrick Schussman at Aristotle Capital at (310) 954-8156.

Aristotle Capital Management, LLC is an independent registered investment adviser under the Advisers Act of 1940, as amended. Registration does not imply a certain level of skill or training. More information about Aristotle Capital, including our investment strategies, fees and objectives, can be found in our Form ADV Part 2, which is available upon request. ACM-2201-145-MSFA

Performance Disclosures


Composite returns for all periods ended December 31, 2021 are preliminary pending final account reconciliation.
The performance information presented is based on the Aristotle International Equity ADR Composite.
Past performance is not indicative of future results. Performance results for periods greater than one year have been annualized. Returns are presented gross and net of investment advisory fees and include the reinvestment of all income. Gross returns will be reduced by fees and other expenses that may be incurred in the management of the account. For example, a 0.5% annual fee deducted quarterly (0.125%) from an account with a ten-year annualized growth rate of 5.0% will produce a net result of 4.4%. Actual performance results will vary from this example. Please see important disclosures enclosed within this document,

FOR FINANCIAL ADVISORS ONLY. NOT FOR PUBLIC DISTRIBUTION.

(All MSCI index returns are shown net and in U.S. dollars unless otherwise noted.)

Markets Review

Global Markets (total return) performed as follows:

Sources: SS&C Advent, Bloomberg
Past performance is not indicative of future results. Aristotle International Equity ADR Composite returns are presented gross and net of investment advisory fees and include the reinvestment of all income. Aristotle Capital Composite returns are preliminary pending final account reconciliation. Please see important disclosures at the end of this document.

After declining in the third quarter of 2021, global equity markets rebounded during the fourth quarter.  Overall, the MSCI ACWI Index climbed 6.68% during the period, which brings its full-year return to 18.54%.  Concurrently, the Bloomberg Global Aggregate Bond Index pulled back 0.67%, which gives the Index a calendar-year return of -4.71%.  In terms of style, value stocks underperformed their growth counterparts during the quarter, with the MSCI ACWI Value Index trailing the MSCI ACWI Growth Index by 0.67%. However, for the full year, the MSCI ACWI Value outperformed the MSCI ACWI Growth by 2.52%.

The MSCI EAFE Index rose 2.69% during the fourth quarter, while the MSCI ACWI ex USA Index gained 1.82%.  Regionally, the U.K. and Europe & Middle East were the strongest performers, while Asia was the weakest.  On a sector basis, nine out of the eleven sectors within the MSCI EAFE Index posted positive returns, led by Utilities, Materials and Consumer Staples.  Conversely, Communication Services, Energy and Real Estate were the worst-performing sectors.

Similar to previous quarters, investors focused on the progress of the global recovery.  Although corporate revenues and earnings continued to rebound during the period, the IMF announced a slight downward revision to its 2021 global real GDP growth projections due to continued supply disruptions and uncertain pandemic dynamics.  These conditions have caused shortages of key inputs, lowered manufacturing activity and fueled inflation across the globe.

In addition to a global shipping crisis and semiconductor shortages, the energy sector also captured numerous headlines as robust demand outpaced supply, causing prices to surge.  After a historic drop in energy consumption in 2020, the global economic recovery and a long and cold winter in the Northern Hemisphere have driven a strong rebound in demand, while the ongoing shift to renewables has impacted production and future investments in fossil fuels.  Although OPEC and countries such as Russia have pledged to boost supply, the energy crunch has highlighted issues in long-term production.  Furthermore, rising energy prices have contributed to an inflation loop as the prices of energy-intensive materials like nickel, steel and silicon have all risen.

Increased inflation, combined with an uncertain recovery, has created policy challenges for central banks.  On one hand, the rhetoric on inflation being “transitory” softened as many central banks took a hawkish approach.  During the quarter, the European Central Bank announced a gradual phaseout of its bond purchase program, while countries like the U.K., Russia and Mexico raised interest rates.  On the other hand, policy in Southeast Asia was largely unchanged, and China announced an easing of its monetary policy that will likely include further cuts to lending rates.

On the COVID front, the Omicron variant became the dominant strain in areas such as the U.K. and the U.S.  The number of new daily cases reached as high as ~1,750,000, the highest reported figure during the pandemic, with Europe and the Americas reporting the greatest number of cases.

Annual Markets Review

In a year filled with uncertainty, global economies proved largely resilient.  Even in the face of supply-chain disruptions and multiple variants of the COVID-19 virus, global recovery continued throughout the period.  Themes from 2020, such as central bank policy decisions and vaccine distribution, persisted.

Although we are happy to report another strong year, the constant twists, turns and pivots of this past year are a reminder of the fragility of the short term. Factors such as the possibility of new variants, the timing of a full recovery, fiscal and monetary policy decisions, and market sentiment are topics better left for reporters. We believe investment managers (and their clients) are best positioned to create lasting value by minimizing distractions and focusing on the long term.

Performance and Attribution Summary

For the fourth quarter of 2021, Aristotle Capital’s International Equity ADR Composite posted a total U.S. dollar return of 4.67% gross of fees (4.56% net of fees), outperforming the MSCI EAFE Index, which returned 2.69%, and the MSCI ACWI ex USA Index, which returned 1.82%.  Please refer to the table below for detailed performance.

Performance (%) 4Q211
Year
3
Years
5
Years
Since
Inception*
Int’l Equity ADR Composite (gross)4.6716.1716.2912.267.99
Int’l Equity ADR Composite (net)4.5615.5815.8111.817.48
MSCI EAFE Index (net)2.6911.2613.539.546.44
MSCI ACWI ex USA Index (net)1.827.8213.179.606.03
*The inception date for the International Equity ADR Composite is June 1, 2013. Past performance is not indicative of future results. Returns are presented gross and net of investment advisory fees and include the reinvestment of all income. Aristotle Capital Composite returns are preliminary pending final account reconciliation. Please see important disclosures at the end of this document.

From a sector perspective, the portfolio’s outperformance relative to the MSCI EAFE Index can be attributed to security selection. Security selection in Information Technology, Financials and Industrials contributed the most to the portfolio’s relative performance.  Conversely, security selection in Consumer Discretionary and Communication Services and a lack of exposure to Utilities detracted from relative return. 

Source: FactSet

Past performance is not indicative of future results. Attribution results are based on sector returns, which are gross of investment advisory fees and include the reinvestment of all income. Please see important disclosures at the end of this document..

Regionally, both security selection and allocation effects were responsible for the portfolio’s outperformance.  Security selection in Europe & Middle East and an overweight in Canada contributed the most to relative performance, while an underweight in Europe & Middle East and security selection in the United Kingdom detracted.

Contributors and Detractors for 4Q 2021

Relative ContributorsRelative Detractors
AccenturePan Pacific International
Brookfield Asset ManagementKDDI
SonyOtsuka Holdings
Dassault SystèmesAIA Group
ExperianCarnival

Accenture, the global IT services and consulting firm, was the top contributor during the quarter. Shares continued their impressive performance as the company reported strong results, benefiting from accelerating digital transformations across all markets and industries—a catalyst we previously identified.  Revenue for every client industry group that Accenture services increased by double digits from the prior year.  Furthermore, the company added 15 Diamond Clients (its most important tier of client) in the first quarter of FY 2022 alone, more than it onboarded for the entirety of FY 2021.  We believe Accenture remains uniquely equipped to capitalize on the continuing trend of compressed digital transformations, where enterprises demand comprehensive digital and cloud transformations in a shorter time period.  What is striking is that Accenture believes only one-third of the industry has implemented compressed transformation, leaving ample runway for further adoption.  In addition, given Accenture’s strong value proposition of providing IT solutions to its long-standing client base of many of the world’s largest companies, we believe it is well positioned to pass on inflationary cost pressures through future price increases, as management intends.

Canada-based alternative asset manager Brookfield Asset Management was also a top contributor during the quarter, as it has continued its fundraising momentum, having raised more than $34 billion in the second half of 2021, and built out significant scale across its private markets offerings. The inflows during the quarter were largely driven by the firm’s flagship funds, including its real estate and infrastructure funds.  Through these funds, Brookfield both develops and operates properties across the globe, as well as infrastructure assets that span utilities, transportation and data centers.  Also positive for Brookfield, carried interest revenue, additional compensation it receives for high-performing investment funds, rose 9% quarter-over-quarter, a testament to its ongoing stronger realizations of incentive fees.  Moreover, the firm has seen sustained outsized demand from institutional investors for its physical asset funds, a catalyst we’ve identified, with management in December expressing its flexibility to potentially increase the future size of these funds.

Pan Pacific International, the Japanese discount and general merchandise retailer, was the quarter’s largest detractor. Operating profits declined more than 30% year-over-year.  This was in part due to lower foot traffic during a rainy season in Japan, coupled with a recently more difficult pandemic environment.  Spending on technology investments, renovations and new store openings also compressed margins.  However, we view these headwinds as temporary, and the investments, renovations and new openings as appropriate capital allocation, and continue to focus on the long-term strength of the business.  Pan Pacific’s Don Quijote stores create a sense of treasure hunt that elicits high entertainment value—a unique business model that we believe will allow for organic market share gains in Japan, as well expansion overseas.  With the company’s demonstrated ability to turn around competitors’ stores, in our opinion, it also stands to benefit from the ongoing conversion of its acquired UNY locations.

AIA Group, a pan-Asian life insurance company headquartered in Hong Kong, was one of the largest detractors for the quarter. Shares declined despite continued improvements in fundamentals and progress further establishing AIA Group’s direct presence in mainland China, a catalyst we previously identified.  AIA Group has benefited from an increasingly technology-enabled and productive agency salesforce; we believe this has helped the company deftly navigate pandemic-related travel restrictions.  In fact, the company’s VONB* advanced 15% in the first nine months of 2021, with all areas outside of Hong Kong exceeding pre-pandemic levels.  In our opinion, the advances in mainland China are more notable than the interim results.  With the recent approval from the China Banking and Insurance Regulatory Commission to begin operations in the Hubei province, AIA Group now has operations in eight provinces, providing what we consider to be a unique platform to further penetrate this increasingly large market.

Recent Portfolio Activity

BuysSells
NoneNone

Consistent with our long-term horizon and low turnover, there were no new purchases or sales completed during the quarter.

Conclusion

As we turn the page on another year, we are reminded of the fleeting nature of headline news.  Our focus is not on factors that will change in the coming months, but rather on the fundamentals of businesses that may persist for years.

Rather than attempting the impossible task of predicting the unpredictable, we remain steadfast in abiding by our investment philosophy and process that have been in place for nearly 25 years.  By utilizing a long-term approach and identifying what we perceive to be high-quality businesses, trading at discounts to our estimates of their intrinsic value, that possess catalysts within management’s control, we believe we can withstand short-term swings and add lasting value for our clients.

Disclosures

*Value of New Business (VONB) is an insurance term for the present value of new business written during a period

The opinions expressed herein are those of Aristotle Capital Management, LLC (Aristotle Capital) and are subject to change without notice. Past performance is not a guarantee or indicator of future results. This material is not financial advice or an offer to buy or sell any product. You should not assume that any of the securities transactions, sectors or holdings discussed in this report were or will be profitable, or that recommendations Aristotle Capital makes in the future will be profitable or equal the performance of the securities listed in this report. The portfolio characteristics shown relate to the Aristotle International Equity ADR strategy. Not every client’s account will have these characteristics. Aristotle Capital reserves the right to modify its current investment strategies and techniques based on changing market dynamics or client needs. There is no assurance that any securities discussed herein will remain in an account’s portfolio at the time you receive this report or that securities sold have not been repurchased. The securities discussed may not represent an account’s entire portfolio and, in the aggregate, may represent only a small percentage of an account’s portfolio holdings. The performance attribution presented is of a representative account from Aristotle Capital’s International Equity ADR Composite. The representative account is a discretionary client account which was chosen to most closely reflect the investment style of the strategy. The criteria used for representative account selection is based on the account’s period of time under management and its similarity of holdings in relation to the strategy. Recommendations made in the last 12 months are available upon request.

Returns are presented gross and net of investment advisory fees and include the reinvestment of all income. Gross returns will be reduced by fees and other expenses that may be incurred in the management of the account. For example, a 0.5% annual fee deducted quarterly (0.125%) from an account with a ten-year annualized growth rate of 5.0% will produce a net result of 4.4%. Actual performance results will vary from this example. Please see important disclosures enclosed within this document. The MSCI EAFE Index (Europe, Australasia, Far East) is a free float-adjusted market capitalization-weighted index that is designed to measure the equity market performance of developed markets, excluding the United States and Canada. The MSCI EAFE Index consists of the following 21 developed market country indices: Australia, Austria, Belgium, Denmark, Finland, France, Germany, Hong Kong, Ireland, Israel, Italy, Japan, the Netherlands, New Zealand, Norway, Portugal, Singapore, Spain, Sweden, Switzerland and the United Kingdom. The MSCI ACWI captures large and mid cap representation across 23 developed market countries and 25 emerging markets countries. With approximately 3,000 constituents, the Index covers approximately 85% of the global investable equity opportunity set. The MSCI ACWI Growth Index captures large and mid cap securities exhibiting overall growth style characteristics across 23 developed markets countries and 25 emerging markets countries. The MSCI ACWI Value Index captures large and mid cap securities exhibiting overall value style characteristics across 23 developed markets countries and 25 emerging markets countries. The MSCI ACWI ex USA Index captures large and mid cap representation across 22 of 23 developed markets countries (excluding the United States) and 25 emerging markets countries. With over 2,300 constituents, the Index covers approximately 85% of the global equity opportunity set outside the United States. The MSCI Emerging Markets Index is a free float-adjusted market capitalization-weighted index that is designed to measure the equity market performance of emerging markets. The MSCI Emerging Markets Index consists of the following 25 emerging market country indexes: Brazil, Chile, China, Colombia, Czech Republic, Egypt, Greece, Hungary, India, Indonesia, Korea, Kuwait, Malaysia, Mexico, Peru, Philippines, Poland, Qatar, Russia, Saudi Arabia, South Africa, Taiwan, Thailand, Turkey and United Arab Emirates. The S&P 500® Index is the Standard & Poor’s Composite Index of 500 stocks and is a widely recognized, unmanaged index of common stock prices. The Brent Crude Oil Index is a major trading classification of sweet light crude oil that serves as a major benchmark price for purchases of oil worldwide. The MSCI Japan Index is designed to measure the performance of the large and mid cap segments of the Japanese market. With over 250 constituents, the Index covers approximately 85% of the free float-adjusted market capitalization in Japan. The Bloomberg Global Aggregate Bond Index is a flagship measure of global investment grade debt from 28 local currency markets. This multi-currency benchmark includes treasury, government-related, corporate and securitized fixed-rate bonds from both developed and emerging markets issuers. The MSCI United Kingdom Index is designed to measure the performance of the large and mid cap segments of the U.K. market. With nearly 100 constituents, the Index covers approximately 85% of the free float-adjusted market capitalization in the United Kingdom. The MSCI Europe Index captures large and mid cap representation across 15 developed markets countries in Europe. With over 430 constituents, the Index covers approximately 85% of the free float-adjusted market capitalization across the European developed markets equity universe. These indices have been selected as the benchmarks and are used for comparison purposes only. The volatility (beta) of the Composite may be greater or less than the respective benchmarks. It is not possible to invest directly in these indices.

Aristotle Capital Management, LLC is an independent registered investment adviser under the Advisers Act of 1940, as amended. Registration does not imply a certain level of skill or training.  More information about Aristotle Capital, including our investment strategies, fees and objectives, can be found in our Form ADV Part 2, which is available upon request. ACM-2201-145-UBSFA

Performance Disclosures


Composite returns for all periods ended December 31, 2021 are preliminary pending final account reconciliation.
The performance information presented is based on the Aristotle International Equity ADR Composite.
Past performance is not indicative of future results. Performance results for periods greater than one year have been annualized. Returns are presented gross and net of investment advisory fees and include the reinvestment of all income. Gross returns will be reduced by fees and other expenses that may be incurred in the management of the account. For example, a 0.5% annual fee deducted quarterly (0.125%) from an account with a ten-year annualized growth rate of 5.0% will produce a net result of 4.4%. Actual performance results will vary from this example. Please see important disclosures enclosed within this document