Commentary
Corporate Credit 4Q 2022
Summary
U.S. corporate credit markets rallied in the fourth quarter, as credit spreads tightened and interest rates stabilized, bringing a close to a historically difficult year in U.S. bond markets. High yield bonds outperformed in the fourth quarter, as the Bloomberg U.S. Corporate High Yield Bond Index returned 4.17%, bringing its year-to-date return to -11.19%. Investment grade corporate bonds also had a relatively strong quarter, with the Bloomberg U.S. Corporate Bond Index returning 3.63% in the fourth quarter: however, the full-year return of -15.76% marked the Index’s worst calendar year loss since inception. After outperforming in the first nine months of the year, bank loans lagged in the fourth quarter as the Credit Suisse Leveraged Loan Index returned 2.33%, but outperformed high yield bonds and investment grade corporate bonds for the year with a return of -1.06%.
U.S. equities bounced in the fourth quarter with the S&P 500 Index gaining 7.56%, breaking its string of three consecutive quarterly losses and ending 2022 with a loss of 18.11%. Signs of slightly easier financial conditions helped risk assets to rally during the quarter. Inflation remained elevated in the U.S. but showed signs of slowing into year-end with a 7.1% rise in the Consumer Price Index (CPI) for the 12-month period ending in November. This moderation in price increases was partly driven by falling energy costs and a weaker U.S. dollar, as the U.S. Dollar Index (DXY) snapped a string of five quarterly gains, falling 7.5% in the fourth quarter. Adding to the sanguine economic picture, the labor market showed signs of remaining tight with November non-farm payrolls printing above expectations and the unemployment rate remaining at 3.7%, only 0.2% above the cycle low seen earlier in the year.
The Federal Reserve (Fed) took some solace from the better economic data at its December meeting. The central bank raised its benchmark rate by 50 basis points to a range of 4.25% to 4.50%, a slowdown in the pace of hikes after four consecutive three-quarter point increases. However, the Fed pushed back at the idea of a quick pivot in 2023, indicating wage inflation remains a concern and signaling rates could remain higher for longer, as it maintained a terminal rate projection above 5.1%. Outside the U.S., geopolitical risks continued to simmer. The conflict in Ukraine showed no sign of easing, while China’s abrupt pivot on strict COVID measures drove a significant increase in infections, stoking fears of weaker near-term growth.
Market Environment
After a relentless move higher in interest rates in the first nine months of the year, U.S. Treasury yields ended the fourth quarter mixed. The yield curve continued to invert during the quarter, as the yield on the U.S. 2-year note rose roughly 22 basis points and the yield on the U.S. 10-year note rose around 8 basis points, modest moves relative to the first nine months of the year. Putting the fourth quarter’s yield move in perspective, the year-to-date increase in yield on U.S. 2-year and 10-year notes approached 369 and 236 basis points, respectively. The extent of the yield move undermined the overall U.S. bond market, as the Bloomberg U.S. Aggregate Bond Index suffered its worst year on record, dropping 13.01% in 2022.
U.S. corporate bonds benefited from spread compression in the fourth quarter amidst lower overall volatility. High yield bond spreads ended the quarter roughly 83 basis points tighter, as measured by the Bloomberg U.S. Corporate High Yield Bond Index, while investment grade corporate bond spreads ended the quarter roughly 29 basis points tighter, as measured by the Bloomberg U.S. Corporate Bond Index.
New issuance declined sharply in 2022, especially for high yield bonds and bank loans, on the back of higher interest rates and economic uncertainty. The slowdown continued in the fourth quarter, with high yield bond issuance totaling just over $15 billion, bringing the 2022 total to roughly $106 billion, a decline of 78% versus the prior year. Leveraged loan issuance recovered slightly compared to the prior quarter but remained subdued, totaling roughly $47 billion in the fourth quarter and $252 billion for the full year, a 70% decline compared to 2021. Investment grade corporate bond issuance also declined in the fourth quarter but to a lesser extent, as year-to-date issuance fell roughly 17% compared to the prior year.
Retail flows moderated in the fourth quarter, as high yield bond funds experienced inflows after three consecutive quarters of outflows. Fourth quarter inflows totaled nearly $6 billion, but year-to-date outflows from high yield bond funds topped $48 billion, a record annual outflow. Leveraged loan funds experienced outflows during the quarter, bringing the year-to-date total outflow to over $12 billion, a sharp reversal from 2021’s inflows. Investment grade corporate bond fund flows also turned negative into the end of the year, with overall investment grade bond funds experiencing an annual outflow for the first time in a decade.
Within the high yield bond universe, lower-quality bonds underperformed, as ‘B’s (+4.93%) and ‘BB’s (+4.31%) outperformed ‘CCC’s (+0.51%). From an industry perspective within the high yield bond market, Gaming (+9.10%) outperformed while Media & Entertainment (+0.35%) underperformed. Notably, there were no new high yield bond or leveraged loan defaults in the fourth quarter; however, distressed exchanges totaled $1.4 billion. At the end of December, the 12-month trailing, par-weighted U.S. high yield default rate including distressed exchanges rose to 1.65% (0.84% excluding distressed exchanges), well below the long-term historical average of 3.20% (2.90% excluding distressed exchanges).
Performance and Attribution Summary
High Yield Bond
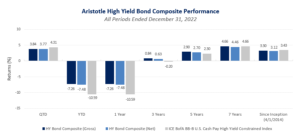
The Aristotle High Yield Bond Composite returned 3.77% net of fees (3.84% gross of fees) in the fourth quarter, underperforming the 4.31% return of the ICE BofA BB-B U.S. Cash Pay High Yield Constrained Index. Sector rotation was the primary detractor from relative performance. Industry allocation and security selection also detracted from relative performance.
Sector rotation detracted from relative performance led by the allocation to cash. The allocations to bank loans and investment grade corporate bonds also detracted from relative performance. Industry allocation detracted from relative performance led by overweights in Media & Entertainment and Energy. This was partially offset by overweights in Lodging & Leisure and Diversified Manufacturing & Construction Machinery. Additionally, security selection detracted from relative performance led by holdings in Media & Entertainment and Lodging & Leisure. This was partially offset by selection in Diversified Manufacturing & Construction Machinery and Building Materials & Home Construction.
| Top Five Contributors | Top Five Detractors |
|---|---|
| Beazer Homes | AMC Networks |
| Cablevision | Lions Gate Capital |
| Howard Hughes | Resolute Investment Management |
| Dana | Gray Television |
| GLP Capital | Air Canada |
Investment Grade Corporate
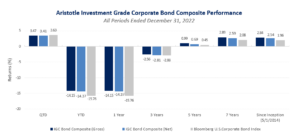
The Aristotle Investment Grade Corporate Bond Composite returned 3.41% net of fees (3.47% gross of fees) in the fourth quarter, underperforming the 3.63% return of the Bloomberg U.S. Corporate Bond Index. Sector rotation was the primary detractor from relative performance, while security selection contributed to relative performance.
Sector rotation detracted from relative performance led by the allocation to cash, which was partially offset by the allocation to high yield bonds. Short duration positioning also detracted from relative performance, which was partially offset by yield curve positioning. Industry allocation had a neutral effect on performance as an underweight in Banking and an overweight in Gaming were offset by an overweight in Real Estate Investment Trusts (REITs) & Real Estate-Related and an underweight in Food, Beverage & Tobacco. Security selection contributed to relative performance led by holdings in Utilities and Technology. This was partially offset by selection in Banking and Energy.
| Top Five Contributors | Top Five Detractors |
|---|---|
| Dell | Ally Financial |
| United Airlines | Wells Fargo |
| PG&E | Baker Hughes |
| Alexandria Real Estate | Federal Realty Investment Trust |
| Discover Financial Services | Energy Transfer |
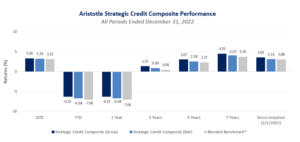
Strategic Credit
The Aristotle Strategic Credit Composite returned 3.26% net of fees (3.39% gross of fees1) in the fourth quarter, outperforming the 3.22% return of the blended benchmark of one-third Bloomberg U.S. High Yield Ba/B 2% Issuer Capped Bond Index, one-third Bloomberg U.S. Intermediate Corporate Bond Index and one-third Credit Suisse Leveraged Loan Index.Sector rotation was the primary contributor to relative performance, while security selection detracted from relative performance.
Sector rotation contributed to relative performance led by an overweight in high yield bonds, which was partially offset by the allocation to cash. Security selection detracted from relative performance led by holdings in Gaming and Finance Companies. This was partially offset by selection in Transportation and Diversified Manufacturing & Construction Machinery. Industry allocation also marginally detracted from relative performance led by an overweight in Energy and an underweight in Paper & Packaging. This was mostly offset by an overweight in Gaming and an underweight in Healthcare.
1As of December 31, 2022, 34% of the Composite consisted of a non-fee-paying account.
| Top Five Contributors | Top Five Detractors |
|---|---|
| Beazer Homes | AMC Networks |
| Tenneco | CSC Holdings |
| United Airlines | Verizon |
| Griffon | Crown Castle |
| American Airlines | Genesis Energy |
Outlook
We believe many of the same themes from the past year continue to be relevant heading into 2023. Inflation remains elevated, the Fed continues to be hawkish, geopolitical risks still linger and volatility persists across asset classes. However, we believe the entry point for U.S. corporate credit is favorable. In our opinion, higher levels of carry and reduced valuations should offer opportunities for positive total return in the new year.
Inflation will remain in focus in 2023 and we expect the Fed to further tighten policy. While inflation has come off its highest levels in recent months, it remains significantly elevated compared to recent history and sits well above the Fed’s target rate. In our opinion, inflation will be particularly sticky for labor and services. We believe this should offset the decline in goods inflation apparent in recent months, as supply-chain issues partially recede and retailers sit on excess inventory. While we may be nearing a peak in the Fed Funds rate in the first half of the year, we believe the Fed may remain restrictive for longer than the current market consensus. The futures market is currently pricing in Fed cuts in the back half of 2023, and we believe these should be priced out, as we expect the Fed to hold rates higher for longer. We also believe the yield curve can invert further, as short-end rates lead the way in response to tighter Fed policy in a weakening economic backdrop.
While we believe the market handled geopolitical risks well over the past year, the risks have not gone away and we expect to see inevitable surprises (e.g., we believe China could deliver a big surprise in either direction). Nonetheless, we believe the result of continued geopolitical uncertainty is a higher overall price environment. Potentially higher commodity prices and supply chain issues due to geopolitical stress could make it more expensive to do business, which we believe may keep prices higher on average than they would otherwise be.
The U.S. economy has been much more resilient than initially expected in the face of rising rates over the past year. The labor market continues to be strong, showing no signs of rolling over into the end of 2022. In turn, a strong labor market has helped to support consumption and spending; however, consumer spending is beginning to shift, as the personal savings rate declines and households increase credit card debt, which swelled by 10% per capita in 2022. This will be an important area to watch heading into 2023, as consumer spending could roll over if the job market begins to falter, increasing the probability of a recession. While we do not expect a sharp downturn, we do think there may be an extended slower growth period ahead with restrictive Fed policy putting downward pressure on consumption.
For U.S. corporate credit markets, our base case scenario in the year ahead is higher risk-free rates and slightly wider credit spreads. Corporate credit market technicals were strong into the end of 2022, but we believe they will be more negative heading into the new year, which could drive spreads wider. Quantitative tightening (QT) will also continue to silently weigh on technicals, but we believe the effect of QT could be offset by fund flows should they reverse in 2023.
We believe U.S. corporate balance sheets remain strong. Many companies have successfully managed maturities over the near term, and we believe the overall corporate credit market can absorb some economic weakness and wider credit spreads. After a sharp slowdown in high yield bond issuance over the past year, we believe supply will pick up in 2023. While the cost of capital has risen significantly, we do not believe there is a major need for capital right now. We believe the companies planning to come to market in 2023 will be in better shape, and the market should be willing to absorb the supply.
Overall, we are cautiously optimistic and expect modestly positive total returns in the new year. Rates can rise further, and credit spreads can widen, but we believe the starting point for markets of higher yields and better valuations provides a cushion. While we expect weaker technicals in the new year, we believe fundamentals remain strong and U.S. corporate credit markets should be able to withstand a mild downturn.
High Yield Bond Positioning
In our high yield portfolios, we remain underweight duration relative to the benchmark and continue to favor credit risk over interest rate risk. We still favor commodity-related industries and credits focused on consumer experiences rather than those focused on consumer goods.
In an inverted yield curve environment, we do not see a reason to give up yield by moving out on the curve. As a result, we still prefer to add credit risk in the front end of the curve. However, we also do not believe investors are being compensated for moving down much further in quality, given credit spreads have continued to tighten.
From an industry perspective, we continued to reduce exposure to industries and credits most affected by a slowdown in consumer spending on goods. For example, we favor experience-related credits in Travel & Leisure over goods-focused credits in Retailers & Restaurants. While we reduced exposure to Building Materials & Home Construction over the past few months, we believe stronger balance sheets can help these credits hold up in a downturn. While currently near neutral in Aerospace and Defense, we will look for opportunities to add exposure in the new year. At the end of the quarter, we held overweights in Transportation, Media & Entertainment and Energy alongside underweights in Technology, Utilities and Cable & Satellite.
Investment Grade Corporate Positioning
In our investment grade corporate bond portfolios, we reduced our short duration positioning, as we look for opportunities to move further out the curve. We continue to take down exposure to cyclical credits, which have not widened much in general, while focusing on adding exposure to what we believe to be higher-quality industries.
While we believe yields can move higher in the coming months, we are comfortable with taking a bit more risk further out on the yield curve and have reduced our duration underweight. We remain overweight ‘BBB’-rated credits. While we kept industry exposure relatively consistent with the end of the third quarter, we continue to focus on what we believe are higher-quality industries.
We moved from an underweight to an overweight in Utilities and remain cautious on Retailers & Restaurants. We are also looking to add exposure to Banking, with credit spreads in the industry widening by more than the overall investment grade corporate market in recent months. While we see value in Automotive & Captive Finance and Metals & Mining in the high yield market, these industries have seen spreads widen only about half as much as the overall market and we remain cautious. At the end of the quarter, we held overweights in Insurance, Finance Companies and REITs & Real Estate-Related alongside underweights in Banking, Retailers & Restaurants and Pharmaceuticals.
Strategic Credit Positioning
In our strategic credit portfolios, we kept overall asset allocation largely unchanged, only slightly increasing an overweight in high yield bonds. We remain underweight bank loans and continue to hold a small duration overweight relative to the blended benchmark. At the industry level, we made similar adjustments to those made in our high yield bond portfolios.
High yield bonds remain the largest sector allocation, while bank loans remain the largest underweight. We still favor shorter duration high yield bonds to bank loans. Looking ahead, we may begin to reduce exposure to investment grade corporate bonds. As of December 31, the strategy was composed of 69.5% high yield bonds, 24.6% investment grade corporate bonds and 4.2% bank loans. Roughly 1.7% was held in cash. We held overweights in Energy, Lodging & Leisure and Finance Companies alongside underweights in Technology, Banking and Healthcare.
Disclosures
All investments carry a certain degree of risk, including the possible loss of principal. Investments are also subject to political, market, currency and regulatory risks or economic developments. There are risks specifically associated with fixed income investments such as interest rate risk and credit risk. Bond values fluctuate in price in response to market conditions. Typically, when interest rates rise, there is a corresponding decline in bond values. This risk may be more pronounced for bonds with longer-term maturities. Credit risk refers to the possibility that the bond issuer will not be able to make principal and interest payments. High yield securities are generally rated lower than investment grade securities and may be subject to greater market fluctuations, increased price volatility, risk of issuer default, less liquidity, or loss of income and principal compared to investment grade securities.
The material is provided for informational and/or educational purposes only and is not intended to be and should not be construed as investment, legal or tax advice and/or a legal opinion. Investors should consult their financial and tax adviser before making investments.
The opinions referenced are as of the date of publication, may be modified due to changes in the market or economic conditions, and may not necessarily come to pass.
Information and data presented has been developed internally and/or obtained from sources believed to be reliable. Aristotle Credit does not guarantee the accuracy, adequacy or completeness of such information.
The opinions expressed herein are those of Aristotle Credit Partners, LLC (Aristotle Credit) and are subject to change without notice. Past performance is not a guarantee or indicator of future results. This material is not financial advice or an offer to buy or sell any product. You should not assume that any of the securities transactions, sectors or holdings discussed in this report are or will be profitable, or that recommendations Aristotle Credit makes in the future will be profitable or equal the performance of the securities listed in this report. The portfolio characteristics shown relate to the Aristotle Credit High Yield Bond strategy, the Aristotle Credit Investment Grade Corporate Bond strategy and the Aristotle Credit Strategic Credit strategy. Not every client’s account will have these characteristics. Aristotle Credit reserves the right to modify its current investment strategies and techniques based on changing market dynamics or client needs. There is no assurance that any securities discussed herein will remain in an account’s portfolio at the time you receive this report or that securities sold have not been repurchased. The securities discussed may not represent an account’s entire portfolio and, in the aggregate, may represent only a small percentage of an account’s portfolio holdings. For a full list of all recommendations made by Aristotle Credit during the last 12 months, please contact us at (949) 681-2100. This is not a recommendation to buy or sell a particular security.
Past performance is not indicative of future results. Performance results for periods greater than one year have been annualized. Composite returns are preliminary pending final account reconciliation. Composite and benchmark returns reflect the reinvestment of income.
Composite returns are presented gross and net of investment advisory fees and include the reinvestment of all income. Gross returns will be reduced by fees and other expenses that may be incurred in the management of the account. Net returns are presented net of actual investment advisory fees and after the deduction of all trading expenses.
Strategic Credit Returns – Composite and benchmark returns reflect the reinvestment of income. Gross returns will be reduced by fees and other expenses that may be incurred in the management of the account. Model Net Performance: Composite returns are presented net of the highest fee charged.
Aristotle Credit Partners, LLC is an independent registered investment adviser under the Advisers Act of 1940, as amended. Registration does not imply a certain level of skill or training. More information about Aristotle Credit, including our investment strategies, fees and objectives, can be found in our Form ADV Part 2, which is available upon request. ACP-2301-33
Sources: SS&C Advent; FTSE
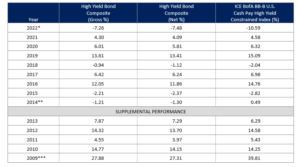
*Composite returns are preliminary pending final account reconciliation.
**2014 is a partial-year period of nine months, representing data from April 1, 2014 to December 31, 2014.
***2009 is a partial-year period of ten months, representing data from March 1, 2009 to December 31, 2009.
Past performance is not indicative of future results. Composite returns are presented gross and net of investment advisory fees and include the reinvestment of all income. Gross returns will be reduced by fees and other expenses that may be incurred in the management of the account. Net returns are presented net of actual investment advisory fees and after the deduction of all trading expenses. The Aristotle High Yield Bond strategy has an inception date of April 1, 2014; however, the strategy initially began at Douglas Lopez’s predecessor firm. A supplemental performance track record from March 1, 2009 to December 31, 2013 (Mr. Lopez’s departure from the firm) is provided. The returns are based on a separate account from the strategy while it was being managed at Doug Lopez’s predecessor firm and performance results are based on custodian data. During this time, Mr. Lopez had primary responsibility for managing the account. Please refer to disclosures at the end of this document.
Sources: SS&C Advent, Bloomberg
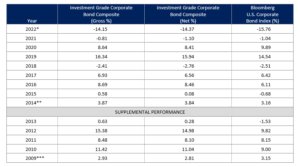
*Composite returns are preliminary pending final account reconciliation.
**2014 is a partial-year period of eight months, representing data from May 1, 2014 to December 31, 2014.
***2009 is a partial-year period of four months, representing data from September 1, 2009 to December 31, 2009.
Past performance is not indicative of future results. Composite returns are presented gross and net of investment advisory fees and include the reinvestment of all income. Gross returns will be reduced by fees and other expenses that may be incurred in the management of the account. Net returns are presented net of actual investment advisory fees and after the deduction of all trading expenses. The primary benchmark was retroactively changed from Bloomberg U.S. Credit Bond Index to Bloomberg U.S. Corporate Bond Index effective March 31, 2017. The Aristotle Investment Grade Corporate Bond strategy has an inception date of May 1, 2014; however, the strategy initially began at Terence Reidt’s predecessor firm. A supplemental performance track record from September 1, 2009 to December 31, 2013 (Mr. Reidt’s departure from the firm) is provided. The returns are based on a separate account from the strategy while it was being managed at Terence Reidt’s predecessor firm and performance results are based on custodian data. During this time, Mr. Reidt had primary responsibility for managing the account. Please refer to disclosures at the end of this document.
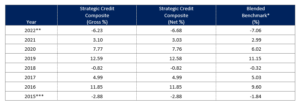
Sources: SS&C Advent, Bloomberg, Credit Suisse
*Blended benchmark represents a blend of blend of 1/3 Bloomberg U.S. High Yield Ba/B 2% Issuer Capped Bond Index, 1/3 Bloomberg U.S. Intermediate Corporate Bond Index and 1/3 Credit Suisse Leveraged Loan Index. The Bloomberg U.S. High Yield Loans Index was retired on September 30, 2016 and was replaced with the Credit Suisse Leveraged Loan Index effective October 1, 2016.
**Composite returns are preliminary pending final account reconciliation.
***2015 is a partial-year period of eleven months, representing data from February 1, 2015 to December 31, 2015.
Past performance is not indicative of future results. Composite and benchmark returns reflect the reinvestment of income. Gross returns will be reduced by fees and other expenses that may be incurred in the management of the account. Model Net Performance: Composite returns are presented net of the highest fee charged. Please refer to disclosures at the end of this document.
The Bloomberg U.S. Aggregate Bond Index is a broad base, market capitalization-weighted bond market index representing intermediate term investment grade bonds traded in the United States. The Index is frequently used as a stand-in for measuring the performance of the U.S. bond market. In addition to investment grade corporate debt, the Index tracks government debt, mortgage-backed securities (MBS) and asset-backed securities (ABS) to simulate the universe of investable bonds that meet certain criteria. In order to be included in the Index, bonds must be of investment grade or higher, have an outstanding par value of at least $100 million and have at least one year until maturity. The Bloomberg U.S. Corporate Bond Index measures the investment grade, fixed-rate, taxable corporate bond market. It includes securities publicly issued by U.S. and non-U.S. industrial, utility and financial issuers that are all U.S. dollar denominated. The Bloomberg U.S. Corporate Bond Index is a component of the Bloomberg U.S. Credit Bond Index. The Bloomberg U.S. Corporate High Yield Bond Index measures the U.S. dollar-denominated, high yield, fixed-rate corporate bond market. Securities are classified as high yield if the middle rating of Moody’s, Fitch and S&P is Ba1/BB+/BB+ or below. Bonds from issuers with an emerging markets country of risk, based on Bloomberg EM country definition, are excluded. The S&P 500 Index is the Standard & Poor’s Composite Index and is a widely recognized, unmanaged index of common stock prices. It is market cap weighted and includes 500 leading companies, capturing approximately 80% coverage of available market capitalization. The ICE Bank of America (ICE BofA) BB-B U.S. Cash Pay High Yield Constrained Index measures the performance of the U.S. dollar-denominated BB-rated and B-rated corporate debt issued in the U.S. domestic market, a fixed coupon schedule and a minimum amount outstanding of $100 million, issued publicly. Allocations to an individual issuer in the Index will not exceed 2%. The Credit Suisse Leveraged Loan Index is a market-weighted index designed to track the performance of the investable universe of the U.S. dollar-denominated leveraged loan market. The Bloomberg U.S. High Yield Ba/B 2% Issuer Capped Bond Index is an issuer-constrained version of the U.S. Corporate High Yield Index that measures the market of U.S. dollar-denominated, non-investment grade, fixed-rate, taxable corporate bonds rated Ba/B. The Index limits the maximum exposure to any one issuer to 2%. The Bloomberg U.S. Intermediate Corporate Bond Index is designed to measure the performance of U.S. corporate bonds that have a maturity of greater than or equal to one year and less than 10 years. The Index includes investment grade, fixed-rate, taxable, U.S. dollar-denominated debt with $250 million or more par amount outstanding, issued by U.S. and non-U.S. industrial, utility and financial institutions. The Consumer Price Index (CPI) is a measure of the average change over time in the prices paid by urban consumers for a market basket of consumer goods and services. The U.S. Dollar Index (DXY) is a measure of the value of the U.S. dollar relative to the value of a basket of currencies of the majority of the United States’ most significant trading partners. Yield to worst (YTW) is a measure of the lowest possible yield that can be received on a bond that fully operates within the terms of its contract without defaulting. The volatility (beta) of the Composites may be greater or less than the indices. It is not possible to invest directly in these indices. Composite and index returns reflect the reinvestment of income.