Commentary
Corporate Credit 3Q 2022
Summary
U.S. corporate credit markets delivered mixed performance in the third quarter as U.S. Treasury yields climbed while corporate credit spreads ended the quarter roughly unchanged despite a further deterioration in risk markets. Bank loans outperformed for the third consecutive quarter, returning 1.19% as measured by the Credit Suisse Leveraged Loan Index. While both high yield bonds and investment grade corporate bonds fell during the quarter, high yield bonds outperformed as the Bloomberg U.S. Corporate High Yield Bond Index returned -0.65% and the Bloomberg U.S. Corporate Bond Index returned -5.06%.
Tighter financial conditions weighed on risk assets in the third quarter as the S&P 500 Index fell 4.88%, which brings its year-to-date return to -15.47% and marks the Index’s first three quarter losing streak since 2009. Persistently high inflation weighed on markets as the U.S. Consumer Price Index (CPI) rose 8.3% year-over-year in August, below its peak of 9.1% in June but still well above the Federal Reserve’s (Fed’s) target range. Growth continued its sluggish pace in the U.S., as real gross domestic product (GDP) fell at an annual rate of 0.6% in the second quarter. However, the labor market remained tight, and while the unemployment rate edged up to 3.7% in August, the labor force participation rate rose to 62.4%, its highest level since March 2022 and the post-pandemic high.
The Fed raised the Fed Funds rate by 75 basis points in September, its third straight hike of that magnitude, bringing its benchmark rate to a range of 3.00% to 3.25%. Fed Chairman Powell signaled the Fed would continue to hike rates into 2023 in order to bring down inflation. In response to the Fed’s hawkish stance and a step up in the pace of quantitative tightening (QT), interest rate and foreign exchange markets repriced sharply amidst increasing volatility in September, as the U.S. Dollar Index (DXY) touched its highest level in two decades. Geopolitical tensions continued to simmer, as Russia’s retaliation against Europe in response to the conflict in Ukraine led to elevated natural gas prices in Europe ahead of the winter months, and tensions between the U.S. and China flared up as Congresswoman Nancy Pelosi visited Taiwan despite protests from the Chinese Deputy Foreign Minister.
Market Environment
U.S. Treasury yields continued to climb in the third quarter, as the yield curve flattened aggressively. The yield on the U.S. 2-year note rose roughly 127 basis points, climbing to the highest level since 2007, while the yield on the U.S. 10-year note rose around 82 basis points. With yields on the long end lagging the short end, the spread between 2-year and 10-year U.S. Treasuries inverted further over the course of the quarter. As a result, U.S. fixed income markets continued to suffer historically large losses with the Bloomberg U.S. Aggregate Bond Index falling 4.75%, bringing its year-to-date loss to 14.61% and putting it on pace for its worst year since inception.
Despite the deterioration in risk sentiment, U.S. corporate credit spreads ended the quarter roughly unchanged with most of the repricing in credit markets driven by rates in the third quarter. High yield bond spreads tightened roughly 17 basis points as measured by the Bloomberg U.S. Corporate High Yield Bond Index, while investment grade corporate bond spreads widened roughly 4 basis points as measured by the Bloomberg U.S. Corporate Bond Index.
Issuance in the high yield bond market continued to slow dramatically in the third quarter with new supply totaling just over $18 billion. The year-to-date total now stands at just over $86 billion, down nearly 78% compared to the same period in 2021. Similarly, issuance in the bank loan market slowed sharply with year-to-date issuance topping $223 billion, roughly 69% below the total in the first nine months of 2021. Investment grade corporate bond issuance also slowed but to a lesser extent as year-to-date issuance topped $1 trillion in September, down roughly 16% compared to the same period last year.
On the demand side, retail flows into both high yield bond funds and leveraged loan funds eroded over the course of the third quarter. High yield bond funds experienced further outflows with the year-to-date total topping a record $53 billion. Leveraged loan funds experienced outflows of more than $13 billion in the third quarter, reducing the year-to-date inflow to just under $2 billion. Bucking the trend, investment grade bond funds saw modest inflows in August and September after seven straight months of outflows to start the year.
Within the high yield bond universe, performance in the third quarter was evenly distributed across quality tiers with lower quality bonds marginally outperforming. ‘CCC’s (-0.42%) outperformed ‘B’s (-0.66%) and ‘BB’s (-0.71%), as high yield bond spreads were roughly unchanged and longer duration bonds underperformed. From an industry perspective, Aerospace & Defense (+3.68%) outperformed while Pharmaceuticals (-9.47%) underperformed. Defaults and distressed transactions rose again after picking up materially in the second quarter following an incredibly quiet 2021. Defaults totaled more than $16 billion during the quarter as the 12-month trailing par-weighted U.S. high yield bond default rate rose to 0.83% at the end of September.
Performance and Attribution Summary
High Yield Bond
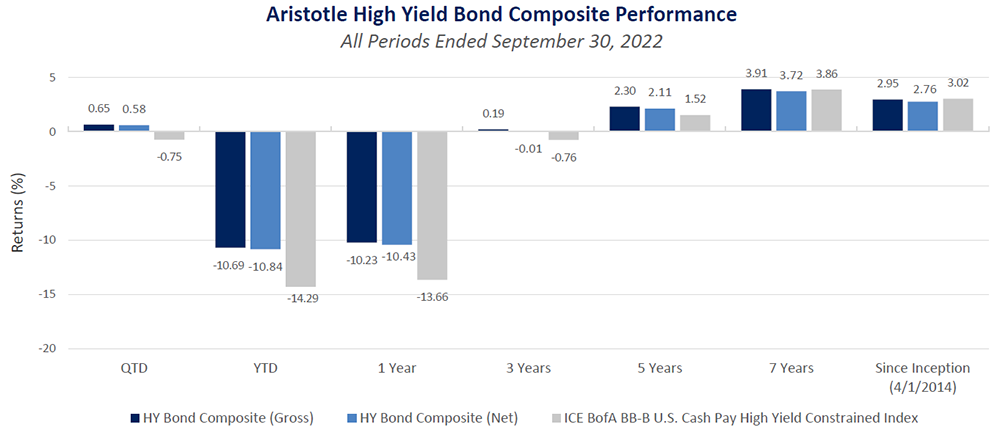
The Aristotle High Yield Bond Composite returned 0.65% gross of fees (0.58% net of fees) in the third quarter, outperforming the -0.75% return of the ICE BofA BB-B U.S. Cash Pay High Yield Constrained Index. Security selection was the primary contributor to relative performance. Industry allocation and sector rotation also contributed to relative performance.
Security selection contributed to relative performance led by holdings in Retailers & Restaurants and Pharmaceuticals. This was only partially offset by security selection in Transportation and Industrials. Industry allocation also contributed to performance led by an overweight in Transportation and an underweight in Pharmaceuticals. This was partially offset by underweights in Aerospace & Defense and Utilities. Additionally, sector rotation contributed to relative performance led by the allocation to cash. There were no offsetting sector rotation detractors.
| Top Five Contributors | Top Five Detractors |
|---|---|
| Bausch Health | Level 3 Financing |
| Carnival | Great Lakes Dredge & Dock |
| Carpenter | G-III Apparel Group |
| Tenneco | Griffon |
| Service Properties Trust | Transdigm |
Investment Grade Corporate
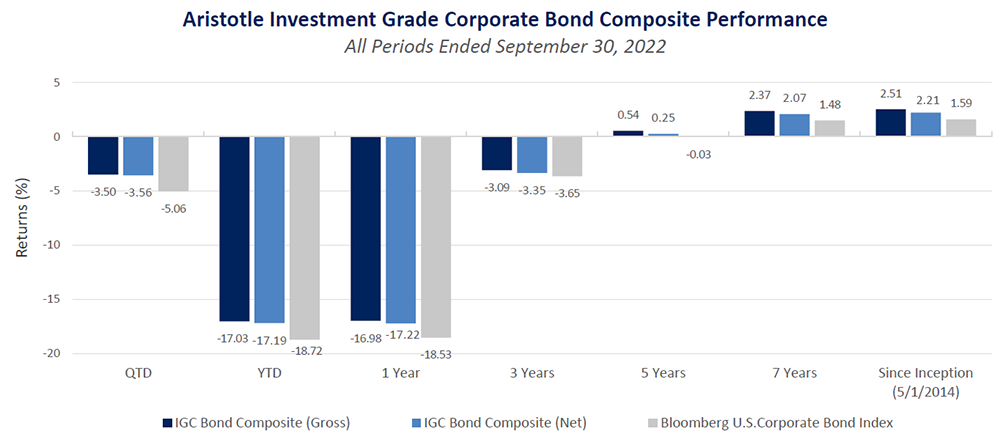
The Aristotle Investment Grade Corporate Bond Composite returned -3.50% gross of fees (-3.56% net of fees) in the third quarter, outperforming the -5.06% return of the Bloomberg U.S. Corporate Bond Index. Security selection was the primary contributor to relative performance, while yield curve positioning was the primary detractor from relative performance.
Security selection contributed to relative performance led by holdings in Banking and Insurance. This was only partially offset by security selection in Transportation and Media & Entertainment. Industry allocation also contributed to performance led by overweights in Insurance and Non-Corporates. This was partially offset by an underweight in Food, Beverage & Tobacco and an overweight in Media & Entertainment. Additionally, sector rotation contributed to relative performance led by the allocation to cash. There were no offsetting sector rotation detractors. Duration positioning also contributed to relative performance and was partially offset by yield curve positioning.
| Top Five Contributors | Top Five Detractors |
|---|---|
| Wells Fargo | Warner Bros. |
| MetLife | United Airlines |
| Western Midstream | Huntsman International |
| T-Mobile | PulteGroup |
| State of California | Targa Resources |
Strategic Credit
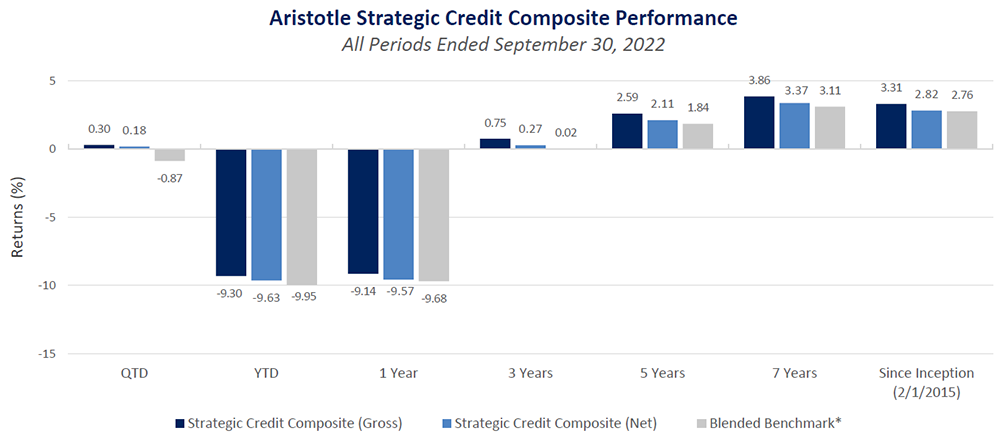
The Aristotle Strategic Credit Composite returned 0.30% gross of fees (0.18% net of fees1) in the third quarter, outperforming the -0.87% return of the blended benchmark of one-third Bloomberg U.S. High Yield Ba/B 2% Issuer Capped Bond Index, one-third Bloomberg U.S. Intermediate Corporate Bond Index and one-third Credit Suisse Leveraged Loan Index.Security selection was the primary contributor to relative performance. Industry allocation and sector rotation also contributed to relative performance.
Security selection contributed to relative performance led by holdings in Banking and Pharmaceuticals. This was only partially offset by security selection in Transportation and Telecommunications. Industry allocation also contributed to performance led by an overweight in Pipelines & Distributors and an underweight in Technology. This was partially offset by underweights in Pharmaceuticals and Diversified Manufacturing & Construction Machinery. Additionally, sector rotation contributed marginally to relative performance led by an underweight in investment grade corporate bonds, which was mostly offset by an underweight in bank loans.
1As of September 30, 2022, 34% of the Composite consisted of a non-fee-paying account.
| Top Five Contributors | Top Five Detractors |
|---|---|
| Tenneco | MGM Resorts |
| Prudential | United Airlines |
| PDC Energy | AMC Networks |
| Cinemark | Beazer Homes |
| Southern Company | Lumen Technologies |
Outlook
A pickup in volatility through the first nine months of 2022 has resulted in a significant repricing across U.S. corporate credit markets. While we believe corporate credit markets are not yet out of the woods as financial conditions continue to tighten, we believe strong underlying fundamentals in certain areas of corporate credit should present opportunities through the end of the year.
The overall macroeconomic backdrop remains downbeat with slower global growth, persistent inflationary pressures, tighter monetary policy and falling earnings estimates. In our opinion, inflation has proven to be non-transitory and stickier than initially expected. We also believe the labor market is still in good shape, which combined with sticky inflation, should give the Fed the green light to continue hiking rates. While we believe U.S. yields can continue to push higher, we think the majority of the repricing in interest rates has already occurred, particularly in the short end of the curve.
In our opinion, the Fed “put” is gone as the central bank has doubled down on its primary goal of getting inflation under control. We believe the Fed is willing to send the economy into a recession as it seeks to tame inflationary pressures. Furthermore, the Fed is taking liquidity out of the market through QT, which we believe is leading to elevated volatility across financial markets. Signs of stress have emerged in pockets of the financial markets, but so far, the Fed has stayed on course. The question financial markets are now asking is if the Fed will stay the course until they hit their policy target or if increasing financial instability will force them to pause or reverse course.
While the top-down picture is fairly grim, we believe the underlying fundamentals of U.S. corporate credit markets remain strong. Our base case scenario is for corporate credit to weaken further, but we do not necessarily expect an outsized increase in credit risk. We remain comfortable with most corporate balance sheets after many companies successfully managed maturities over the past few years. While we believe the overall fundamental credit picture is strong, we also believe the technical side is helping. Issuance so far this year, especially in the high yield bond and leveraged loan markets, has been exceptionally low. With maturities and tenders, the overall market has become smaller, which we believe has helped keep credit spreads in check. That said, we seek to favor higher-quality, liquid corporate bonds over lower-quality, illiquid credit structures, which we believe could be more susceptible to a further selloff in risk assets.
Following the repricing of interest rates over the past nine months, we believe corporate credit offers relatively attractive yield now. The yield-to-worst (YTW) of the Bloomberg U.S. Corporate High Yield Bond Index increased from 4.21% at the end of 2021 to 9.68% at the end of the third quarter, while the YTW of the Bloomberg U.S. Corporate Bond Index rose from 2.33% to 5.69% over that same period. While interest rates could push higher and risk sentiment could deteriorate further, we believe there are opportunities for yield in higher-quality, liquid corporate credit.
High Yield Bond Positioning
In our high yield portfolios, we remain underweight duration relative to the benchmark and added modestly to credit risk in the front end of the curve. We increased exposure to domestic industries with strong cash flow, while reducing exposure to consumer cyclical credits and companies with large European exposure.
We believe the majority of the risk facing corporate credit markets comes from the uncertain macroeconomic backdrop rather than bottom-up credit fundamentals. We are beginning to consider bonds further out on the curve but believe rates could go higher and are willing to wait. That said, we prefer to add higher-quality credits with more interest rate risk rather than lower quality bonds. We do not believe investors are being compensated for moving down in quality given where credit spreads ended the quarter.
From an industry perspective, we reduced credits with significant exposure to the consumer such as housing and retail-related credits. Additionally, we believe Europe faces its own set of increased macroeconomic risks and reduced our exposure to credits with significant exposure to the region. At the end of the quarter, we held overweights in Media & Entertainment, Transportation and Energy alongside underweights in Technology, Telecommunications and Utilities.
Investment Grade Corporate Positioning
In our investment grade corporate bond portfolios, we further reduced a duration underweight while adding what we consider to be lower beta, high-quality credits further out the curve. From an industry perspective, we increased exposure to what we believe to be higher quality industries while keeping overall positioning fairly consistent during the quarter.
We further reduced the duration underweight relative to the benchmark while slightly reducing exposure to non-investment grade bonds. While there is still room for yields to move higher, the extent of the move thus far makes us more comfortable with adding duration. We remain overweight ‘BBB’-rated credits and continue to look for attractive yields across the curve.
While exposure across industries was largely unchanged compared to the prior quarter, we added exposure to what we believe to be higher quality industries. The largest change came from moving Utilities from underweight to slightly overweight. At the end of the quarter, we held overweights in Insurance, Transportation and Real Estate Investment Trusts (REITs) & Real Estate-Related alongside underweights in Banking, Retailers & Restaurants and Pharmaceuticals.
Strategic Credit Positioning
In our strategic credit portfolios, we reduced an underweight in investment grade corporate bonds while decreasing an overweight in high yield bonds. We remain underweight bank loans and increased duration slightly relative to the blended benchmark.
While we reduced exposure over the past quarter, high yield bonds remain the largest sector allocation in our strategic credit portfolios. As of September 30, the strategy was composed of 68.8% high yield bonds, 24.6% investment grade corporate bonds and 4.3% bank loans. Roughly 2.3% was held in cash. We held overweights in Energy, Lodging & Leisure and Automotive & Captive Finance alongside underweights in Technology, Banking and Industrials.
Disclosures
All investments carry a certain degree of risk, including the possible loss of principal. Investments are also subject to political, market, currency and regulatory risks or economic developments. There are risks specifically associated with fixed income investments such as interest rate risk and credit risk. Bond values fluctuate in price in response to market conditions. Typically, when interest rates rise, there is a corresponding decline in bond values. This risk may be more pronounced for bonds with longer-term maturities. Credit risk refers to the possibility that the bond issuer will not be able to make principal and interest payments. High yield securities are generally rated lower than investment grade securities and may be subject to greater market fluctuations, increased price volatility, risk of issuer default, less liquidity, or loss of income and principal compared to investment grade securities.
The material is provided for informational and/or educational purposes only and is not intended to be and should not be construed as investment, legal or tax advice and/or a legal opinion. Investors should consult their financial and tax adviser before making investments.
The opinions referenced are as of the date of publication, may be modified due to changes in the market or economic conditions, and may not necessarily come to pass. Information and data presented has been developed internally and/or obtained from sources believed to be reliable. Aristotle Credit does not guarantee the accuracy, adequacy or completeness of such information. The opinions expressed herein are those of Aristotle Credit Partners, LLC (Aristotle Credit) and are subject to change without notice. Past performance is not a guarantee or indicator of future results. This material is not financial advice or an offer to buy or sell any product. You should not assume that any of the securities transactions, sectors or holdings discussed in this report are or will be profitable, or that recommendations Aristotle Credit makes in the future will be profitable or equal the performance of the securities listed in this report. The portfolio characteristics shown relate to the Aristotle Credit High Yield Bond strategy, the Aristotle Credit Investment Grade Corporate Bond strategy and the Aristotle Credit Strategic Credit strategy. Not every client’s account will have these characteristics. Aristotle Credit reserves the right to modify its current investment strategies and techniques based on changing market dynamics or client needs. There is no assurance that any securities discussed herein will remain in an account’s portfolio at the time you receive this report or that securities sold have not been repurchased. The securities discussed may not represent an account’s entire portfolio and, in the aggregate, may represent only a small percentage of an account’s portfolio holdings. For a full list of all recommendations made by Aristotle Credit during the last 12 months, please contact us at (949) 681-2100. This is not a recommendation to buy or sell a particular security.
Past performance is not indicative of future results. Performance results for periods greater than one year have been annualized. Composite returns are preliminary pending final account reconciliation. Composite and benchmark returns reflect the reinvestment of income.
Composite returns are presented gross and net of investment advisory fees and include the reinvestment of all income. Gross returns will be reduced by fees and other expenses that may be incurred in the management of the account. Net returns are presented net of actual investment advisory fees and after the deduction of all trading expenses.
Strategic Credit Returns – Composite and benchmark returns reflect the reinvestment of income. Gross returns will be reduced by fees and other expenses that may be incurred in the management of the account. Model Net Performance: Composite returns are presented net of the highest fee charged.
Aristotle Credit Partners, LLC is an independent registered investment adviser under the Advisers Act of 1940, as amended. Registration does not imply a certain level of skill or training. More information about Aristotle Credit, including our investment strategies, fees and objectives, can be found in our Form ADV Part 2, which is available upon request.
Sources: SS&C Advent; FTSE
*Composite returns are preliminary pending final account reconciliation.
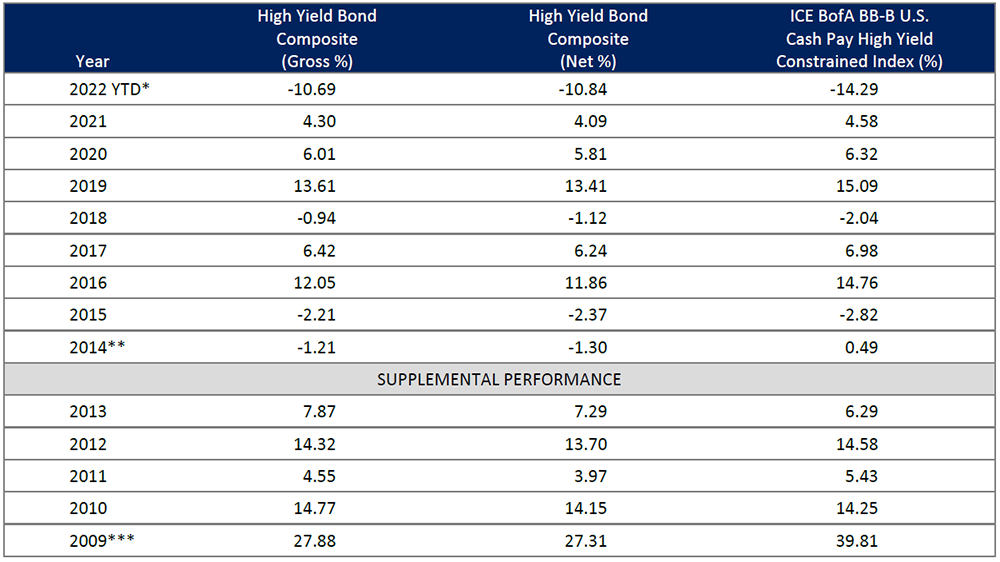
**2014 is a partial-year period of nine months, representing data from April 1, 2014 to December 31, 2014.
***2009 is a partial-year period of ten months, representing data from March 1, 2009 to December 31, 2009.
The Aristotle High Yield Bond strategy has an inception date of April 1, 2014; however, the strategy initially began at Douglas Lopez’s predecessor firm. A supplemental performance track record from March 1, 2009 to December 31, 2013 (Mr. Lopez’s departure from the firm) is provided. The returns are based on a separate account from the strategy while it was being managed at Doug Lopez’s predecessor firm and performance results are based on custodian data. During this time, Mr. Lopez had primary responsibility for managing the account. Past performance is not indicative of future results. Composite returns are presented gross and net of investment advisory fees and include the reinvestment of all income. Gross returns will be reduced by fees and other expenses that may be incurred in the management of the account. Net returns are presented net of actual investment advisory fees and after the deduction of all trading expenses.
Sources: SS&C Advent, Bloomberg
*Composite returns are preliminary pending final account reconciliation.
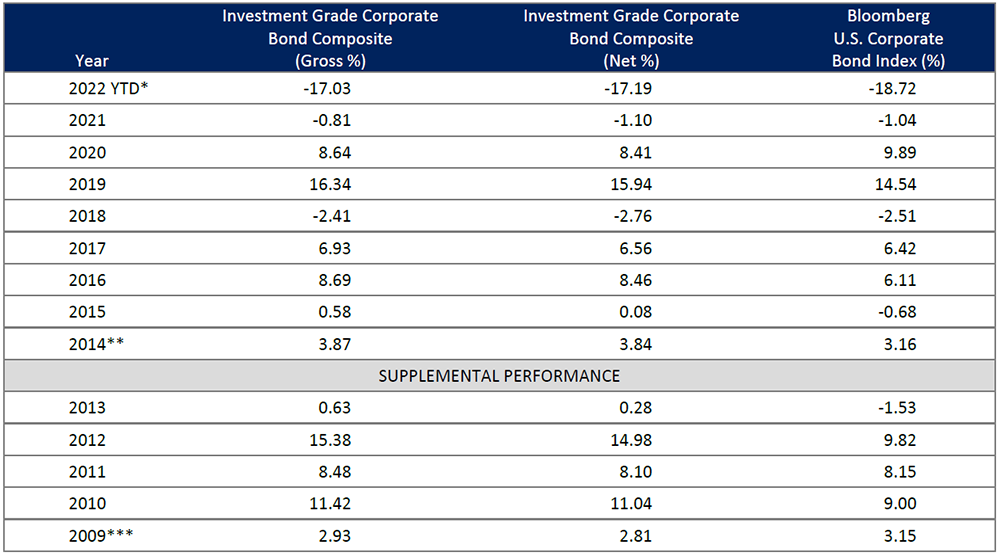
**2014 is a partial-year period of eight months, representing data from May 1, 2014 to December 31, 2014.
***2009 is a partial-year period of four months, representing data from September 1, 2009 to December 31, 2009.
Past performance is not indicative of future results. Composite returns are presented gross and net of investment advisory fees and include the reinvestment of all income. Gross returns will be reduced by fees and other expenses that may be incurred in the management of the account. Net returns are presented net of actual investment advisory fees and after the deduction of all trading expenses. The primary benchmark was retroactively changed from Bloomberg U.S. Credit Bond Index to Bloomberg U.S. Corporate Bond Index effective March 31, 2017. The Aristotle Investment Grade Corporate Bond strategy has an inception date of May 1, 2014; however, the strategy initially began at Terence Reidt’s predecessor firm. A supplemental performance track record from September 1, 2009 to December 31, 2013 (Mr. Reidt’s departure from the firm) is provided. The returns are based on a separate account from the strategy while it was being managed at Terence Reidt’s predecessor firm and performance results are based on custodian data. During this time, Mr. Reidt had primary responsibility for managing the account.
Sources: SS&C Advent, Bloomberg, Credit Suisse
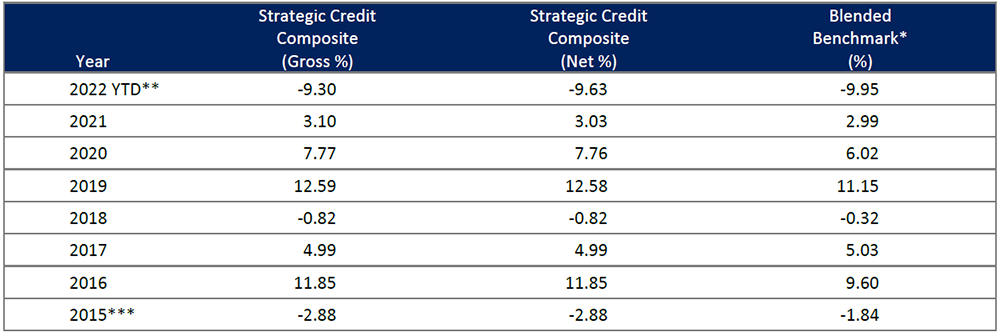
*Blended benchmark represents a blend of blend of 1/3 Bloomberg U.S. High Yield Ba/B 2% Issuer Capped Bond Index, 1/3 Bloomberg U.S. Intermediate Corporate Bond Index and 1/3 Credit Suisse Leveraged Loan Index. The Bloomberg U.S. High Yield Loans Index was retired on September 30, 2016 and was replaced with the Credit Suisse Leveraged Loan Index effective October 1, 2016.
**Composite returns are preliminary pending final account reconciliation.
***2015 is a partial-year period of eleven months, representing data from February 1, 2015 to December 31, 2015.
Past performance is not indicative of future results. Composite and benchmark returns reflect the reinvestment of income. Gross returns will be reduced by fees and other expenses that may be incurred in the management of the account. Model Net Performance: Composite returns are presented net of the highest fee charged.
Aristotle Credit Partners, LLC is an independent registered investment adviser under the Advisers Act of 1940, as amended. Registration does not imply a certain level of skill or training. More information about Aristotle Credit, including our investment strategies, fees and objectives, can be found in our Form ADV Part 2, which is available upon request. ACP-2210-39
The Bloomberg U.S. Aggregate Bond Index is a broad base, market capitalization-weighted bond market index representing intermediate term investment grade bonds traded in the United States. The Index is frequently used as a stand-in for measuring the performance of the U.S. bond market. In addition to investment grade corporate debt, the Index tracks government debt, mortgage-backed securities (MBS) and asset-backed securities (ABS) to simulate the universe of investable bonds that meet certain criteria. In order to be included in the Index, bonds must be of investment grade or higher, have an outstanding par value of at least $100 million and have at least one year until maturity. The Bloomberg U.S. Corporate Bond Index measures the investment grade, fixed-rate, taxable corporate bond market. It includes securities publicly issued by U.S. and non-U.S. industrial, utility and financial issuers that are all U.S. dollar denominated. The Bloomberg U.S. Corporate Bond Index is a component of the Bloomberg U.S. Credit Bond Index. The Bloomberg U.S. Corporate High Yield Bond Index measures the U.S. dollar-denominated, high yield, fixed-rate corporate bond market. Securities are classified as high yield if the middle rating of Moody’s, Fitch and S&P is Ba1/BB+/BB+ or below. Bonds from issuers with an emerging markets country of risk, based on Bloomberg EM country definition, are excluded. The S&P 500 Index is the Standard & Poor’s Composite Index and is a widely recognized, unmanaged index of common stock prices. It is market cap weighted and includes 500 leading companies, capturing approximately 80% coverage of available market capitalization. The ICE Bank of America (ICE BofA) BB-B U.S. Cash Pay High Yield Constrained Index measures the performance of the U.S. dollar-denominated BB-rated and B-rated corporate debt issued in the U.S. domestic market, a fixed coupon schedule and a minimum amount outstanding of $100 million, issued publicly. Allocations to an individual issuer in the Index will not exceed 2%. The Credit Suisse Leveraged Loan Index is a market-weighted index designed to track the performance of the investable universe of the U.S. dollar-denominated leveraged loan market. The Bloomberg U.S. High Yield Ba/B 2% Issuer Capped Bond Index is an issuer-constrained version of the U.S. Corporate High Yield Index that measures the market of U.S. dollar-denominated, non-investment grade, fixed-rate, taxable corporate bonds rated Ba/B. The Index limits the maximum exposure to any one issuer to 2%. The Bloomberg U.S. Intermediate Corporate Bond Index is designed to measure the performance of U.S. corporate bonds that have a maturity of greater than or equal to one year and less than 10 years. The Index includes investment grade, fixed-rate, taxable, U.S. dollar-denominated debt with $250 million or more par amount outstanding, issued by U.S. and non-U.S. industrial, utility and financial institutions. The Consumer Price Index (CPI) is a measure of the average change over time in the prices paid by urban consumers for a market basket of consumer goods and services. The U.S. Dollar Index (DXY) is a measure of the value of the U.S. dollar relative to the value of a basket of currencies of the majority of the United States’ most significant trading partners. Yield to worst (YTW) is a measure of the lowest possible yield that can be received on a bond that fully operates within the terms of its contract without defaulting. The volatility (beta) of the Composites may be greater or less than the indices. It is not possible to invest directly in these indices. Composite and index returns reflect the reinvestment of income.