Commentary
Value Equity WM 3Q 2025
Markets Review
Sources: CAPS CompositeHubTM, Bloomberg
Past performance is not indicative of future results. Aristotle Value Equity WM Composite returns are presented pure gross and net of the maximum wrap fee and include the reinvestment of all income. Pure gross returns do not reflect the deduction of any trading costs or other fees and are supplemental to the net returns. Net returns are calculated by subtracting the highest applicable wrap/SMA fee, which includes trading costs and custodial fees, from the pure gross composite return. (From inception to 12/31/2015, the highest applicable wrap/SMA fee is 3.00% on an annual basis, or 0.75% quarterly. From 1/1/2016 to 12/31/2023, the highest applicable wrap/SMA fee is 2.00% on an annual basis, or 0.50% quarterly and 0.17% monthly from 1/1/2024 to present.) Aristotle Capital Composite returns are preliminary pending final account reconciliation. Please see important disclosures at the end of this document.
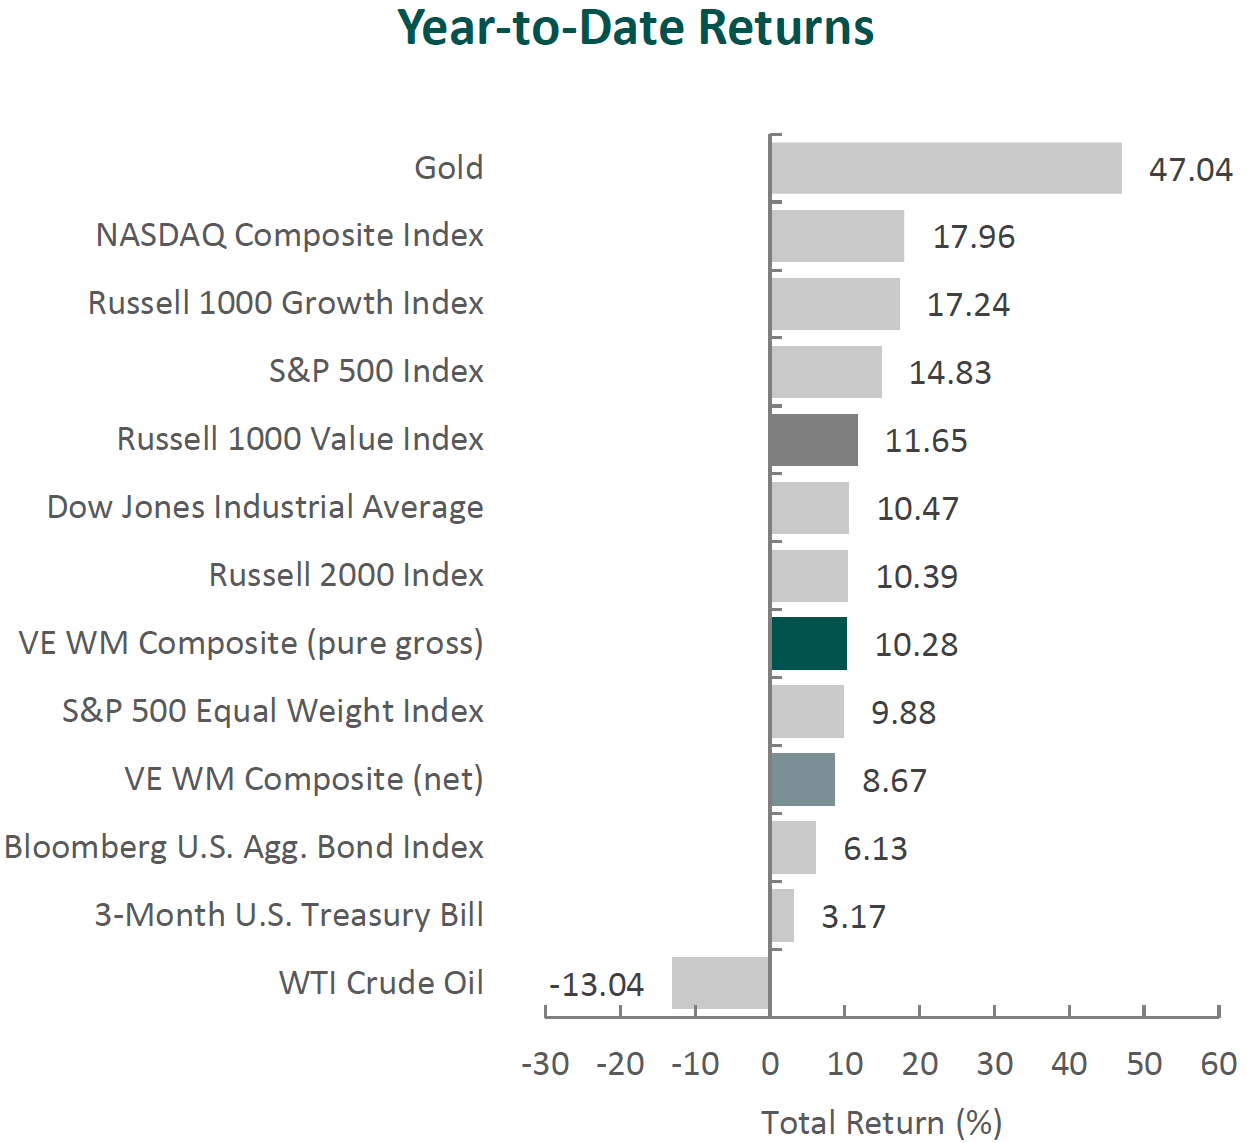
The U.S. equity market continued to climb in the third quarter, with the S&P 500 Index rising 8.12% during the period. Concurrently, bonds also finished higher, as the Bloomberg U.S. Aggregate Bond Index increased 2.03%.
From a style perspective, the Russell 1000 Value Index underperformed its Growth counterpart by 5.18%. On a sector basis, ten out of the eleven sectors within the Russell 1000 Value Index posted positive returns. The best-performing sectors were Communication Services, Utilities and Consumer Discretionary, while Consumer Staples, Real Estate and Financials were the worst.
The U.S. economy rebounded, as real GDP increased by an annual rate of 3.8% in the second quarter, reversing the contraction in the prior quarter—the first in three years. While the headline growth was encouraging, economists caution that the underlying picture may be less robust than it appears. Much of the rebound stemmed from a decline in imports, which the U.S. Bureau of Economic Analysis attributes to the unwinding of a tariff-driven import surge earlier in the year. In effect, lower imports mechanically boosted net exports, temporarily inflating growth figures.
Beyond trade distortions, domestic demand remained steady, supported by consumer spending. However, the labor market showed signs of cooling: job gains slowed in August, and the unemployment rate—while remaining historically low—increased slightly to 4.3%. Consumer confidence weakened sequentially and year-over-year, yet spending resilience suggests households continue to lean on wage growth and accumulated savings.
Inflation data added to the complexity. The Consumer Price Index (CPI) edged higher, keeping inflation above the Federal Reserve’s 2% target. With a combination of still-elevated inflation, softer employment data and rising macroeconomic uncertainty, the FOMC reduced the federal funds rate by 0.25%, bringing the range to 4.00%-4.25%. Policymakers emphasized flexibility, underscoring their “data-dependent” approach amid competing signals.
While uncertainty remained a theme in the Fed’s recent statements, trade-related concerns eased somewhat as the White House announced progress on multiple agreements. In Europe, the U.S. and EU reached a deal under which the EU agreed to pay the U.S. a 15% tariff rate, committed to purchase $750 billion in U.S. energy and pledged $600 billion in new U.S. investments by 2028. Japan also agreed to a baseline 15% tariff on nearly all Japanese imports and committed to purchasing $8 billion annually in U.S. agricultural goods. Even relations with China steadied as President Trump extended the suspension of higher tariffs until November, while U.S. lawmakers visited the country for the first time since 2019.
However, some trade tensions persisted. The Trump Administration announced an additional 25% tariff on Indian imports in response to continued Russian oil purchases, a move that brought Russia, China and India into closer alignment. President Trump also imposed an additional 40% tariff on Brazil as he accused the country of coercing U.S companies to censor speech and turn over sensitive U.S. user data. Meanwhile, in a divided ruling, a U.S. appeals court raised questions about the legal basis for certain tariffs but stayed its order, keeping the measures in effect through mid-October while appeals proceed. The Supreme Court will hear the case on November 5, with the outcome potentially clarifying the scope of executive authority on trade policy.
Corporate America, however, showed resilience. S&P 500 companies reported earnings growth of 11.7% year-over-year, marking the third straight quarter of double-digit expansion. Importantly, over 80% of companies exceeded EPS estimates, despite more than 340 firms citing tariff-related headwinds in their commentary. Earnings strength was broad-based, led by Communication Services, Information Technology and Financials, highlighting the adaptability of U.S. firms even in a volatile trade and policy environment.
Performance and Attribution Summary
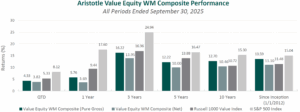
For the third quarter of 2025, Aristotle Capital’s Value Equity WM Composite posted a total return of 4.33% pure gross of fees (3.82% net of fees), underperforming the 5.33% return of the Russell 1000 Value Index and the 8.12% return of the S&P 500 Index. Please refer to the table for detailed performance.
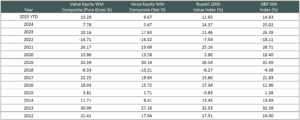
| Performance (%) | 3Q25 | YTD | 1 Year | 3 Years | 5 Years | 10 Years |
|---|---|---|---|---|---|---|
| Value Equity WM Composite (pure gross) | 4.33 | 10.28 | 5.76 | 16.22 | 12.22 | 12.70 |
| Value Equity WM Composite (net) | 3.82 | 8.67 | 3.69 | 13.95 | 10.00 | 10.46 |
| Russell 1000 Value Index | 5.33 | 11.65 | 9.44 | 16.96 | 13.88 | 10.72 |
| S&P 500 Index | 8.12 | 14.83 | 17.60 | 24.95 | 16.47 | 15.30 |
Source: FactSet
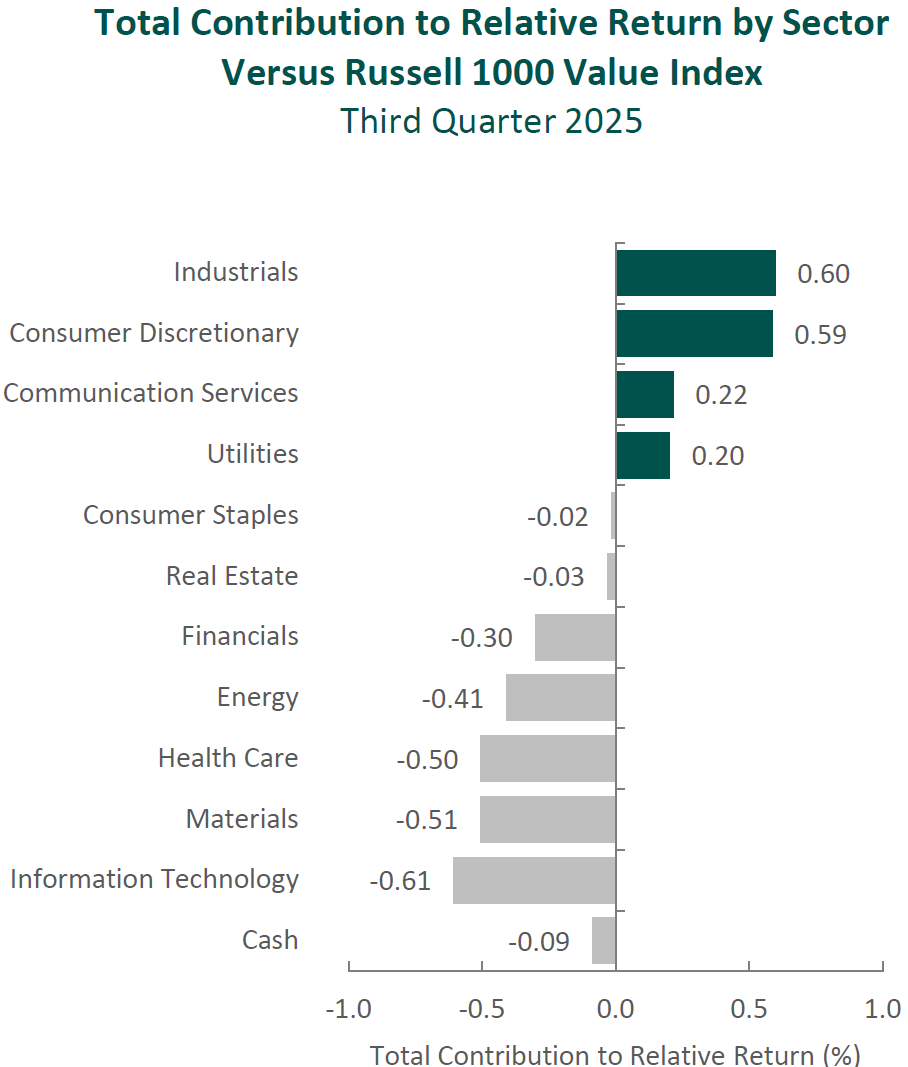
Past performance is not indicative of future results. Sector attribution shows how much of a portfolio’s overall return is directly attributable to stock selection and asset allocation decisions within the portfolio, highlighting which sectors contributed or detracted to the total return. Attribution includes the reinvestment of income. Attribution is presented pure gross of fees and does not include the deduction of all fees and expenses that a client or investor has paid or would have paid. Please refer to the gross and net composite returns included within to understand the overall impact of fees.
The portfolio’s underperformance relative to the Russell 1000 Value Index in the third quarter can be attributed to security selection, as allocation effects had minimal impact. Security selection in Materials, Information Technology and Health Care detracted the most from relative performance. Conversely, security selection in Consumer Discretionary, Industrials and Communication Services contributed. (Relative weights are the result of bottom-up security selection.)
Contributors and Detractors for 3Q 2025
| Relative Contributors | Relative Detractors |
|---|---|
| Sony | Corteva |
| Mitsubishi UFJ Financial | Alcon |
| Martin Marietta Materials | Ameriprise Financial |
| Xcel Energy | Adobe |
| General Dynamics | American International Group |
Corteva, the seed and crop protection company, was the largest detractor. Shares declined in September following confirmed reports that the company will separate its seed and crop protection businesses. While management believes the split will sharpen strategic focus, the market’s initial reaction was negative. We are carefully evaluating how modest dis-synergies may be balanced against potential benefits. Importantly, through August, Corteva had been one of the portfolio’s strongest contributors on the back of continued share gains in seeds and steady performance in crop protection. The company’s Enlist E3 platform has already captured more than 60% of U.S. soybean acres in less than two years, with adoption also expanding in corn. As with any major structural change, we will carefully evaluate the two new businesses within our QVC framework to determine whether they remain compelling investments for the portfolio.
Ameriprise Financial, the asset and wealth manager, was a primary detractor during the quarter. Equity volatility, institutional outflows in Asset Management and slower Advice Wealth Management flows weighed on near-term stock performance—despite record client assets of $1.6 trillion. We view these headwinds as temporary, with advisor productivity, client engagement and asset growth remaining strong. Over our time as shareholders, Ameriprise has consistently executed on its shift toward fee-based, lower capital-intensive financial advice and asset management businesses, and away from insurance. Today, the Advice & Wealth Management and Asset Management segments together account for over 80% of company revenues, supporting a more asset-light, higher-margin business mix. This evolution has freed up significant capital for reinvestment and shareholder returns—$3 billion returned over the past year—with an 85% payout ratio targeted in the second half of 2025. In an environment of heightened volatility and macro uncertainty, Ameriprise’s core offering of trusted, long-term financial advice becomes even more essential. We believe, this, along with a diversified model, disciplined execution and a strong balance sheet, provides management the flexibility to invest in the business while continuing to deliver meaningful returns to shareholders over time.
Aggregates producer Martin Marietta Materials was a top contributor for the period. Strong results were driven by continued pricing strength in aggregates—reflected in a 7.4% year-over-year increase in average selling price—and management’s decision to raise full-year guidance. The company continued its transition toward a higher-margin, aggregate-led model, exemplified by its decision to exit Texas cement operations through a recent asset exchange with Quikrete Holdings. With operations concentrated in structurally advantaged markets such as Texas and the Carolinas—regions benefiting from population growth, data center expansion, energy projects and semiconductor investment—Martin Marietta remains well-positioned for long-term demand. As the largest shipper of crushed stone by rail, the company has a scale-driven cost and distribution advantage that is difficult to replicate. In our view, consistent price increases, conservative capital allocation and focus on critical infrastructure end markets make Martin Marietta a resilient, long-duration holding.
Xcel Energy, one of the largest renewable energy owners among regulated utilities, was a primary contributor during the period. Shares rose after the company announced comprehensive settlements totaling $640 million related to the 2021 Marshall Fire in Colorado, with $350 million of the total to be covered by insurance. Although material, the settlement was well below worst-case estimates and removed a significant legal overhang. Fire risk is a challenge facing all western utilities, and Xcel has taken proactive steps to mitigate exposure. Regulators recently approved a $1.9 billion wildfire mitigation plan in Colorado and a $500 million resiliency plan in Texas, both of which strengthen the grid and reduce liability risk. Looking ahead, we believe Xcel is well-positioned to benefit from rising demand for clean energy and electrification. The company’s five-year capital plan totals $45 billion, much of it directed toward renewable energy projects and electric grid infrastructure to support clean energy, as its service territories offer some of the best wind and solar resources in the country and are supported by state policies accelerating the transition away from coal. We believe these investments will strengthen Xcel’s clean energy leadership, expand its transmission capacity, and support higher normalized earnings and dividends.
Recent Portfolio Activity
| Buys | Sells |
|---|---|
| Synopsys | None |
| Wells Fargo |
During the quarter, we invested in Synopsys and Wells Fargo.
Synopsys, Inc.
Founded in 1986 and headquartered in Mountain View, California, Synopsys is a global leader in electronic design automation (EDA) software and semiconductor IP—mission-critical tools used for chip design and verification. In 2025, the company expanded its capabilities through the acquisition of ANSYS, a leading engineering simulation portfolio and long-term holding in our Value Equity strategy. This acquisition was the primary driver behind Synopsys’ addition to the Value Equity strategy, as it meaningfully broadens the company’s reach from chip-level to system-level design, supporting innovation across industries such as semiconductors, automotive, aerospace and healthcare.
The company partners with leading chipmakers, foundries and system providers to address increasingly complex design challenges. Its end-to-end design platform—spanning logic design, physical implementation, system simulation and verification—is deeply embedded in customer workflows and benefits from high switching costs, reinforcing Synopsys’ position as a critical enabler of next-generation technology.
High-Quality Business
Some of the quality characteristics we have identified for Synopsys include:
- Market leader as one of the “Big Three” in EDA (alongside Cadence and Siemens), with scale and market share in design software and semiconductor IP that few competitors can replicate;
- High recurring revenue base, with more than 80% derived from long-term licensing agreements, supplemented by usage-based components that scale with customer demand, providing stability and strong FREE cash flow generation; and
- A comprehensive semiconductor IP portfolio that complements its EDA tools, deepens customer reliance on Synopsys and supports pricing power.
Attractive Valuation
Based on our estimates of normalized earnings, shares of Synopsys are attractively valued given its leadership in semiconductor design and the transformational potential of the ANSYS acquisition. We believe the broader adoption of “shift-left” design methodologies—which identify and resolve issues earlier in the design cycle, lowering costs and accelerating time to market—will drive long-term demand for Synopsys’ expanded platform.
Compelling Catalysts
Catalysts we have identified for Synopsys, which we believe will cause its stock price to appreciate over our three- to five-year investment horizon, include:
- Synergies from the ANSYS acquisition, which combines chip design and multi-physics simulation into a one-stop digital twin platform and expands cross-selling opportunities;
- Higher revenue as increasing complexity in AI chips, high-performance computing and custom silicon make EDA software even more mission critical and expand its share of semiconductor R&D budgets;
- A strengthening position in semiconductor IP, with growing share in non-processor categories as customers adopt standardized and custom blocks to reduce design costs, enhance efficiency and deepen reliance on Synopsys’ platform; and
- An oligopolistic industry structure that continues to consolidate, enhancing Synopsys’ pricing power and long-term competitive position.
Shares recently pulled back following the combined impact of U.S. export restrictions to China and Intel’s shift into foundry technology investments. In our view, the mission-critical nature of its EDA software, combined with deep customer integration and rising chip design complexity, continues to support our investment thesis.
Wells Fargo & Co.
Headquartered in San Francisco, California, and founded in 1852, Wells Fargo is one of the country’s largest and most established financial institutions. With total assets near $2 trillion, the company provides a wide array of banking and financial solutions across the U.S. and key international markets. Its operations span four primary business segments—Consumer Banking and Lending, Commercial Banking, Corporate and Investment Banking, and Wealth and Investment Management—which serve a diverse client base ranging from individuals and small businesses to multinational corporations and institutional investors.
Historically, Wells Fargo was among the most profitable and efficient major banks, known for its low-cost funding and strong returns on equity and assets. However, a series of consumer-related scandals that came to light in 2016 weighed heavily on its results and reputation, ultimately leading the Federal Reserve to impose a $1.95 trillion limit on the bank’s assets. In June 2025, the Fed lifted that cap, citing significant progress in the firm’s risk management and compliance practices. The removal of this constraint represents a major turning point, enabling the bank to return to balance sheet growth and compete on a more level footing with peers. Under CEO Charlie Scharf (appointed in 2019), management has streamlined the organization, invested in technology and reinforced governance standards—initiatives that, in our view, have strengthened Wells Fargo’s long-term resilience and rebuilt the foundation for sustainable growth.
High-Quality Business
Some of the quality characteristics we have identified for Wells Fargo include:
- A low-cost, stable funding base, with over 80% of liabilities funded by deposits, including a significant portion in non-interest-bearing accounts;
- Improved operating efficiency, driven by meaningful reductions in head count and non-core expenses since 2018;
- Well-diversified revenue profile across key business lines, including lending, investment banking, and wealth and investment management; and
- A demonstrated ability to return capital to shareholders through consistent dividends and substantial share repurchases, now further supported by the lifting of regulatory restrictions.
Attractive Valuation
We believe Wells Fargo’s current stock price is offered at a meaningful discount to our estimate of intrinsic value. With the asset cap now lifted, the bank is poised to pair renewed balance sheet growth with improved operating leverage and disciplined cost control. While share repurchases may moderate as capital is redeployed to support asset growth, we expect continued strength in dividend returns along with incremental improvements in fee income and efficiency. In our view, these factors should support a higher level of normalized earnings over our investment time horizon.
Compelling Catalysts
Catalysts we have identified for Wells Fargo, which we believe will cause its stock price to appreciate over our three- to five-year investment horizon, include:
- The lifting of the Federal Reserve’s $1.95 trillion asset cap, which removes a major growth constraint and enables Wells Fargo to expand its balance sheet for the first time since 2018;
- Continued recovery in wealth management and investment banking revenues as brand perception strengthens and client engagement deepens;
- Expansion of fee-based businesses and the opportunity to recapture market share across core lending and advisory services;
- Enhanced capital return to shareholders through higher dividends and sustained share repurchases, supported by normalized regulatory requirements; and
- Improved operating leverage and earnings potential following years of restructuring, strategic investment in technology and disciplined cost control.
Conclusion
A core tenet of our investment philosophy is the commitment to understanding businesses with a long-term perspective. This discipline is especially critical during periods of heightened uncertainty, when macroeconomic events can dominate headlines. At Aristotle Capital, we believe one of the distinguishing strengths of our investment process is that we do not reactively reposition portfolios based on near-term developments. Instead, we maintain our focus on business fundamentals. We are convinced that it is fundamentals that ultimately drive long-term shareholder value. As such, we continue to attentively study what we believe are high-quality companies with sustainable competitive advantages poised to unlock value over full market cycles.
The opinions expressed herein are those of Aristotle Capital Management, LLC (Aristotle Capital) and are subject to change without notice. Past performance is not a guarantee or indicator of future results. This material is not financial advice or an offer to purchase or sell any product. You should not assume that any of the securities transactions, sectors or holdings discussed in this report were or will be profitable, or that recommendations Aristotle Capital makes in the future will be profitable or equal the performance of the securities listed in this report. The portfolio characteristics shown relate to the Aristotle Value Equity strategy. Not every client’s account will have these characteristics. Aristotle Capital reserves the right to modify its current investment strategies and techniques based on changing market dynamics or client needs. There is no assurance that any securities discussed herein will remain in an account’s portfolio at the time you receive this report or that securities sold have not been repurchased. The securities discussed may not represent an account’s entire portfolio and, in the aggregate, may represent only a small percentage of an account’s portfolio holdings. The performance attribution presented is of a representative account from Aristotle Capital’s Value Equity strategy. The representative account is a discretionary client account which was chosen to most closely reflect the investment style of the strategy. The criteria used for representative account selection is based on the account’s period of time under management and its similarity of holdings in relation to the strategy. Recommendations made in the last 12 months are available upon request.
Composite returns are presented pure gross and net of the maximum wrap fee and include the reinvestment of all income. Pure gross returns do not reflect the deduction of any trading costs or other fees and are supplemental to the net returns. Net returns are calculated by subtracting the highest applicable wrap/SMA fee, which includes trading costs and custodial fees, from the pure gross composite return. (From inception to 12/31/2015, the highest applicable wrap/SMA fee is 3.00% on an annual basis, or 0.75% quarterly. From 1/1/2016 to 12/31/2023, the highest applicable wrap/SMA fee is 2.00% on an annual basis, or 0.50% quarterly and 0.17% monthly from 1/1/2024 to present.)
All investments carry a certain degree of risk, including the possible loss of principal. Investments are also subject to political, market, currency and regulatory risks or economic developments. International investments involve special risks that may in particular cause a loss in principal, including currency fluctuation, lower liquidity, different accounting methods and economic and political systems, and higher transaction costs. These risks typically are greater in emerging markets. While Large-capitalization companies may have more stable prices than smaller, less established companies, they are still subject to equity securities risk. In addition, large-capitalization equity security prices may not rise as much as prices of equity securities of small-capitalization companies. Securities of small- and medium-sized companies tend to have a shorter history of operations and be more volatile and less liquid. Value stocks can perform differently from the market as a whole and other types of stocks. The material is provided for informational and/or educational purposes only and is not intended to be and should not be construed as investment, legal or tax advice and/or a legal opinion. Investors should consult their financial and tax adviser before making investments. The opinions referenced are as of the date of publication, may be modified due to changes in the market or economic conditions, and may not necessarily come to pass. Information and data presented has been developed internally and/or obtained from sources believed to be reliable. Aristotle Capital does not guarantee the accuracy, adequacy or completeness of such information.
Aristotle Capital Management, LLC is an independent registered investment adviser under the Advisers Act of 1940, as amended. Registration does not imply a certain level of skill or training. More information about Aristotle Capital, including our investment strategies, fees and objectives, can be found in our ADV Part 2, which is available upon request. ACM-2510-95
Sources: CAPS CompositeHubTM, Russell Investments, Standard & Poor’s
Composite returns for all periods ended September 30, 2025 are preliminary pending final account reconciliation.
Past performance is not indicative of future results. The information provided should not be considered financial advice or a recommendation to purchase or sell any particular security or product. Performance results for periods greater than one year have been annualized.
The Aristotle Value Equity WM Composite has an inception date of 10/1/1979. As of 1/1/2024, the Composite was renamed from the Value Equity Wrap Composite and the inception date was updated to 1/1/2012. This update was implemented to align the start date of the composite track record with the start date of the current decision maker. Performance achieved by the firm prior to that date is available upon request.
Composite returns are presented pure gross and net of the maximum wrap fee and include the reinvestment of all income. Pure gross returns do not reflect the deduction of any trading costs or other fees and are supplemental to the net returns. Net returns are calculated by subtracting the highest applicable wrap/SMA fee, which includes trading costs and custodial fees, from the pure gross composite return. (From inception to 12/31/2015, the highest applicable wrap/SMA fee is 3.00% on an annual basis, or 0.75% quarterly. From 1/1/2016 to 12/31/2023, the highest applicable wrap/SMA fee is 2.00% on an annual basis, or 0.50% quarterly and 0.17% monthly from 1/1/2024 to present.)
The Russell 1000® Value Index measures the performance of the large cap value segment of the U.S. equity universe. It includes those Russell 1000 Index companies with lower price-to-book ratios and lower expected growth values. The S&P 500® Index is the Standard & Poor’s Composite Index of 500 stocks and is a widely recognized, unmanaged index of common stock prices. The S&P 500 Equal Weight Index is designed to be the size-neutral version of the S&P 500. It includes the same constituents as the cap-weighted S&P 500, but each company in the S&P 500 Equal Weight Index is allocated the same weight at each quarterly rebalance. The Russell 1000® Growth Index measures the performance of the large cap growth segment of the U.S. equity universe. It includes those Russell 1000 companies with higher price-to-book ratios and higher forecasted growth values. The Russell 2000® Index measures the performance of the small cap segment of the U.S. equity universe. The Russell 2000 Index is a subset of the Russell 3000® Index representing approximately 10% of the total market capitalization of that index. It includes approximately 2,000 of the smallest securities based on a combination of their market cap and current index membership. The Dow Jones Industrial Average® is a price-weighted measure of 30 U.S. blue-chip companies. The Index covers all industries except transportation and utilities. The NASDAQ Composite Index measures all NASDAQ domestic and international based common type stocks listed on The NASDAQ Stock Market. The NASDAQ Composite includes over 3,000 companies, more than most other stock market indexes. The Bloomberg U.S. Aggregate Bond Index is an unmanaged index of domestic investment grade bonds, including corporate, government and mortgage-backed securities. The WTI Crude Oil Index is a major trading classification of sweet light crude oil that serves as a major benchmark price for oil consumed in the United States. The 3-Month U.S. Treasury Bill is a short-term debt obligation backed by the U.S. Treasury Department with a maturity of three months. The Consumer Price Index is a measure of the average change over time in the prices paid by urban consumers for a market basket of consumer goods and services. The volatility (beta) of the Composite may be greater or less than its respective benchmarks. It is not possible to invest directly in these indices.