


Commentary
Value Equity WM 2Q 2026
Markets Review
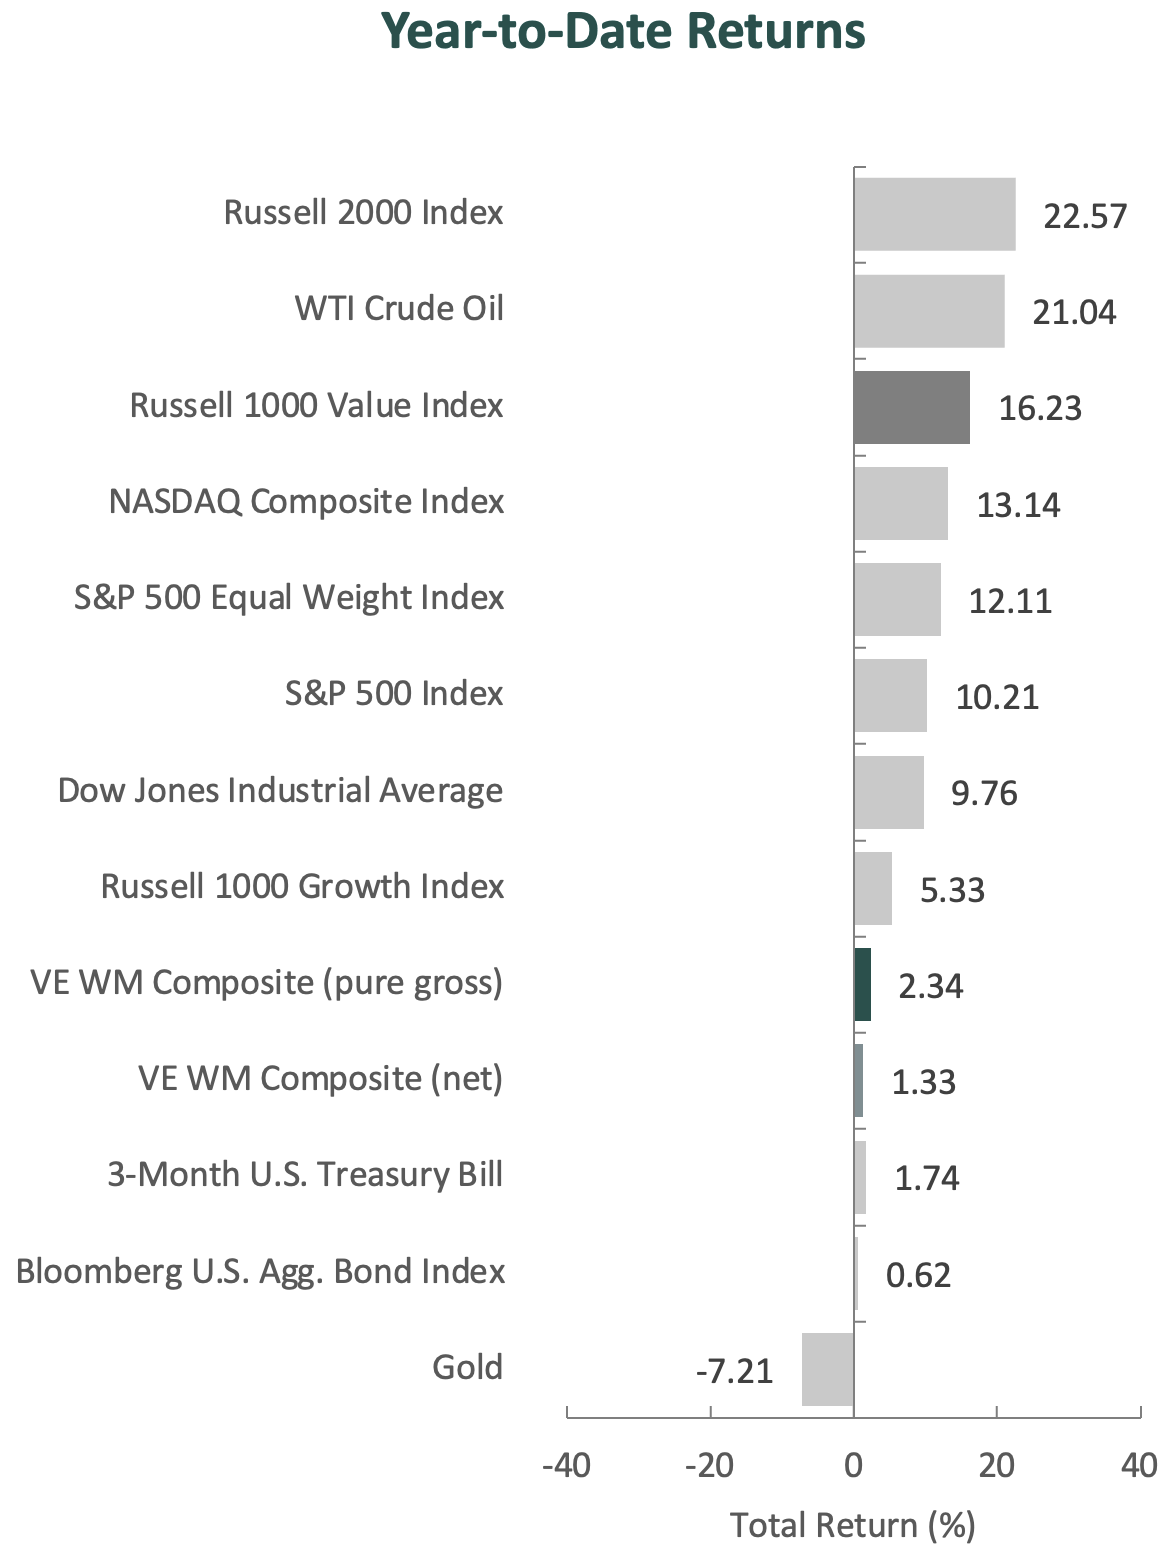
Sources: CAPS CompositeHubTM, Bloomberg
Past performance is not indicative of future results. Aristotle Value Equity WM Composite returns are presented pure gross and net of the maximum wrap fee and include the reinvestment of all income. Pure gross returns do not reflect the deduction of any trading costs or other fees and are supplemental to the net returns. Net returns are calculated by subtracting the highest applicable wrap/SMA fee, which includes trading costs and custodial fees, from the pure gross composite return. (From inception to 12/31/2015, the highest applicable wrap/SMA fee is 3.00% on an annual basis, or 0.75% quarterly. From 1/1/2016 to 12/31/2023, the highest applicable wrap/SMA fee is 2.00% on an annual basis, or 0.50% quarterly and 0.17% monthly from 1/1/2024 to present.)Please see important disclosures at the end of this document.
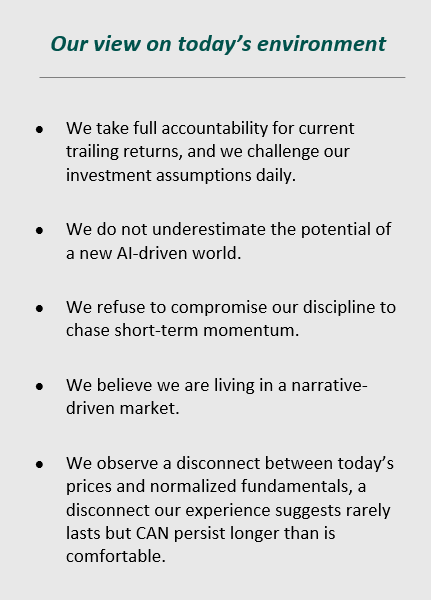
When capital is rushing away from resilient, predictable franchises to crowd into unpredictable, uncertain and yet-to-be-proven themes, it may create a headwind for our strategy. As speculative enthusiasm intensifies and capital becomes increasingly concentrated, those headwinds can grow considerably. And the more indiscriminate the inflows into those speculative areas, the more pronounced those headwinds become.
But we are not standing still. We are eagerly accumulating what in our view are durable quality companies at valuations we believe to be attractive.
The Scale of the Spending Firehose – From Processing Units to Memory Chips
A big part of recent underperformance is underexposure to spending on the data center ecosystem:
- Much of today’s AI spending is going into short-lived data center hardware (three- to five-year economic life), especially processors and memory, rather than permanent infrastructure.
- In the U.S., there are roughly 4,000 existing data centers. Today, there are almost 3,000 more planned or under construction. This spending has created extreme bottlenecks, first in processing and then in memory, driving extraordinary scarcity profits.
- For the first two years of this cycle, Nvidia stood directly in front of the firehose, absorbing a point-blank blast of capital that took pre-tax cash flow from $8 billion in 2023 to an estimated $250 billion in 2026.
- The firehose has pivoted to memory, as Micron’s pre-tax cash flow is estimated to rise from $2.5 billion in 2023 to approximately $100 billion in FY26 and $200 billion in FY27 — year to date through June 30, Micron had the largest weight in the Russell 1000 Value Index and was up approximately 300%, contributing nearly 20% of the Index’s return.
- These are real earnings, but they are scarcity earnings, and when supply catches up, we believe pricing, earnings, and valuations will normalize.
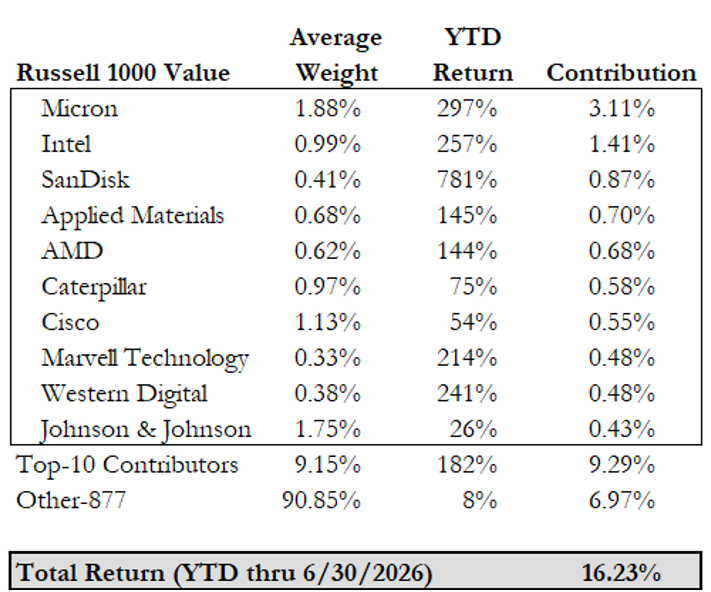
Source: Factset
K Shaped: Wall Street Asset Owners and Main Street Consumers
But most businesses sit outside the AI data center ecosystem, and many are struggling:
- The broader construction industry is facing its toughest environment since the Global Financial Crisis.
- High rates have frozen housing activity, with turnover at its lowest level since the early 1990s.
- The average U.S. home age is now a record 44 years old.
- The average first-time homebuyer age is now 40, up from 32 in 2016.
- In short, AI infrastructure is booming, but much of the real economy is not (sidenote: social and political consequences may follow).
Quality: Three Archetypes
We remain focused on Quality fundamentals, Valuations we believe are attractive, and Catalysts controlled by management teams with a long-term strategic plan (“QVC”).
When we explain that our investment process starts with “quality,” clients often balk. After all, what active manager doesn’t “seek high quality?” Fair point. But like beauty, quality is in the eye of the beholder, and we see three kinds: Transient, Conventional and Durable.
- Transient Quality looks exceptional at the peak, with scarcity-driven pricing power, margin expansion, and high returns on capital that Wall Street often mistakes for permanent economics. But there is no cartel; supply eventually catches up, prices normalize and, once investors realize what has happened, significant valuation resets can occur. Consider memory technology companies today.
- Conventional Quality still has powerful brands, customer loyalty, incumbency advantages, and ecosystem lock-in – but the old moats are eroding. Digital advertising, ecommerce, private label, low barriers to entry, and AI disruption have made many of these franchises less structurally resilient than they once were.
- Durable Quality is where we are most energized, because scarcity is permanent rather than cyclical (or at least less so). These businesses can raise prices ahead of inflation for years without impairing volume, protected by natural monopolies, geology, irreplaceable infrastructure, essentiality, regulation, or deliberate scarcity. Consider businesses like luxury goods, regulated utilities, and mission-critical technology solutions, or specialty data providers, unique ingredient producers, and transportation platforms.
Performance and Attribution Summary
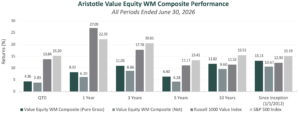
For the second quarter of 2026, Aristotle Capital’s Value Equity WM Composite posted a total return of 4.36% pure gross of fees (3.85% net of fees), underperforming the 13.84% return of the Russell 1000 Value Index and the 15.20% return of the S&P 500 Index. Please refer to the table for detailed performance.
| Performance (%) | 2Q26 | YTD | 1 Years | 3 Years | 5 Years | 10 Years |
|---|---|---|---|---|---|---|
| Value Equity WM Composite (pure gross) | 4.36 | 2.34 | 8.32 | 11.03 | 6.40 | 11.82 |
| Value Equity WM Composite (net) | 3.85 | 1.33 | 6.20 | 8.86 | 4.28 | 9.60 |
| Russell 1000 Value Index | 13.84 | 16.23 | 27.09 | 17.78 | 11.17 | 11.52 |
| S&P 500 Index | 15.20 | 10.21 | 22.33 | 20.61 | 13.41 | 15.51 |
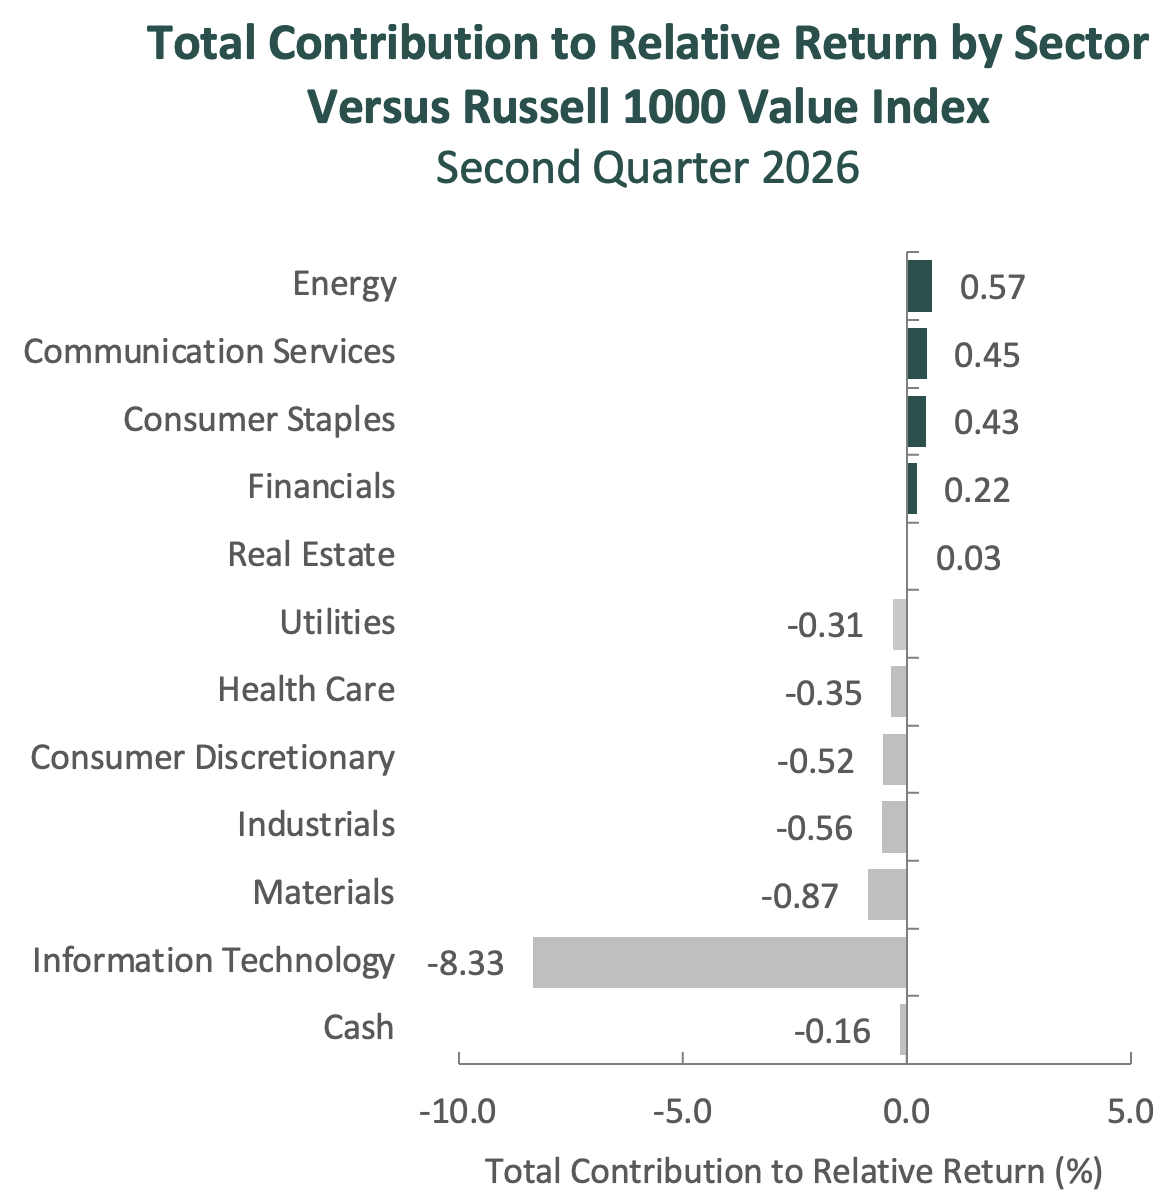
Source: FactSet
Past performance is not indicative of future results. Sector attribution shows how much of a portfolio’s overall return is directly attributable to stock selection and asset allocation decisions within the portfolio, highlighting which sectors contributed or detracted to the total return. Attribution includes the reinvestment of income. Attribution is presented pure gross of fees and does not include the deduction of all fees and expenses that a client or investor has paid or would have paid. Please refer to the gross and net composite returns included within to understand the overall impact of fees.
The portfolio’s underperformance relative to the Russell 1000 Value Index in the second quarter can be attributed to security selection, while allocation effects contributed. Security selection in Information Technology and Industrials, as well as an overweight in Materials, detracted the most from relative performance. Conversely, an overweight in Information Technology, an underweight in Energy, and security selection in Communication Services contributed. (Relative weights are the result of bottom-up security selection.)
Contributors and Detractors for 2Q 2026
| Relative Contributors | Relative Detractors |
|---|---|
| Qualcomm | TotalEnergies |
| Microchip Technology | Autodesk |
| Alphabet | Verizon |
| PNC Financial Services | Corteva |
| Mitsubishi UFJ Financial | Motorola Solutions |
Relative contributors and detractors are based on attribution total effect and exclude benchmark securities not held in the portfolio.
Corteva, the seed and crop protection company, was one of the largest detractors during the period. While fundamentals remained healthy, with first-quarter FREE cash flow supported by strength in both Seed and Crop Protection, the stock lagged a sharply rising market as investors focused on Corteva’s more tempered outlook for the balance of the year. The management team cited potential second-half headwinds from tariffs, higher oil-related input costs, farmer fuel expenses, and competitive crop protection pricing in Latin America and Asia. We believe the market also weighed the near-term complexity of Corteva’s planned fourth-quarter separation into New Corteva and Vylor, including potential dis-synergies from operating two public companies. Nevertheless, our investment thesis remains intact. Farmers continue to adopt Corteva’s latest hybrids, varieties, and premium crop protection technologies, supporting Corteva’s margin expansion. Meanwhile, the company’s R&D-led innovation, disciplined cost management, and path toward net royalty income should enhance its long-term competitive position. Management has remained steadfast in returning shareholder value, with $500 million of share repurchases in the first half of the year. Finally, Corteva remains opportunistic as exemplified by its partnership with FMC Corporation to expand its product and technology portfolio.
Motorola Solutions, the provider of mission-critical communications and security systems, was one of the largest detractors during the quarter. Shares declined as higher memory and supply chain costs weighed on near-term margin expectations. While these factors affected near-term results, they do not change our long-term thesis. At the core of the company is its land mobile radio business, which provides the communication backbone used by police, fire, and emergency responders – particularly during natural disasters or other high-stress situations when commercial networks may become congested or unavailable. These systems are deeply embedded in public safety agencies, where reliability, control, and resiliency are non-negotiable, and customer relationships are often supported by long-term service agreements, predictable equipment refresh cycles, and decades of trust. Importantly, Motorola is using this installed base to broaden its platform, integrating radios with video security, body-worn cameras, and command center software to help agencies unify voice, video, and data across public safety workflows. The company is also expanding its capabilities through acquisitions such as Silvus Technologies, which adds secure wireless communications technology used in defense, unmanned systems, and other demanding environments. We believe these opportunities, together with a continued shift toward higher-margin software and recurring services, should support improved profitability and FREE cash flow generation over our three- to five-year investment horizon.
Qualcomm, a leading semiconductor and communications technology company, was the largest contributor for the quarter. Shares recovered as management indicated that the inventory adjustments and production constraints resulting from higher memory costs were progressing largely as expected and that handset revenues from Chinese customers were expected to reach a bottom. As we noted last quarter, we believed these headwinds to be cyclical rather than structural and did not alter our long-term investment thesis. The company also continued to make progress on its long-term strategy of evolving from a handset-centric company into a broader provider of connected computing technologies. Automotive revenue reached another record high, while Internet of Things (IoT) and newer businesses such as AI-enabled PCs, industrial applications, and data center computing continue to represent a growing portion of the company and remain central to its long-term diversification strategy. We believe Qualcomm’s technologies will continue to benefit as connectivity expands across devices and AI workloads increasingly extend from the cloud to the edge, supporting Qualcomm’s ability to generate strong levels of FREE cash flow in the long run.
Alphabet, the parent company of Google and YouTube, was a primary contributor during the period. We initiated our position in the first quarter of 2025, when investors were concerned that generative AI tools would fundamentally alter search behavior and erode Google’s advertising franchise. Since then, Alphabet has continued to demonstrate the strength of its ecosystem and the resilience of its core businesses. Google Search has remained strong, with AI-powered features increasing user engagement while supporting advertising growth, and Google Cloud has continued to benefit from robust enterprise demand for AI infrastructure and services. Importantly, Alphabet appears increasingly capable of monetizing these new experiences in a manner consistent with its historical strengths, through advertising, distribution, and integration across a broad user base rather than relying solely on paid subscriptions. YouTube also remains well-positioned to benefit from continued growth in advertising and subscription revenues, including YouTube TV, as consumers continue to shift away from traditional cable. In addition, while we continue to monitor regulatory risk, capital intensity, and changes in search behavior, recent execution reinforces our view that Alphabet remains a high-quality business with durable competitive advantages and multiple avenues for long-term value creation.
Recent Portfolio Activity
| Buys | Sells |
|---|---|
| Autodesk | Atmos Energy |
| Edwards Lifesciences | Danaher |
During the quarter, we sold our positions in Atmos Energy and Danaher and purchased Autodesk and Edwards Lifesciences.
We first invested in Atmos Energy, the largest fully regulated natural gas-only utility in the U.S., in the first quarter of 2022. We were attracted to the company’s strong balance sheet, constructive regulatory environment across its service territories, and significant opportunity to invest in infrastructure modernization projects. During our holding period, Atmos benefited from ongoing system replacement programs, population growth in its key markets, and supportive rate mechanisms that allowed it to earn attractive returns on invested capital. While we continue to view Atmos as a high-quality business, we believe many of the catalysts identified at purchase have either been realized or are well underway. Looking ahead, we expect the company’s growth plan to require a significantly higher level of equity capital than in prior investment cycles. As a result, we elected to exit our position and redeploy the proceeds into Autodesk, which we believe offers a more compelling investment opportunity.
We first invested in Danaher, a company focused on biotechnology, life sciences and diagnostics, in the second quarter of 2016, attracted by its disciplined capital allocation, differentiated operating culture, and consistent FREE cash flow generation. The business is distinguished by a portfolio of market-leading franchises and a high mix of recurring consumables revenue tied to a large installed base. Its differentiated operating culture, anchored by the Danaher Business System (DBS), has historically enabled the company to be a highly effective acquirer, consistently integrating new businesses, expanding margins, and driving strong FREE cash flow generation. Over our decade-long holding period, Danaher successfully transformed itself from a diversified industrial company into a more focused healthcare business. This evolution included the spinoffs of Fortive, Envista, and Veralto, as well as the acquisition and integration of key assets such as Pall, Cepheid, and Cytiva. The company also increased the contribution from recurring revenue and workflow-based solutions embedded in customer operations, which contributed to the durability and predictability of the business.
More recently, as Danaher has shifted further into more complex, innovation-driven end markets, the application of DBS appears to be less differentiated than it was in Danaher’s traditional manufacturing-oriented businesses. Success in these new end markets is increasingly driven by scientific innovation, faster product cycles, and more specialized customer requirements. At the same time, increased scale and a more centralized organizational structure appear to be limiting flexibility at the business unit level, reducing the speed and effectiveness with which opportunities can be pursued. While we continue to view Danaher as a high-quality business, we believe much of our original investment thesis has now been realized, with fewer company-specific catalysts ahead. Accordingly, we elected to exit the position and redeploy the proceeds into what we view as a more attractive opportunity in Edwards Lifesciences.
Autodesk, Inc.
Headquartered in Northern California and founded in 1982, Autodesk produces software that allows companies to design and model their products and/or projects. The company is the global industry standard for computer-aided design in the architecture, engineering, and construction industry (AEC). Autodesk’s millions of subscribers rely on its software to design and model buildings, manufactured products, animated films, and video games. The company’s four segments are AEC (~48% of net sales), its iconic software AutoCAD (~27%), Manufacturing (~20%), and Media and Entertainment (M&E) (~5%).
Autodesk primarily sells its software on a subscription basis, having discontinued perpetual license sales of most standalone products in 2016. As part of the move to subscription licensing, Autodesk replaced its product suite with three streamlined “Industry Collections” focused on AEC, Manufacturing and M&E.
In recent years, the AEC industry has increasingly sought to resolve the inefficiencies that arise when many parties are needed to complete a building project. Autodesk has been at the cutting edge of enabling improvement through innovation and promoting the use of open standards, or open building information modeling (BIM), which allows for all relevant building data to be processed virtually in a 3D model and shared across stakeholders. Importantly, Autodesk’s leadership in ensuring the interoperability of its software with that of competitors increases collaboration and productivity among architects, engineers and contractors—an attractive value proposition for its customers.
High-Quality Business
Some of the quality characteristics we have identified for Autodesk include:
- Brand power, as AutoCAD is one of the most recognizable products in the industry;
- Leading market share in AEC software, where Autodesk’s BIM platform has reinforced its position as the industry standard;
- Large and loyal installed base of over six million users across more than 180 countries;
- Stable business model with a high degree of recurring revenue (97% of total) and significant FREE cash flow generation; and
- Substantial switching costs and pricing power that stem from its advanced solutions, network effects and the time (often many years) it requires for a professional to master Autodesk software.
Attractive Valuation
We believe shares of Autodesk are attractively valued given our estimates of normalized earnings. In our view, the market underappreciates Autodesk’s ability to sustain double-digit revenue growth while maintaining high levels of profitability, with operating margins of approximately 40%. Supported by pricing initiatives, strong customer retention and a highly recurring revenue model, we believe the shares do not fully reflect the company’s long-term earnings power and ability to generate FREE cash flow.
Compelling Catalysts
Catalysts we have identified for Autodesk, which we believe will cause its stock price to appreciate over our three- to five-year investment horizon, include:
- Expanding adoption of BIM, 3D modeling and construction coordination tools as customers increasingly seek to improve collaboration and productivity across complex projects, driving greater utilization of Autodesk’s software portfolio;
- Benefits from its multi-year go-to-market modernization initiative, including greater automation of renewals through direct billing and auto-renew capabilities, allowing sales resources to focus on growth opportunities rather than maintenance activities;
- Increased monetization through tiered offerings and consumption-based pricing initiatives, which should support higher average selling prices over time; and
- Continued market share gains across its core AEC and Manufacturing software businesses.
Edwards Lifesciences Corporation
Headquartered in Irvine, California, Edwards Lifesciences is a global leader in structural heart disease therapies, developing and commercializing medical devices used to treat advanced cardiovascular conditions. The company is best known for its leadership in transcatheter aortic valve replacement (TAVR), a minimally invasive procedure that allows physicians to replace diseased heart valves without open-heart surgery. By reducing the invasiveness, recovery time and risk associated with traditional surgical valve replacement, TAVR has significantly expanded the number of patients eligible for treatment and accelerated adoption across the structural heart market.
We have followed Edwards for many years as both a leading structural heart company and a competitor to Medtronic’s CoreValve platform. Over the last decade, Edwards effectively “bet the company” on TAVR technology and successfully established its Sapien platform as one of the leading transcatheter heart valve systems globally while maintaining a meaningful presence in surgical aortic valve replacement (SAVR). Today, TAVR represents the core of Edwards’ business and is supported by a large global installed base, extensive physician training and extensive long-term clinical evidence, reinforcing its position as a standard of care for aortic stenosis.
Beyond TAVR, Edwards is expanding into transcatheter mitral and tricuspid therapies (TMTT), which represent a significantly larger but more underpenetrated market opportunity. The company is also investing in adjacent cardiovascular technologies, supported by continued investment in research and development, targeted acquisitions, and substantial FREE cash
flow generation.
High-Quality Business
Some of the quality characteristics we have identified for Edwards Lifesciences include:
- Leadership in transcatheter heart valve technologies, particularly TAVR, where the company’s Sapien platform is widely regarded as a gold standard among physicians;
- High barriers to entry, driven by clinical data, physician training requirements and regulatory approvals, which create meaningful switching costs once devices are adopted in practice;
- A strong innovation-driven culture, supported by consistent investment in R&D and a track record of developing next-generation cardiovascular therapies; and
- A focused strategy centered on structural heart disease, allowing for deep expertise and a comprehensive product portfolio across aortic, mitral and tricuspid valve therapies.
Attractive Valuation
While the TAVR market is more developed, we believe both the continued expansion of this franchise and the scaling contribution from newer mitral and tricuspid therapies are not fully reflected in the current stock price. As these businesses continue to scale and adoption broadens, we expect continued improvement in operating performance and FREE cash flow generation over our investment horizon.
Compelling Catalysts
Catalysts we have identified for Edwards Lifesciences, which we believe will cause its stock price to appreciate over our three- to five-year investment horizon, include:
- Higher TAVR procedure volumes, driven by increasing penetration across symptomatic and asymptomatic patient populations, ongoing clinical data supporting use in additional indications, expanding physician adoption, and continued share gains relative to surgical valve replacement surgery (SAVR);
- Broader adoption of TMTT valve therapies, which we believe represent a market opportunity significantly larger than TAVR over time;
- Expansion into adjacent cardiovascular technologies, including heart failure monitoring and treatment, supported by internal development and targeted acquisitions; and
- Continued deployment of substantial FREE cash flow into internal innovation, targeted acquisitions and shareholder returns, supported by a strong balance sheet and meaningful net cash position.
Conclusion
We believe markets are extrapolating the earnings of today’s AI infrastructure beneficiaries far into the future and treating Transient Quality as though it were durable. While artificial intelligence and its enabling technologies are undoubtedly important, history suggests that no investment theme enjoys an uninterrupted run forever. Capital eventually chases diminishing returns, valuations become overly extended, and investors begin to rediscover quality businesses outside the market’s narrow focus. Cycles don’t end because the underlying technology disappears—they end because expectations and prices become disconnected from what is normal.
We are not dismissing AI, nor are we waiting passively for the market to change. We are using this dislocation to upgrade the portfolio toward what we believe to be Durable Quality businesses, purchased at valuations that better reflect normalized fundamentals. In periods like this, discipline can feel uncomfortable, but history suggests that prices and fundamentals eventually reconnect. Our objective is to ensure that when they do, our clients own businesses with the durability, pricing power, and compounding potential to create value well beyond the current cycle.
The opinions expressed herein are those of Aristotle Capital Management, LLC (Aristotle Capital) and are subject to change without notice. Past performance is not a guarantee or indicator of future results. This material is not financial advice or an offer to purchase or sell any product. You should not assume that any of the securities transactions, sectors or holdings discussed in this report were or will be profitable, or that recommendations Aristotle Capital makes in the future will be profitable or equal the performance of the securities listed in this report. The portfolio characteristics shown relate to the Aristotle Value Equity strategy. Not every client’s account will have these characteristics. Aristotle Capital reserves the right to modify its current investment strategies and techniques based on changing market dynamics or client needs. There is no assurance that any securities discussed herein will remain in an account’s portfolio at the time you receive this report or that securities sold have not been repurchased. The securities discussed may not represent an account’s entire portfolio and, in the aggregate, may represent only a small percentage of an account’s portfolio holdings. The performance attribution presented is of a representative account from Aristotle Capital’s Value Equity Strategy. The representative account is a discretionary client account which was chosen to most closely reflect the investment style of the strategy. The criteria used for representative account selection is based on the account’s period of time under management and its similarity of holdings in relation to the strategy. Recommendations made in the last 12 months are available upon request.
Composite returns are presented pure gross and net of the maximum wrap fee and include the reinvestment of all income. Pure gross returns do not reflect the deduction of any trading costs or other fees and are supplemental to the net returns. Net returns are calculated by subtracting the highest applicable wrap/SMA fee, which includes trading costs and custodial fees, from the pure gross composite return. (From inception to 12/31/2015, the highest applicable wrap/SMA fee is 3.00% on an annual basis, or 0.75% quarterly. From 1/1/2016 to 12/31/2023, the highest applicable wrap/SMA fee is 2.00% on an annual basis, or 0.50% quarterly and 0.17% monthly from 1/1/2024 to present.)
All investments carry a certain degree of risk, including the possible loss of principal. Investments are also subject to political, market, currency and regulatory risks or economic developments. International investments involve special risks that may in particular cause a loss in principal, including currency fluctuation, lower liquidity, different accounting methods and economic and political systems, and higher transaction costs. These risks typically are greater in emerging markets. While Large-capitalization companies may have more stable prices than smaller, less established companies, they are still subject to equity securities risk. In addition, large-capitalization equity security prices may not rise as much as prices of equity securities of small-capitalization companies. Securities of small- and medium-sized companies tend to have a shorter history of operations and be more volatile and less liquid. Value stocks can perform differently from the market as a whole and other types of stocks. The material is provided for informational and/or educational purposes only and is not intended to be and should not be construed as investment, legal or tax advice and/or a legal opinion. Investors should consult their financial and tax adviser before making investments. The opinions referenced are as of the date of publication, may be modified due to changes in the market or economic conditions, and may not necessarily come to pass. Information and data presented has been developed internally and/or obtained from sources believed to be reliable. Aristotle Capital does not guarantee the accuracy, adequacy or completeness of such information.
Aristotle Capital Management, LLC is an independent registered investment adviser under the Advisers Act of 1940, as amended. Registration does not imply a certain level of skill or training. More information about Aristotle Capital, including our investment strategies, fees and objectives, can be found in our ADV Part 2, which is available upon request. ACM-2607-107
Sources: CAPS CompositeHubTM, Russell Investments, Standard & Poor’s
Past performance is not indicative of future results. The information provided should not be considered financial advice or a recommendation to purchase or sell any particular security or product. Performance results for periods greater than one year have been annualized.
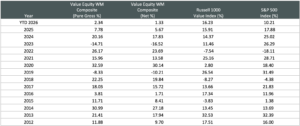
The Aristotle Value Equity WM Composite has an inception date of 10/1/1979. As of 1/1/2024, the Composite was renamed from the Value Equity Wrap Composite and the inception date was updated to 1/1/2012. This update was implemented to align the start date of the composite track record with the start date of the current decision maker. Performance achieved by the firm prior to that date is available upon request.
Composite returns are presented pure gross and net of the maximum wrap fee and include the reinvestment of all income. Pure gross returns do not reflect the deduction of any trading costs or other fees and are supplemental to the net returns. Net returns are calculated by subtracting the highest applicable wrap/SMA fee, which includes trading costs and custodial fees, from the pure gross composite return. (From inception to 12/31/2015, the highest applicable wrap/SMA fee is 3.00% on an annual basis, or 0.75% quarterly. From 1/1/2016 to 12/31/2023, the highest applicable wrap/SMA fee is 2.00% on an annual basis, or 0.50% quarterly and 0.17% monthly from 1/1/2024 to present.)
The Russell 1000® Value Index measures the performance of the large cap value segment of the U.S. equity universe. It includes those Russell 1000 Index companies with lower price-to-book ratios and lower expected growth values. The S&P 500® Index is the Standard & Poor’s Composite Index of 500 stocks and is a widely recognized, unmanaged index of common stock prices. The S&P 500 Equal Weight Index is designed to be the size-neutral version of the S&P 500. It includes the same constituents as the cap-weighted S&P 500, but each company in the S&P 500 Equal Weight Index is allocated the same weight at each quarterly rebalance. The Russell 1000® Growth Index measures the performance of the large cap growth segment of the U.S. equity universe. It includes those Russell 1000 companies with higher price-to-book ratios and higher forecasted growth values. The Russell 2000® Index measures the performance of the small cap segment of the U.S. equity universe. The Russell 2000 Index is a subset of the Russell 3000® Index representing approximately 10% of the total market capitalization of that index. It includes approximately 2,000 of the smallest securities based on a combination of their market cap and current index membership. The Dow Jones Industrial Average® is a price-weighted measure of 30 U.S. blue-chip companies. The Index covers all industries except transportation and utilities. The NASDAQ Composite Index measures all NASDAQ domestic and international based common type stocks listed on The NASDAQ Stock Market. The NASDAQ Composite includes over 3,000 companies, more than most other stock market indexes. The Bloomberg U.S. Aggregate Bond Index is an unmanaged index of domestic investment grade bonds, including corporate, government and mortgage-backed securities. The WTI Crude Oil Index is a major trading classification of sweet light crude oil that serves as a major benchmark price for oil consumed in the United States. The 3-Month U.S. Treasury Bill is a short-term debt obligation backed by the U.S. Treasury Department with a maturity of three months. The volatility (beta) of the Composite may be greater or less than its respective benchmarks. It is not possible to invest directly in these indices.