
Merrill Lynch
Value Equity 4Q 2021
FOR PRESENTATION TO MERRILL LYNCH WEALTH MANAGEMENT FINANCIAL ADVISORS ONLY
Markets Review
Markets (total return) performed as follows:
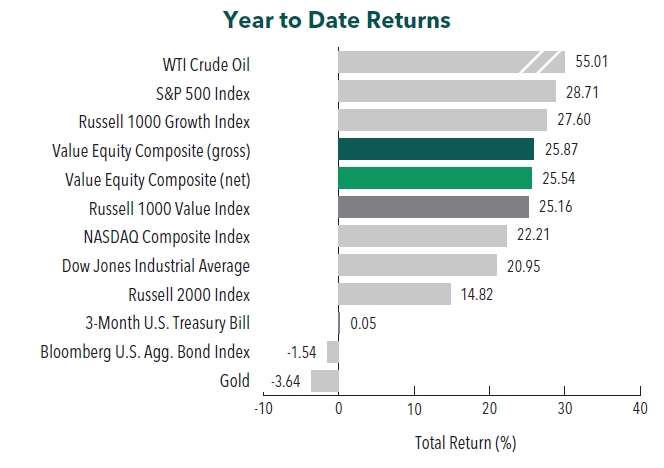
Sources: SS&C Advent, Bloomberg
Past performance is not indicative of future results. Aristotle Value Equity Composite returns are presented gross and net of investment advisory fees and include the reinvestment of all income. Aristotle Capital Composite returns are preliminary pending final account reconciliation. Please see important disclosures at the end of this document.
The U.S. equity market finished the year strong, recording its seventh consecutive quarter of positive performance. Overall, the S&P 500 Index gained 11.03% during the period, which brings its full-year return to 28.71%. Concurrently, the Bloomberg U.S. Aggregate Bond Index finished flat for the quarter, which gives the Index a calendar-year return of -1.54%. In terms of style, the Russell 1000 Value Index underperformed its growth counterpart by 3.87% during the quarter, resulting in its full-year underperformance of 2.44%.
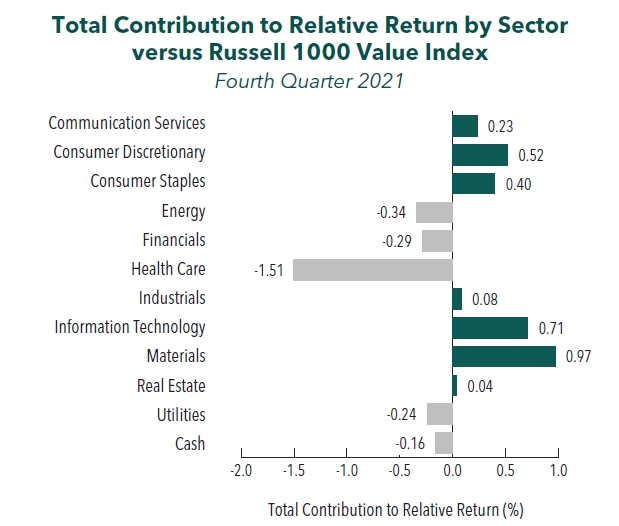
On a sector basis, ten out of eleven sectors within the Russell 1000 Value Index finished higher for the quarter, led by Real Estate, Materials and Utilities. The worst performers were Communication Services, the only sector to finish in the red, followed by Financials and Information Technology.
Economic data points were mixed during the period. Although the unemployment rate fell to 4.2%, inching to levels not seen since 2019, the U.S. economy created fewer jobs than expected, as November nonfarm payrolls increased just 210,000. Nonetheless, inflation garnered the most attention as the CPI, driven by energy, food, and used car and truck prices, rose 6.8% on a year-over-year basis—the fastest rate since 1982. Correspondingly, the Federal Reserve (Fed) ceased the use of “transitory” in reference to inflation and subsequently accelerated the tapering of its asset purchase program. Furthermore, new projections based on the median forecast by Fed officials signaled the possibility of three interest rate increases in the new year.
Meanwhile, fiscal policy also made headlines as the $1 trillion bipartisan infrastructure bill was signed into law. However, momentum for the now $1.7 trillion Build Back Better social spending and climate bill stalled, largely due to disagreements over the scope and size of the bill.
In terms of corporate earnings, labor shortages and supply-chain disruptions, specifically procurement issues and input price pressures, continued to impact businesses. Nevertheless, corporate earnings were robust, with year-over-year earnings per share (EPS) growth for S&P 500 constituents reaching nearly 40%, the third-highest figure since 2010, and 82% of S&P 500 companies beating EPS estimates. Additionally, nearly two out of three S&P 500 companies reported improving profitability since the start of the pandemic, citing pricing power and strong demand.
On the COVID front, the Omicron variant became the dominant strain in the U.S., with the number of new daily cases rising to upwards of 500,000, the highest reported figure during the pandemic.
Annual Markets Review
In a year filled with uncertainty, the U.S. economy proved resilient. Even in the face of inflation, supply-chain disruptions, labor shortages and COVID-19 variants, many businesses reported strong earnings growth and stable, if not improving, margins. Themes from 2020, such as fiscal and monetary policy actions, vaccine (and now booster) developments, and economic recovery persisted.
Although we are happy to report another strong year, the constant twists, turns and pivots of this past year are a reminder of the fragility of the short-term. Factors such as the possibility of new variants, the timing of a full recovery, fiscal and monetary policy decisions, and market sentiment are topics better left for reporters. We believe investment managers (and their clients) are best positioned to create lasting value by minimizing distractions and focusing on the longterm.
Performance and Attribution Summary
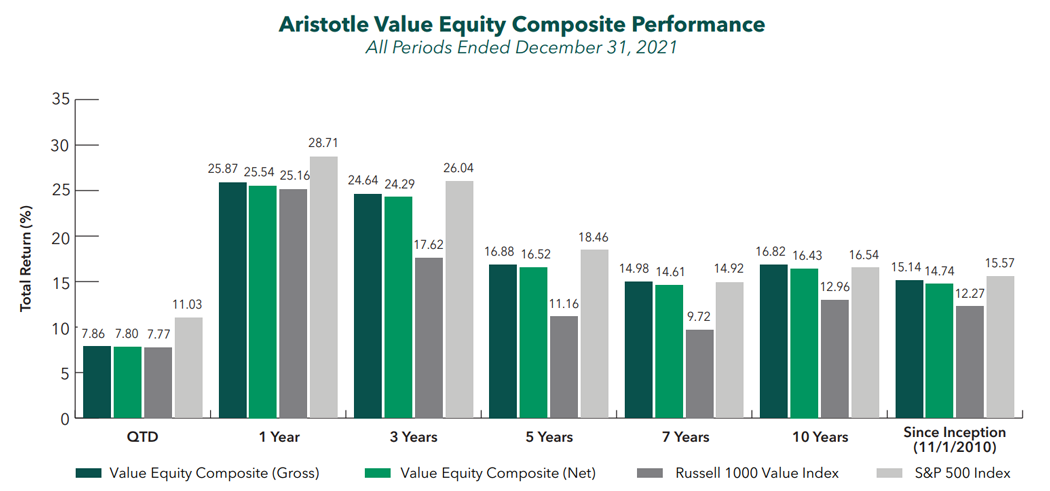
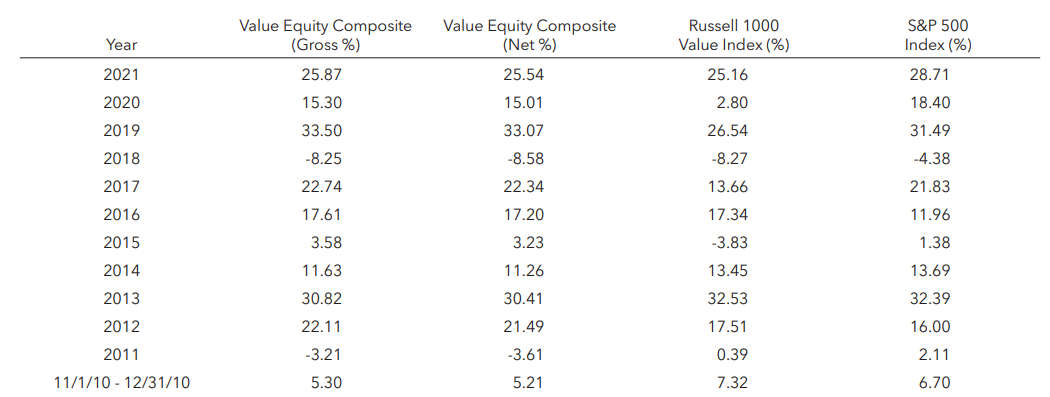
For the fourth quarter of 2021, Aristotle Capital’s Value Equity Composite posted a total return of 7.86% gross of fees (7.80% net of fees), outperforming the 7.77% return of the Russell 1000 Value Index and underperforming the 11.03% return of the S&P 500 Index. Please refer to the table for detailed performance.
| Performance (%) | 4Q21 | YTD | 3 Years | 5 Years | 10 Years |
|---|---|---|---|---|---|
| Value Equity Composite (gross) | 7.86 | 25.87 | 24.64 | 16.88 | 16.82 |
| Value Equity Composite (net) | 7.80 | 25.54 | 24.29 | 16.52 | 16.43 |
| Russell 1000 Value Index | 7.77 | 25.16 | 17.62 | 11.16 | 12.96 |
| S&P 500 Index | 11.03 | 28.71 | 26.04 | 18.46 | 16.54 |
Source: FactSet
Past performance is not indicative of future results. Attribution results are based on sector returns, which are gross of investment advisory fees and include the reinvestment of all income. Please see important disclosures at the end of this document.
The portfolio’s outperformance relative to the Russell 1000 Value Index this quarter can be attributed to allocation effects, while security selection had a negative impact. Security selection in Information Technology and Materials and an underweight in Communication Services contributed the most to relative performance. Conversely, security selection in Health Care, Communication Services and Financials detracted. (Relative weights are the result of bottom-up security selection.)
Aggregates producer Martin Marietta Materials was one of the top contributors for the period, as it delivered quarterly (and year-to-date) records for revenues and gross profit. A unique combination of higher organic volumes and price increases was able to offset significantly higher energy-related costs. The company also completed its acquisition of Lehigh Hanson’s West Region business, the second-largest acquisition in its history, increasing the firm’s presence in California and Arizona. Past acquisitions, including Texas Industries and Bluegrass Materials, have been, in our opinion, successfully integrated and have positioned the company with a coast-to-coast footprint and meaningful presence in states with high population inflows and what we think are solid underlying economies (i.e., Texas, Colorado, California, North Carolina, Georgia and Florida). Consistent with its acquisition practices, the company is committed to lowering its debt within the next 18 months. We believe the firm’s prudent capital spending, valueenhancing acquisitions, FREE cash flow generation and “value over volume” pricing strategy position the company to continue to benefit from secular demand trends, including single-family housing and federal and state-level infrastructure investment, as well as nonresidential construction (e.g., warehouse and data centers).
Lennar, one of the nation’s largest homebuilders, was a primary contributor for the quarter. Despite supply-chain challenges affecting everything from the ability to source garage doors, windows and paint, to labor shortages impacting numerous installations, Lennar was able to deliver 18,000 homes during the quarter, an 11% yearover- year growth in deliveries, while also achieving gross and net margin improvements. Such results highlight management’s focus and ability to execute amidst challenging short-term conditions while continuing to deliver on its longer-term strategic plan. To that effect, the firm made progress toward its asset-light model, where currently it controls more than half of its land through the use of options (up from 39% in 2020). This has enhanced the company’s FREE cash flow generation, allowing for the retirement of $850 million of debt and the repurchase of nearly $1 billion in stock in the most recent quarter. Furthermore, as part of its long-time efforts to incorporate technology into its business, Lennar announced commitments with Veev, a vertically integrated end-to-end panelized building technology company, and ICON, a 3D printing construction technology company, to build new communities utilizing their innovative technologies.
PayPal Holdings, the online and mobile e-commerce payments company, was a leading detractor for the period, as investors and analysts seemed focused on the threat of increased competition, as well as quarterly results that fell short of expectations. Nevertheless, PayPal still reported double-digit increases in total payment volume and revenue growth, as well as 13.3 million net new active accounts, bringing the platform’s total to 416 million active accounts. Over the past decade, we have studied PayPal’s ability to grow its extensive dual network (difficult to replicate, in our opinion) while navigating numerous competitors entering the industry. Although there may continue to be short-term headwinds and volatility in the share price, we remain focused on the fundamental advancements and long-term prospects of the business. During the quarter, the company announced that Amazon will be enabling U.S. customers to pay with Venmo, United will allow PayPal QR codes as an inflight payment option, and Honey will be expanding shopping rewards with the introduction of cash back through PayPal. We feel these partnerships display the strength of the PayPal brand, demonstrate progress on catalysts like the monetization of Venmo and enhance the overall PayPal platform.
Medtronic, a U.S.-based global provider of medical devices, was one of the largest detractors for the period following slower reported revenue growth and reduced revenue guidance for the fiscal year. Medtronic (like other businesses) is still facing pandemic-related headwinds, as staffing shortages and patient decisions have, we believe, temporarily reduced demand for non-essential medical procedures. The share price decline was exacerbated by a warning letter issued by the FDA and related to a facility where Medtronic manufactures diabetes pumps (the Diabetes business is 10% of total revenue). While clearly a negative, warning letters are not uncommon, and this matter pertains to legacy issues that Medtronic is actively engaged with the FDA on resolving fully and as quickly as possible. We will be monitoring the situation and may have more to share in the future. Despite short-term setbacks, Medtronic’s focus on innovation has allowed it to continue gaining share in the majority of its businesses while delivering on its goal to partner more closely with hospitals by offering a greater range of products (a shift in strategy that goes back to its merger with Covidien in 2016). We believe the combination of an emphasis on innovation and providing hospitals with value added services bodes well, as the healthcare system starts placing more emphasis on outcomes rather than products.
Contributors and Detractors for 4Q 2021
| Relative Contributors | Relative Detractors |
|---|---|
| Qualcomm | PayPal Holdings |
| Martin Marietta Materials | |
| Microsoft | Capital One Financial |
| Lennar | Adobe |
| RPM International | Medtronic |
Recent Portfolio Activity
| Buys | Sells |
|---|---|
| Constellation Brands | Novartis |
During the quarter, we sold our position in Novartis and used the proceeds to invest in Constellation Brands.
Novartis went through much change during our more than six-year holding period. Vasant (“Vas”) Narasimhan was promoted to CEO in early 2018 and, we believe, has positively influenced the company’s culture. Vas also helped shift the business more toward innovative medicines. Examples include the sale of Novartis’s consumer (over-thecounter) joint venture with GlaxoSmithKline and the spinoff of Alcon, a global leader in the treatment of eye diseases and eye conditions. While we continue to believe Novartis possesses Q-V-C characteristics, we decided to exit our investment in favor of what we view to be a more optimal opportunity in Constellation Brands.
Constellation Brands, Inc.
Founded in 1945 in upstate New York, Constellation Brands is a producer and marketer of beer, wine and spirits. The business grew to scale primarily as a purveyor of wine and spirits but, through M&A, has repositioned itself away from lower-end wine and spirit labels and toward premium beer. With more than $8 billion in annual revenue, Constellation is now the third-largest beer company by market share in the U.S.
Beer sales (~75% of revenue) are anchored by a set of premium Mexican trademarks, including Corona, Modelo and Pacifico. In 2013, Constellation acquired the exclusive and perpetual U.S. distribution rights for these Mexican brands from AB InBev, which had to divest due to antitrust mandates. Constellation’s Wine & Spirits segment (~25%) consists of brands such as Kim Crawford, Meiomi, The Prisoner and Svedka Vodka. It also owns a ~35% stake in Canopy Growth, a prominent Canadian provider of medicinal and recreational cannabis products.
High-Quality Business
Some of the quality characteristics we have identified for Constellation Brands include:
- Leading market share with more than 80% of the fast-growing Mexican imports segment of U.S. beer. Modelo is the best-selling imported beer in the U.S., and Pacifico is one of the quickest-rising imports
- Strong management team with a demonstrated ability to successfully market imports to mainstream U.S. populations, gain market share and ramp up distribution of new brands, forge deep relations with distributors and retailers, and expand shelf space with innovations; and
- The broad resonance of its top-tier brands and premium positioning supports more productive per-dollar promotional spending, affording it best-in-class operating margins among brewers of roughly 40%.
Attractive Valuation
We believe Constellation Brands is attractively valued based on our estimates of higher normalized FREE cash flow due to increased market penetration of its beer labels and enhanced margins for its portfolio of wines.
Compelling Catalysts
Catalysts we have identified for Constellation Brands, which we believe will cause its stock price to appreciate over our three- to fiveyear investment horizon, include:
- Constellation’s near monopoly on Mexican beer distribution in the U.S., as well as its hard-to-replicate production capabilities in Mexico, uniquely position it to benefi t from the growing Hispanic demographic and increasing popularity of Mexican beer in the U.S.;
- Continued shelf-space gains, as well as further penetration in bars and restaurants for the Beer segment, as its brands have a small share of total distribution points but a relatively high percentage of sales per distribution point; and
- Improved margins in Constellation’s Wine & Spirits segment following divestment of its less-profi table, lower-end wine brands.
Conclusion
As we turn the page on another year, we are reminded of the fleeting nature of headline news. Our focus is not on factors that will change in the coming months, but rather on the fundamentals of businesses that may persist for years.
Rather than attempting the impossible task of predicting the unpredictable, we remain steadfast in abiding by our investment philosophy and process that have been in place for nearly 25 years. By utilizing a long-term approach and identifying what we perceive to be high-quality businesses, trading at discounts to our estimates of their intrinsic value, that possess catalysts within management’s control, we believe we can withstand short-term swings and add lasting value for our clients.
The opinions expressed herein are those of Aristotle Capital Management, LLC (Aristotle Capital) and are subject to change without notice. Past performance is not a guarantee or indicator of future results.
This material is not financial advice or an offer to purchase or sell any product. You should not assume that any of the securities transactions, sectors or holdings discussed in this report were or will be profitable, or that recommendations Aristotle Capital makes in the future will be profitable or equal the performance of the securities listed in this report. The portfolio characteristics shown relate to the Aristotle Value Equity strategy. Not every client’s account will have these characteristics. Aristotle Capital reserves the right to modify its current investment strategies and techniques based on changing market dynamics or client needs. There is no assurance that any securities discussed herein will remain in an account’s portfolio at the time you receive this report or that securities sold have not been repurchased. The securities discussed may not represent an account’s entire portfolio and, in the aggregate, may represent only a small percentage of an account’s portfolio holdings. The performance attribution presented is of a representative account from Aristotle Capital’s Value Equity Composite. The representative account is a discretionary client account which was chosen to most closely reflect the investment style of the strategy. The criteria used for representative account selection is based on the account’s period of time under management and its similarity of holdings in relation to the strategy. Recommendations made in the last 12 months are available upon request.
Returns are presented gross and net of investment advisory fees and include the reinvestment of all income. Gross returns will be reduced by fees and other expenses that may be incurred in the management of the account. For example, a 0.5% annual fee deducted quarterly (0.125%) from an account with a ten-year annualized growth rate of 5.0% will produce a net result of 4.4%. Actual performance results will vary from this example.
The Russell 1000 Value® Index measures the performance of the large cap value segment of the U.S. equity universe. It includes those Russell 1000 Index companies with lower price-to-book ratios and lower expected growth values. The S&P 500® Index is the Standard & Poor’s Composite Index of 500 stocks and is a widely recognized, unmanaged index of common stock prices. The Russell 1000® Growth Index measures the performance of the large cap growth segment of the U.S. equity universe. It includes those Russell 1000 companies with higher price-to-book ratios and higher forecasted growth values. The Russell 2000® Index measures the performance of the small cap segment of the U.S. equity universe. The Russell 2000 Index is a subset of the Russell 3000® Index representing approximately 10% of the total market capitalization of that index. It includes approximately 2,000 of the smallest securities based on a combination of their market cap and current index membership. The Dow Jones Industrial Average® is a price weighted measure of 30 U.S. blue-chip companies. The Index covers all industries except transportation and utilities. The NASDAQ Composite Index measures all NASDAQ domestic and international based common type stocks listed on The NASDAQ Stock Market. The NASDAQ Composite includes over 3,000 companies, more than most other stock market indexes. The Bloomberg U.S. Aggregate Bond Index is an unmanaged index of domestic investment grade bonds, including corporate, government and mortgage-backed securities. The WTI Crude Oil Index is a major trading classification of sweet light crude oil that serves as a major benchmark price for oil consumed in the United States. The 3-Month U.S. Treasury Bill is a short-term debt obligation backed by the U.S. Treasury Department with a maturity of three months. The volatility (beta) of the Composite may be greater or less than its respective benchmarks. It is not possible to invest directly in these indices.
Aristotle Capital Management, LLC is an independent registered investment adviser under the Advisers Act of 1940, as amended. Registration does not imply a certain level of skill or training. More information about Aristotle Capital, including our investment strategies, fees and objectives, can be found in our ADV Part 2, which is available upon request. ACM-2201-30-MLFA
Composite returns for all periods ended December 31, 2021 are preliminary pending final account reconciliation.
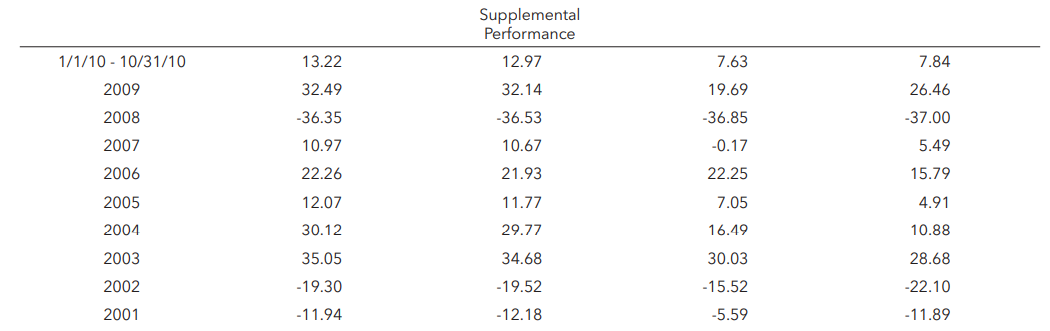
Past performance is not indicative of future results. Performance results for periods greater than one year have been annualized. Returns presented are gross and net of investment advisory fees and include the reinvestment of all income. The Aristotle Value Equity strategy has an inception date of November 1, 2010; however, the strategy initially began at Mr. Gleicher’s predecessor firm in October 1997. A supplemental performance track record from January 1, 2001 through October 31, 2010 is provided above. The returns are based on two separate accounts and performance results are based on custodian data. During this time, Mr. Gleicher had primary responsibility for managing the two accounts. Mr. Gleicher began managing one account in November 2000 and the other December 2000. Please see important disclosures enclosed within this document.