
UBS
Value Equity 3Q 2022
FOR FINANCIAL ADVISORS ONLY. NOT FOR PUBLIC DISTRIBUTION.
Markets Review
Sources: SS&C Advent, Bloomberg
Past performance is not indicative of future results. Aristotle Value Equity Composite returns are presented gross and net of investment advisory fees and include the reinvestment of all income. Gross returns will be reduced by fees and other expenses that may be incurred in the management of the account. Net returns are presented net of actual investment advisory fees and after the deduction of all trading expenses. Aristotle Capital Composite returns are preliminary pending final account reconciliation. Please see important disclosures at the end of this document.
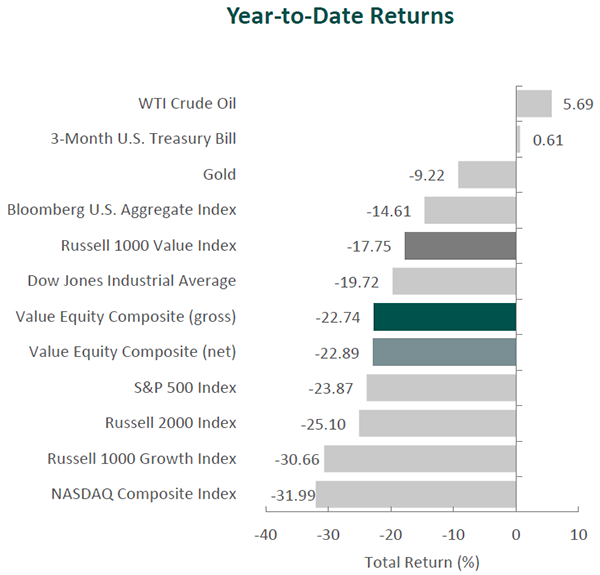
The U.S. equity market finished lower for the third consecutive quarter, as the S&P 500 Index fell 4.88% during the period, bringing its year-to-date return to -23.87%. Concurrently, the Bloomberg U.S. Aggregate Bond Index dropped 4.75% for the quarter, bringing its year-to-date return to -14.61%. In terms of style, the Russell 1000 Growth Index outperformed its value counterpart by 2.02% during the quarter. Nevertheless, for the year-to-date period, the Russell 1000 Value Index has still outperformed the Russell 1000 Growth Index by 12.91%.
On a sector basis, ten sectors within the Russell 1000 Value Index finished lower for the quarter, with the Communication Services, Real Estate and Information Technology sectors falling the most. Energy was the only sector to post a positive return, while the Consumer Discretionary and Financials sectors declined the least.
With sustained levels of heightened inflation and continued tightening by the Federal Reserve, recessionary fears persisted throughout the period, as the U.S. economy contracted in both the first and second quarters of 2022. After setting a new 40-year high in June, the CPI remained elevated, recording an 8.3% rise for the year ended in August. Higher prices have weighed on consumers, as sentiment hit multi-year lows. However, the labor market remains tight with unemployment at 3.5% in September. During the first nine months of 2022, payroll employment rose 3.7 million to a record 152.9 million. In tandem, consumer spending during the first and second quarters increased 1.8% and 1.5%, respectively, on a quarter-over-quarter basis.
In response, the Federal Reserve raised the federal funds rate 0.75% in both July and September, moving the benchmark rate to a range of 3.00% to 3.25%, all while continuing to unwind its balance sheet. Restrictive monetary policy has perhaps most visibly impacted interest-rate sensitive sectors, in particular housing, as mortgage rates breached 7%—a 20-year high—and residential investment declined 14% year-over-year in the second quarter. Additionally, the U.S. Dollar Index (DXY) reached a two-decade high, deepening concerns for the durability of U.S. export demand and causing some central banks such as the Bank of Japan to intervene and support their currency.
On the corporate earnings front, although 76% of the companies in the S&P 500 Index exceeded earnings expectations, 72 companies provided negative guidance, the most since the fourth quarter of 2019. The mixed signals highlight the continued backdrop of uncertainty heading into the last quarter of the year.
In geopolitical news, tensions between the U.S. and China flared up as Nancy Pelosi visited Taiwan despite protests from the Chinese deputy foreign minister. The worsening relations with China, combined with the ongoing war in Ukraine, continued to stoke concerns surrounding further geopolitical disruption, inflation and the outlook for global economic activity.
Performance and Attribution Summary
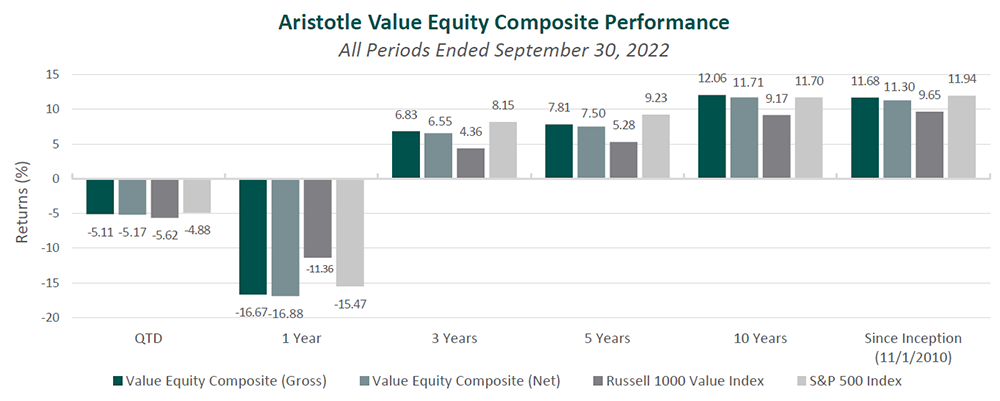
For the third quarter of 2022, Aristotle Capital’s Value Equity Composite posted a total return of -5.11% gross of fees (-5.17% net of fees), outperforming the -5.62% return of the Russell 1000 Value Index and underperforming the -4.88% return of the S&P 500 Index. Please refer to the table for detailed performance.
| Performance (%) | 3Q22 | YTD | 1 Year | 3 Years | 5 Years | 10 Years |
|---|---|---|---|---|---|---|
| Value Equity Composite (gross) | -5.11 | -22.74 | -16.67 | 6.83 | 7.81 | 12.06 |
| Value Equity Composite (net) | -5.17 | -22.89 | -16.88 | 6.55 | 7.50 | 11.71 |
| Russell 1000 Value Index | -5.62 | -17.75 | -11.36 | 4.36 | 5.28 | 9.17 |
| S&P 500 Index | -4.88 | -23.87 | -15.47 | 8.15 | 9.23 | 11.70 |
Source: FactSet
Past performance is not indicative of future results. Attribution results are based on sector returns which are gross of investment advisory fees. Attribution is based on performance that is gross of investment advisory fees and includes the reinvestment of income.
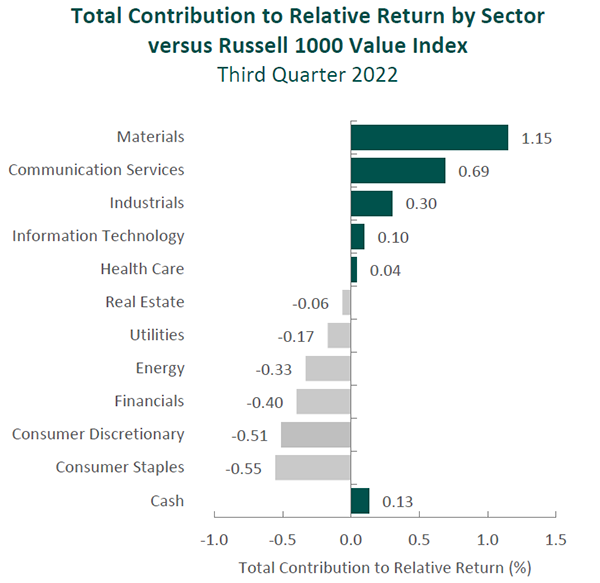
The portfolio’s outperformance relative to the Russell 1000 Value Index this quarter can be primarily attributed to security selection, while allocation effects also had a positive impact. Security selection in Materials and Information Technology and a lack of exposure to Communication Services contributed the most to relative performance. Conversely, security selection in Consumer Discretionary, Consumer Staples and Financials detracted. (Relative weights are the result of bottom-up security selection.)
Contributors and Detractors for 3Q 2022
| Relative Contributors | Relative Detractors |
|---|---|
| Corteva Agriscience | Adobe |
| Cullen/Frost Bankers | Cincinnati Financial |
| Martin Marietta Materials | Sony |
| Xylem | Tyson |
| Autodesk | Alcon |
Cullen/Frost Bankers, the Texas-based bank, was a top contributor for the quarter. The regional bank reported its fifth straight quarter of zero provisioning costs, and its net interest income grew 16% sequentially. Due to its relatively low loan-to-deposit ratio, higher core-deposit base and mix of floating-rate loans relative to peers, we believe Cullen/Frost has been well positioned to benefit when interest rates increase. The bank is continuing to execute on its expansions in Houston and Dallas—a catalyst for the business—exceeding its loan and deposit growth goals in each of these markets. While the Dallas expansion is still in its early stages, we expect it could be even more attractive than Houston given Dallas’s diverse middle-market commercial client base. Management has also confirmed it will be moving forward on plans to both originate and service mortgage loans, with anticipation of a pilot program launch by the end of 2022. This should serve to further diversify its loan book. Lastly, with its operations solely in Texas, Cullen/Frost prides itself on its relationship-based approach to banking and strong customer loyalty. This is, in our opinion, an important competitive advantage and a differentiator versus larger peers that have a national presence. As such, the bank has continued to see deposits grow and has not yet faced the same deposit pressure seen by many peers—a sign of the relationships that Cullen/Frost has built.
Xylem, the water equipment and services supplier, was a leading contributor for the quarter. The company’s solutions and technology continued to enjoy strong global demand as public utilities, as well as industrial, commercial and residential clients, seek solutions to treat, test, transport and preserve water. Similar to other industries, Xylem’s business has been impacted in the short term by the effects of inflation and chip-supply constraints (that are now moderating), leading to an increasing backlog that has delayed the ability to fulfill orders. We believe Xylem’s portfolio of highly differentiated pumps, recognized for their quality and critical uses, as well as the company’s ability to cross-sell and link other products, such as sensors and smart meters, will make it a one-stop shop for utilities and protect the company from pure price competition. In our opinion, long-term trends, such as water scarcity and the need to replace aging water infrastructure, create strong underlying demand for Xylem’s products through various parts of the economic cycle.
Adobe, the content creation and publishing software provider, was the largest detractor for the quarter. So far in 2022, Adobe has achieved record revenues with strength in all its businesses, as the acceleration toward digital has continued to drive content creation across industries. During the quarter, however, the company’s shares declined after announcing its plans to acquire Figma, a web-first collaborative interface design platform, for $20 billion. What at first glance may seem like a steep price, Figma’s web-based, multi-player platform could accelerate the delivery of Adobe’s Creative Cloud technologies on the web, increasing Adobe’s reach and total addressable market. Management expects the deal to close in 2023 and the transaction to be accretive by the end of the third year of integration. As is the case with any significant acquisition, we will take our time to understand this deal’s rationale and follow management’s ability to take Figma to “new heights.” This has been the case with previous acquisitions, including Marketo and Magento (although each at a much smaller purchase price). In general, we admire management teams that are able to recognize the evolving needs of their clients and are unafraid of “competing with themselves” by developing new offerings. We will continue to study this acquisition and better understand the desire of content creators to collaborate over the web.
Sony, the global provider of videogames and consoles, image sensors, and music, as well as movies, was a major detractor for the period. The share price of the company has struggled this year following its strong performance in 2021. Signs of a slowdown in the gaming industry (as people seem inclined to take on outdoor activities as pandemic fears have subsided), combined with sales of its PlayStation 5 that have been held up by a global parts shortage, have led to gaming-related software sales falling more than 20% year-over-year. Rather than focusing on short-term demand dislocations, we focus on the company’s ability to continue migrating videogame users toward the firm’s subscription offerings, as well as its capacity to leverage content across its video, music and gaming platforms. We are also impressed with the expansion of Sony’s Music segment, which has been supported by the pervasiveness of streaming services. Management’s ongoing work to improve the company’s TV and film studios is bearing fruit as well, with sales growing 67% year-over-year for its Pictures segment as its regional strategy has taken hold, including recent progress made toward solidifying a merger plan with India-based Zee Entertainment. All of this is to say we remain excited by the oligopolistic nature of the businesses Sony operates in, and the future prospects for the company given its leadership in image sensors, music publishing and gaming consoles.
Recent Portfolio Activity
Consistent with our long-term horizon and low turnover, there were no new purchases or sales completed during the quarter.
| Buys | Sells |
|---|---|
| None | None |
Conclusion
Our investment process seeks to identify businesses that, in our opinion, possess a combination of qualities that are both sustainable and difficult to reproduce. While broad macroeconomic factors such as inflation, central bank policies, foreign exchange markets and various other data points are taken into consideration as part of our research, we spend the vast majority of our time analyzing individual companies. Rather than attempting to predict the path of stock prices in the short term, we focus our efforts on understanding businesses over the long term. We believe the long-term benefits of patience and extensive research far outweigh the potential risk of a missed opportunity; seldom are reactionary decisions optimal. While the current market environment seems to be dominated by macro news and geopolitical events, we remain steadfast in our belief that the fundamentals of a company, ultimately, determine its intrinsic worth. As such, we will continue to focus our efforts on studying the unique qualities and characteristics of the companies in which we are invested.
Disclosures
The opinions expressed herein are those of Aristotle Capital Management, LLC (Aristotle Capital) and are subject to change without notice. Past performance is not a guarantee or indicator of future results. This material is not financial advice or an offer to purchase or sell any product. You should not assume that any of the securities transactions, sectors or holdings discussed in this report were or will be profitable, or that recommendations Aristotle Capital makes in the future will be profitable or equal the performance of the securities listed in this report. The portfolio characteristics shown relate to the Aristotle Value Equity strategy. Not every client’s account will have these characteristics. Aristotle Capital reserves the right to modify its current investment strategies and techniques based on changing market dynamics or client needs. There is no assurance that any securities discussed herein will remain in an account’s portfolio at the time you receive this report or that securities sold have not been repurchased. The securities discussed may not represent an account’s entire portfolio and, in the aggregate, may represent only a small percentage of an account’s portfolio holdings. The performance attribution presented is of a representative account from Aristotle Capital’s Value Equity Composite. The representative account is a discretionary client account which was chosen to most closely reflect the investment style of the strategy. The criteria used for representative account selection is based on the account’s period of time under management and its similarity of holdings in relation to the strategy. Recommendations made in the last 12 months are available upon request.
Returns are presented gross and net of investment advisory fees and include the reinvestment of all income. Gross returns will be reduced by fees and other expenses that may be incurred in the management of the account. Net returns are presented net of actual investment advisory fees and after the deduction of all trading expenses.
All investments carry a certain degree of risk, including the possible loss of principal. Investments are also subject to political, market, currency and regulatory risks or economic developments. International investments involve special risks that may in particular cause a loss in principal, including currency fluctuation, lower liquidity, different accounting methods and economic and political systems, and higher transaction costs. These risks typically are greater in emerging markets. Securities of small‐ and medium‐sized companies tend to have a shorter history of operations, be more volatile and less liquid. Value stocks can perform differently from the market as a whole and other types of stocks.
The material is provided for informational and/or educational purposes only and is not intended to be and should not be construed as investment, legal or tax advice and/or a legal opinion. Investors should consult their financial and tax adviser before making investments. The opinions referenced are as of the date of publication, may be modified due to changes in the market or economic conditions, and may not necessarily come to pass. Information and data presented has been developed internally and/or obtained from sources believed to be reliable. Aristotle Capital does not guarantee the accuracy, adequacy or completeness of such information.
Aristotle Capital Management, LLC is an independent registered investment adviser under the Advisers Act of 1940, as amended. Registration does not imply a certain level of skill or training. More information about Aristotle Capital, including our investment strategies, fees and objectives, can be found in our ADV Part 2, which is available upon request.
The Russell 1000 Value® Index measures the performance of the large cap value segment of the U.S. equity universe. It includes those Russell 1000 Index companies with lower price‐to‐book ratios and lower expected growth values. The S&P 500® Index is the Standard & Poor’s Composite Index of 500 stocks and is a widely recognized, unmanaged index of common stock prices. The Russell 1000® Growth Index measures the performance of the large cap growth segment of the U.S. equity universe. It includes those Russell 1000 companies with higher price‐to‐book ratios and higher forecasted growth values. The Russell 2000® Index measures the performance of the small cap segment of the U.S. equity universe. The Russell 2000 Index is a subset of the Russell 3000® Index representing approximately 10% of the total market capitalization of that index. It includes approximately 2,000 of the smallest securities based on a combination of their market cap and current index membership. The Dow Jones Industrial Average® is a price‐weighted measure of 30 U.S. blue‐chip companies. The Index covers all industries except transportation and utilities. The NASDAQ Composite Index measures all NASDAQ domestic and international based common type stocks listed on The NASDAQ Stock Market. The NASDAQ Composite includes over 3,000 companies, more than most other stock market indexes. The Bloomberg U.S. Aggregate Bond Index is an unmanaged index of domestic investment grade bonds, including corporate, government and mortgage‐backed securities. The WTI Crude Oil Index is a major trading classification of sweet light crude oil that serves as a major benchmark price for oil consumed in the United States. The 3‐Month U.S. Treasury Bill is a shortterm debt obligation backed by the U.S. Treasury Department with a maturity of three months. Consumer Price Index is a measure of the average change over time in the prices paid by urban consumers for a market basket of consumer goods and services. The U.S. Dollar Index (DXY) is a measure of the value of the U.S. dollar relative to the value of a basket of currencies of the majority of the United States’ most significant trading partners. The volatility (beta) of the Composite may be greater or less than its respective benchmarks. It is not possible to invest directly in these indices.
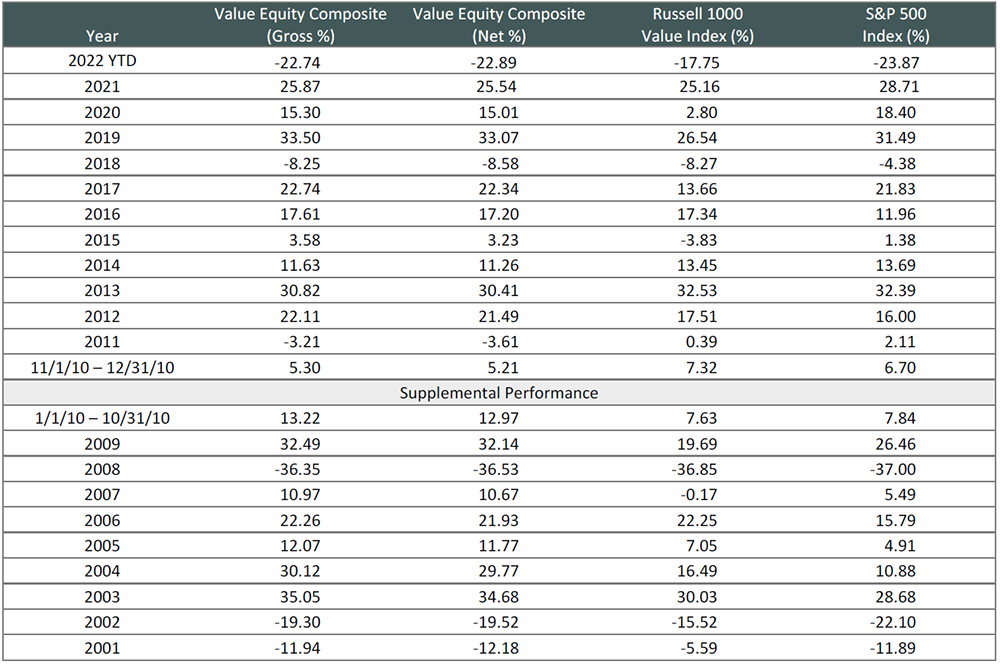
Composite returns for all periods ended September 30, 2022 are preliminary pending final account reconciliation.
Past performance is not indicative of future results. The information provided should not be considered financial advice or a recommendation to purchase or sell any particular security or product. Performance results for periods greater than one year have been annualized. The Aristotle Value Equity strategy has an inception date of November 1, 2010; however, the strategy initially began at Mr. Gleicher’s predecessor firm in October 1997. A supplemental performance track record from January 1, 2001 through October 31, 2010 is provided above. The returns are based on two separate accounts and performance results are based on custodian data. During this time, Mr. Gleicher had primary responsibility for managing the two accounts. Mr. Gleicher began managing one account in November 2000 and the other December 2000.
Returns are presented gross and net of investment advisory fees and include the reinvestment of all income. Gross returns will be reduced by fees and other expenses that may be incurred in the management of the account. Net returns are presented net of actual investment advisory fees and after the deduction of all trading expenses.
Aristotle Capital Management, LLC is an independent registered investment adviser under the Advisers Act of 1940, as amended. Registration does not imply a certain level of skill or training. More information about Aristotle Capital, including our investment strategies, fees and objectives, can be found in our Form ADV Part 2, which is available upon request. ACM‐2210‐28-UBSFA