
UBS
Value Equity 4Q 2022
FOR FINANCIAL ADVISORS ONLY. NOT FOR PUBLIC DISTRIBUTION.
Markets Review
Sources: SS&C Advent, Bloomberg
Past performance is not indicative of future results. Aristotle Value Equity Composite returns are presented gross and net of investment advisory fees and include the reinvestment of all income. Gross returns will be reduced by fees and other expenses that may be incurred in the management of the account. Net returns are presented net of actual investment advisory fees and after the deduction of all trading expenses. Aristotle Capital Composite returns are preliminary pending final account reconciliation. Please see important disclosures at the end of this document.
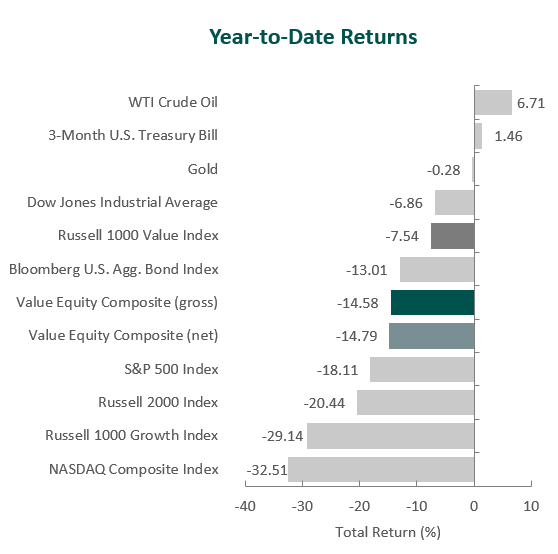
U.S. equity market performance was positive in the
final quarter of the year, as the S&P 500 Index rose
7.56% during the period. Concurrently, the
Bloomberg U.S. Aggregate Bond Index increased
1.87% for the quarter. In terms of style, the Russell
1000 Value Index outperformed its growth
counterpart by 10.22% during the quarter.
All eleven sectors within the Russell 1000 Value Index
finished higher for the quarter, with Energy, Industrials
and Materials gaining the most. Meanwhile,
Communication Services, Real Estate and Information
Technology rose the least.
Inflation has remained elevated in the U.S., with a 7.1%
rise in the CPI for the 12-month period ending in
November. However, increases have slowed since the
second half of the year, as the annualized CPI figure has
come down steadily since reaching a 40-year high of
9.1% in June. This moderation in price increases was
partly driven by falling energy costs, as average U.S.
gasoline prices approached $3 a gallon—lows not seen
since before Russia invaded Ukraine. When assessing
consumer health, spending proved resilient and the
labor market remained tight, with a 3.7%
unemployment rate and a 5.1% year-over-year
increase in average hourly earnings in November. With
respect to the U.S. economy’s overall performance,
investors welcomed news that GDP grew at an annual
rate of 3.2% in the third quarter following two
consecutive quarters of contraction.
As inflation trended lower, the Federal Reserve (Fed) slowed the pace of rate increases to 0.5% in December after raising rates by 0.75% for the fourth consecutive time in November, moving the benchmark rate to a range of 4.25% to 4.50%. Although the magnitude of rate hikes has shifted down, the Fed has indicated that, given the current labor market and its 2% inflation target, there is still more work to be done from a monetary policy standpoint. As such, apprehension around a recession remains; however, the Fed’s decision to step down from 0.75% increases and the weakening dollar alleviated some of those concerns heading into the new year.
On the corporate earnings front, signals remained mixed, as 70% of S&P 500 companies exceeded EPS estimates, while 61% of S&P 500 companies provided negative EPS guidance for the third quarter. In addition, management teams have continued to navigate the inflationary environment, with roughly 400 companies mentioning inflation on earnings calls.
Lastly, in U.S. politics, the Republican Party won a majority in the House of Representatives, while the Democratic Party retained control of the Senate after the 2022 midterm elections. The results end one-party control of Congress for the remainder of the Biden administration’s first term.
Annual Markets Review
After posting seven consecutive quarters of positive performance prior to 2022, the U.S. equity market faltered, as the S&P 500 Index finished lower for the first three quarters of the year, leading to a full-year return of -18.11%. Additionally, after five straight calendar years of growth outperforming value, the Russell 1000 Value Index outperformed the Russell 1000 Growth Index by 21.60%, the largest outperformance by value since 2000.
Meanwhile, despite fixed income’s tendency to provide stability when equities are turbulent, the Bloomberg U.S. Aggregate Bond Index fell 13.01%—its worst year on record. 2022 easily surpassed the Index’s previous worst year, when it declined 2.92% in 1994 as inflation and the corresponding interest rate environment remained primary themes. Macroeconomic headlines were dominated by inflation, while factors such as geopolitical conflict, supply-chain disruptions, labor shortages and increasing commodity and housing prices also played a role.
Although it was a challenging year, these volatile periods are precisely why we emphasize the phrase, “not every quarter, not every year.” Short-term returns are always subject to change, and macroeconomic factors such as inflation, central bank policies and geopolitical conflicts are impossible to predict. Consequently, we remain focused on the long-term fundamentals of businesses, and we strive to identify undervalued, high-quality companies that can weather the complex and changing market dynamics. We believe this steadfast approach will allow us to provide lasting long-term value to our clients.
Performance and Attribution Summary
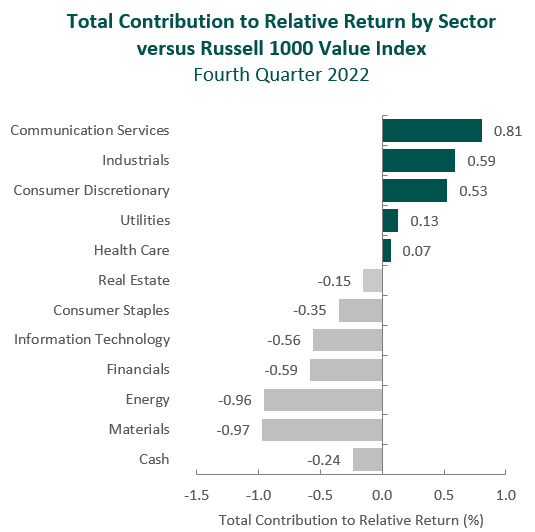
For the fourth quarter of 2022, Aristotle Capital’s Value Equity Composite posted a total return of 10.57% gross of fees (10.50% net of fees), underperforming the 12.42% return of the Russell 1000 Value Index and outperforming the 7.56% return of the S&P 500 Index. Please refer to the table for detailed performance.
| Performance (%) | 4Q22 | 1 Year | 3 Years | 5 Years | 10 Years |
|---|---|---|---|---|---|
| Value Equity Composite (gross) | 10.57 | -14.58 | 7.42 | 8.71 | 12.73 |
| Value Equity Composite (net) | 10.50 | -14.79 | 7.14 | 8.39 | 12.38 |
| Russell 1000 Value Index | 12.42 | -7.54 | 5.95 | 6.66 | 10.29 |
| S&P 500 Index | 7.56 | -18.11 | 7.65 | 9.42 | 12.56 |
The portfolio’s underperformance relative to the Russell 1000 Value Index in the fourth quarter can be attributed to security selection, while allocation effects had a slight positive impact. Security selection in Materials and Energy and an overweight in Information Technology detracted the most from relative performance. Conversely, a lack of exposure to Communication Services and security selection in Consumer Discretionary and Industrials contributed. (Relative weights are the result of bottom-up security selection.)
Source: FactSet
Past performance is not indicative of future results. Attribution results are based on sector returns which are gross of investment advisory fees. Attribution is based on performance that is gross of investment advisory fees and includes the reinvestment of income.
Contributors and Detractors for 4Q 2022
| Relative Contributors | Relative Detractors |
|---|---|
| Mitsubishi UFJ Financial | Blackstone |
| Ameriprise Financial | Crown Castle |
| Xylem | Coterra Energy |
| Honeywell | Microsoft |
| Merck | Corteva |
Blackstone, one of the world’s largest alternative asset managers, was the leading detractor for the period. Shares of the company declined following the decision to limit withdrawals from its Blackstone Real Estate Income Trust (BREIT), which allows retail clients access to alternative investments (typically only available to institutions). While we will continue to study potential long-term impacts of this move, the monthly redemption limits are a mere 2% of the fund’s assets and, importantly, the structure of the fund is one of the reasons that attracted us to Blackstone.
We believe lockup periods and redemption limits create stickier capital, while the evergreen nature of BREIT provides an edge over traditional alternative funds that require fundraising cycles. Just after quarter end, a large institution invested $4 billion in BREIT at current net asset value, providing what we view as a noteworthy endorsement of both the fund and firm as a whole. Moreover, we believe Blackstone’s track record of investment performance, as well as first-mover and distribution advantages, positions the firm well to further penetrate retail and private wealth channels.
Ameriprise Financial, the investment management firm, was a top contributor for the quarter. During our time as shareholders, Ameriprise has continued to execute on its transformation into an important player in the asset and wealth management industry (and away from insurance products). Today the Advice & Wealth Management segment, combined with the Asset Management segment, account for nearly 80% of the company’s revenues. This has served to de-risk its business model, unlock excess capital (of which it returned $632 million to shareholders during the quarter) and improve returns on equity, which are now in excess of 47%. In addition, the company takes pride in its ability to attract and retain financial advisors, providing them the tools to build relationships with clients. The market volatility during the year, in our view, has given ample opportunity for Ameriprise’s advisors to demonstrate the value their services can provide for clients.
Recent Portfolio Activity
During the quarter, we exited our investments in Sun Communities, Elanco Animal Health and Tyson Foods and established new positions in Merck and Sysco.
We originally invested in Sun Communities during the third quarter of 2018. During our time as shareholders, the company continued its expansion of housing sites and was able to steadily raise rents, items we had identified as catalysts.
| Buys | Sells |
|---|---|
| Merck | Sun Communities |
| Sysco | Elanco Animal Health |
| Tyson Foods |
More recently, Sun has made significant acquisitions, including Safe Harbor in 2020 (owner and operator of ~100 marinas in the U.S.) and Park Holidays in 2022 (the second-largest U.K. holiday park). Given recent acquisitions and diversification outside of the U.S., we decided to exit our position in Sun and, with the proceeds, increase our investment in Equity Lifestyle Properties, also an operator of manufactured home communities.
We were investors in the animal health company Elanco for a little over two years. At the time of initial investment, we believed that Elanco would benefit from being an independent company, and that this would be a significant catalyst. We now believe this catalyst has shifted outside of our time horizon, as we have concerns about the company’s integration of Bayer’s Animal Health business (acquired in 2020). In addition, competitor Zoetis seems to be taking further market share with its Simparica Trio, a one-pill treatment for heartworm, fleas and ticks. We continue to admire the animal health industry and, with our new investment in Merck, we have exposure (albeit smaller) to what we consider to be an attractive industry.
We first invested in Tyson Foods during the second quarter of 2019. At the time, we were encouraged by what we had identified as the company’s demonstrated ability to “brand” what had been previously considered pure commodity products. Furthermore, we were attracted to Tyson’s Prepared Food business, consisting of a strong portfolio of brands with attractive margins and the opportunity to gain market share as consumer preferences shifted toward prepared foods. While we believe catalysts remain, we decided to sell, as we were concerned with management changes over the past year, starting with the CEO resigning in 2021 for personal reasons, followed by the resignation of the head of Prepared Foods and exacerbated by the company’s decision to name John R. Tyson, the 32-year-old son of the firm’s chairman, as CFO.
Merck & Co.
Founded in 1891 and headquartered in New Jersey, Merck is one the world’s largest pharmaceutical firms. The company’s drugs are used to treat conditions in a variety of areas, including oncology (~38% of revenue), vaccines (~19%), diabetes (~11%), animal health (~11%) and other (~21%). Merck produced over $48 billion in sales in 2021, just under half of which were generated in the United States. Within oncology, the firm’s immuno-oncology platform is becoming a major contributor to overall sales, driven by the blockbuster1 drug Keytruda. The company’s vaccine business is also significant and includes Gardasil for the prevention of HPV (the disease that can lead to cervical cancer in women), as well as vaccines for hepatitis B, pediatric diseases and shingles. In recent years, Merck has been shifting its focus toward unmet medical needs in specialtycare areas. As part of this shift in focus, in June 2021, Merck received $9 billion from the spinoff of its women’s health, established brands, and biosimilars businesses into the now independent, publicly traded company Organon.
High-Quality Business
Some of the quality characteristics we have identified for Merck include:
- Leading market share in many of the therapeutic areas it focuses on;
- Strong salesforce that not only supports the sales of currently marketed drugs, but also serves as a barrier to entry against those seeking to launch competing products;
- Economies of scale allow for cost advantages, a particularly important attribute in the vaccine business; and
- Long and proven history in the research and development of innovative medicines.
Attractive Valuation
Based on our estimates, shares of the company are attractively valued. We believe continued market share gains for certain products will lead to higher levels of normalized FREE cash flow than are currently appreciated by the market.
Compelling Catalysts
Catalysts we have identified for Merck, which we believe will cause its stock price to appreciate over our three- to five-year
investment horizon, include:
- Further market share gains for Keytruda which is currently being used in over 30 cancer types. Additional
- opportunities also exist for Keytruda in subcutaneous administration, coformulations and combination therapies;
- Increased penetration of Gardasil, as less than 10% of the global qualified population is vaccinated for HPV; and
- Benefits from the Organon spinoff, which will streamline Merck’s remaining human health operations.
Sysco Corporation
Founded in 1969 and headquartered in Texas, Sysco is one of the largest food distribution companies in the world. The company generates more than $68 billion in annual sales and serves approximately 700,000 customers around the world (~90% of sales are generated in North America).
Sysco provides its customers a single partner from which to conveniently source all the ingredients kitchens need to build complete menus. This includes fresh and frozen meats, seafoods, fruits, vegetables, dairy, bakery items and even disposable dishware products. In addition, the company’s more than 6,000 sales consultants work closely with individual chefs, providing product advice and helping construct menus. Sysco’s clients are predominately restaurants (63% of revenue), but also include health care facilities (8%), education and government entities (8%), and travel and leisure establishments (7%), as well as other locations (14%).
High Quality Business
Some of the quality characteristics we have identified for Sysco include:
- While U.S. institutional food distribution is cyclical, highly competitive and fragmented, Sysco has been able to gain market share over time (currently #1 with ~16% share, several percentage points ahead of #2 and #3), buying complementary competitors while consistently returning cash to shareholders (as demonstrated by more than 40 consecutive years of dividend increases);
- Resiliency stemming from its essential food products (people have to eat!), diversified customer base and cost/service advantages provided by its widespread distribution network of more than 330 facilities; and
- Scale benefits that include purchasing power and the ability to provide value-added services such as technology tools that help customers control inventory and calculate menu profitability.
Attractive Valuation
We estimate the company’s revenue, margins and FREE cash flow to be higher on a normalized basis. As such, shares of Sysco are currently priced at a discount to our assessment of the company’s intrinsic value.
Compelling Catalysts
Catalysts we have identified for Sysco, which we believe will cause its stock price to appreciate over our three- to five-year investment horizon, include:
- Enhanced profitability and efficiency gains resulting from the organizational transformation initiated by CEO Kevin Hourican (in place since 2020);
- Further industry consolidation (with Sysco playing an active role as an acquirer), as well as increased market share from the shift to “away from home” food consumption; and
- Benefits from digitalization, revenue management and national account centralization.
Conclusion
2022 proved a tumultuous year for most investors, with no shortage of macroeconomic and geopolitical events gripping the world’s attention and stirring volatility in markets. Global inflation reached multi-decade highs, central banks made drastic shifts in monetary policy, governments navigated instability and changes in leadership, and rising tensions between Eastern and Western nations came to a head with a ground war in Europe. This year serves as a staunch reminder that there is “always something” to consider in financial markets and economics. However, for us at Aristotle Capital, it is important to assess whether events are truly analyzable. In our opinion, macroeconomic factors and the market’s corresponding reactions are impossible to predict consistently. We will therefore, as we always have, stay focused on what we do best—the continuous study and better understanding of individual businesses. We remain convinced this “bottom-up” approach will allow us to best serve our clients, as fundamentals, not headline news, reflect long-term value.
The opinions expressed herein are those of Aristotle Capital Management, LLC (Aristotle Capital) and are subject to change without notice. Past performance is not a guarantee or indicator of future results. This material is not financial advice or an offer to purchase or sell any product. You should not assume that any of the securities transactions, sectors or holdings discussed in this report were or will be profitable, or that recommendations Aristotle Capital makes in the future will be profitable or equal the performance of the securities listed in this report. The portfolio characteristics shown relate to the Aristotle Value Equity strategy. Not every client’s account will have these characteristics. Aristotle Capital reserves the right to modify its current investment strategies and techniques based on changing market dynamics or client needs. There is no assurance that any securities discussed herein will remain in an account’s portfolio at the time you receive this report or that securities sold have not been repurchased. The securities discussed may not represent an account’s entire portfolio and, in the aggregate, may represent only a small percentage of an account’s portfolio holdings. The performance attribution presented is of a representative account from Aristotle Capital’s Value Equity Composite. The representative account is a discretionary client account which was chosen to most closely reflect the investment style of the strategy. The criteria used for representative account selection is based on the account’s period of time under management and its similarity of holdings in relation to the strategy. Recommendations made in the last 12 months are available upon request.
Returns are presented gross and net of investment advisory fees and include the reinvestment of all income. Gross returns will be reduced by fees and other expenses that may be incurred in the management of the account. Net returns are presented net of actual investment advisory fees and after the deduction of all trading expenses.
All investments carry a certain degree of risk, including the possible loss of principal. Investments are also subject to political, market, currency and regulatory risks or economic developments. International investments involve special risks that may in particular cause a loss in principal, including currency fluctuation, lower liquidity, different accounting methods and economic and political systems, and higher transaction costs. These risks typically are greater in emerging markets. Securities of small‐ and medium‐sized companies tend to have a shorter history of operations, be more volatile and less liquid. Value stocks can perform differently from the market as a whole and other types of stocks.
The material is provided for informational and/or educational purposes only and is not intended to be and should not be construed as investment, legal or tax advice and/or a legal opinion. Investors should consult their financial and tax adviser before making investments. The opinions referenced are as of the date of publication, may be modified due to changes in the market or economic conditions, and may not necessarily come to pass. Information and data presented has been developed internally and/or obtained from sources believed to be reliable. Aristotle Capital does not guarantee the accuracy, adequacy or completeness of such information.
Aristotle Capital Management, LLC is an independent registered investment adviser under the Advisers Act of 1940, as amended. Registration does not imply a certain level of skill or training. More information about Aristotle Capital, including our investment strategies, fees and objectives, can be found in our ADV Part 2, which is available upon request. ACM-2301-10-UBSFA
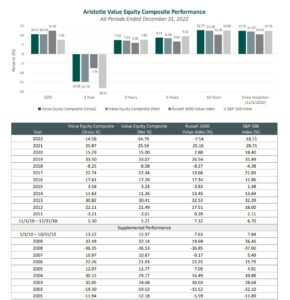
Composite returns for all periods ended December 31, 2022 are preliminary pending final account reconciliation.
Past performance is not indicative of future results. The information provided should not be considered financial advice or a recommendation to purchase or sell any particular security or product. Performance results for periods greater than one year have been annualized. The Aristotle Value Equity strategy has an inception date of November 1, 2010; however, the strategy initially began at Mr. Gleicher’s predecessor firm in October 1997. A supplemental performance track record from January 1, 2001 through October 31, 2010 is provided above. The returns are based on two separate accounts and performance results are based on custodian data. During this time, Mr. Gleicher had primary responsibility for managing the two accounts. Mr. Gleicher began managing one account in November 2000 and the other December 2000.
Returns are presented gross and net of investment advisory fees and include the reinvestment of all income. Gross returns will be reduced by fees and other expenses that may be incurred in the management of the account. Net returns are presented net of actual investment advisory fees and after the deduction of all trading expenses.
The Russell 1000 Value® Index measures the performance of the large cap value segment of the U.S. equity universe. It includes those Russell 1000 Index companies with lower price-to-book ratios and lower expected growth values. The S&P 500® Index is the Standard & Poor’s Composite Index of 500 stocks and is a widely recognized, unmanaged index of common stock prices. The Russell 1000® Growth Index measures the performance of the large cap growth segment of the U.S. equity universe. It includes those Russell 1000 companies with higher price-to-book ratios and higher forecasted growth values. The Russell 2000® Index measures the performance of the small cap segment of the U.S. equity universe. The Russell 2000 Index is a subset of the Russell 3000® Index representing approximately 10% of the total market capitalization of that index. It includes approximately 2,000 of the smallest securities based on a combination of their market cap and current index membership. The Dow Jones Industrial Average® is a price-weighted measure of 30 U.S. blue-chip companies. The Index covers all industries except transportation and utilities. The NASDAQ Composite Index measures all NASDAQ domestic and international based common type stocks listed on The NASDAQ Stock Market. The NASDAQ Composite includes over 3,000 companies, more than most other stock market indexes. The Bloomberg U.S. Aggregate Bond Index is an unmanaged index of domestic investment grade bonds, including corporate, government and mortgage-backed securities. The WTI Crude Oil Index is a major trading classification of sweet light crude oil that serves as a major benchmark price for oil consumed in the United States. The 3-Month U.S. Treasury Bill is a short-term debt obligation backed by the U.S. Treasury Department with a maturity of three months. Consumer Price Index is a measure of the average change over time in the prices paid by urban consumers for a market basket of consumer goods and services. The volatility (beta) of the Composite may be greater or less than its respective benchmarks. It is not possible to invest directly in these indices.