
Morgan Stanley
Small/Mid Cap Equity 2Q 2022
FOR PRESENTATION TO MORGAN STANLEY FINANCIAL ADVISORS ONLY
ARISTOTLE CAPITAL BOSTON, LLC
Markets Review
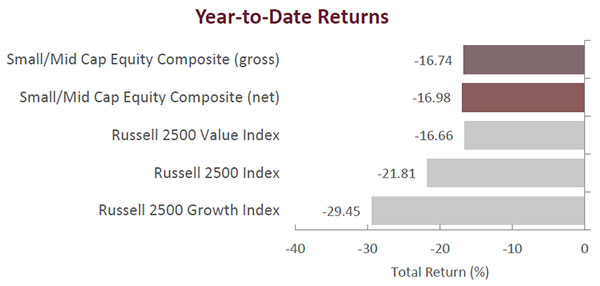
Selling pressures resumed during the second quarter leading to fairly indiscriminate declines for both growth and value styles across the market capitalization spectrum. For small/mid caps, the end result was a 16.98% decline, as inflation and higher borrowing costs fueled recessionary fears and dampened investor sentiment. U.S. GDP contracted at a 1.5% annualized rate for the first quarter of 2022, representing its first decline since the second quarter of 2020. While the trade and inventory components were largely responsible for the negative figure, the trend in consumer spending also slowed throughout the period. On the inflation front, the U.S. Federal Reserve (Fed) raised the federal funds rate in mid-June for the third time this year in an effort to tame inflation – this time raising the bar 0.75 percentage points, marking the highest single increase the Fed has applied since 1994. While economic measures of inflation continue to remain elevated (i.e., headline May Consumer Price Index (CPI) reaching a 40-year high), there have been some signs of a sequential easing of pressures as freight costs, gasoline and pockets of the commodity complex have begun to disinflate, particularly in the month of June. Any further relief on this front would be a welcomed sight to investors and consumers alike.
Within small/mid cap markets, performance was negative across the board, with all eleven sectors within the Russell 2500 Index declining during the quarter. Communication Services (-24.95%), Information Technology (-21.72%) and Materials (‑20.13%) were the worst performing sectors, all of which posted declines in excess of 20%. Defensives Utilities (-4.24%) and Consumer Staples (-8.07%) held in best on a relative basis followed by Energy (-11.33%). For the year-to-date period, ten of the eleven sectors remain in the red with Energy being the lone sector in the green.
Dividend Payers, Low Beta and Quality-Related factor exposures outperformed in the second quarter, which is not surprising as investors generally flock to stocks with less perceived risk in periods characterized by increased volatility and rapid selling. Stylistically, value continued its outperformance over growth in the second quarter, as evidenced by the Russell 2500 Value Index’s return of -15.39% compared to the -19.55% return of the Russell 2500 Growth Index. This marks the fourth consecutive quarter of outperformance for the Russell 2500 Value Index relative to the Russell 2500 Growth Index and brings its one-year return differential to 18.62% in favor of the value index.
Sources: SS&C Advent; Russell Investments
Past performance is not indicative of future results. Returns are presented gross and net of actual investment advisory fees and after the deduction of all trading expenses and include the reinvestment of all income. Aristotle Boston Composite returns are preliminary pending final account reconciliation. Please see important disclosures at the end of this document.
Performance Review
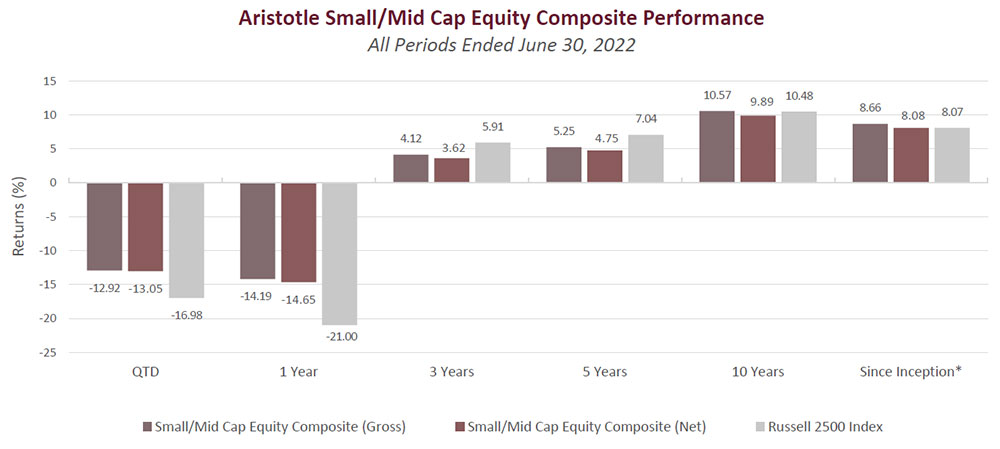
For the second quarter of 2022, the Aristotle Small/Mid Cap Equity Composite generated a total return of -12.92% gross of fees (-13.05% net of fees), outperforming the -16.98% total return of the Russell 2500 Index. Outperformance during the quarter was driven primarily by security selection, although allocation effects modestly contributed as well. Security selection within the Industrials, Information Technology and Health Care sectors added the most value on a relative basis, while selection within Financials, Real Estate and Utilities detracted. From an allocation perspective, the portfolio benefited from underweights in Consumer Discretionary and Communication Services; however, this was partially offset by an overweight in Information Technology and an underweight in Utilities.
| Relative Contributors | Relative Detractors |
|---|---|
| FTI Consulting | Harsco |
| Huron Consulting Group | Signature Bank |
| Acadia Healthcare | PacWest Bancorp |
| Dycom Industries | Coherus Biosciences |
| TreeHouse Foods | CalAmp |
CONTRIBUTORS
Security selection added the most value within the Industrials, Information Technology and Health Care sectors. From an allocation perspective, the portfolio benefited from underweights in Consumer Discretionary and Communications Services. Additionally, the portfolio’s orientation towards higher quality companies and avoidance of highly valued/unprofitable businesses also contributed. At the company level, FTI Consulting and Huron Consulting Group were two of the largest contributors during the quarter.
FTI Consulting (FCN), a global business advisory firm that provides a variety of consulting services to large corporations, benefited from strong fundamental performance driven by increased demand for the company’s services as its clients navigate through increased regulatory scrutiny, mergers and acquisitions activity, and a proliferation of corporate litigation. We maintain a position, as we believe the firm’s diversified business mix, global reach and management efforts to optimize the business can create value for shareholders going forward.
Huron Consulting Group (HURN), a specialty consulting company that provides financial, operational, and digital consulting services to health care, education and commercial clients, appreciated after delivering strong results, raising guidance and outlining a new strategic plan focused on fueling growth, expanding margins and returning capital to shareholders via buybacks. We maintain our investment as we believe the company remains well-positioned to capitalize on a demand backdrop aided by financial and operational pressures in its largest end-markets, along with secular tailwinds supporting digital transformation, analytics and cloud consulting.
DETRACTORS
Security selection detracted within the Financials, Real Estate and Utilities sectors. Additionally, the portfolio’s overweight in Information Technology and underweight in Utilities detracted from relative performance. At the company level, Harsco and Signature Bank were two of the largest detractors during the quarter.
Harsco (HSC), a provider of infrastructure services and outsourced industrial functions, declined amid inflationary pressures resulting in a downward adjustment to the company’s forward-looking outlook. We maintain a position, as we believe management’s efforts to rationalize the portfolio and reorient the business towards less cyclical industrial and environmentally-focused business lines will create additional value for shareholders.
Signature Bank (SBNY), a full-service commercial bank with offices in New York, California and North Carolina, declined despite reporting strong financial results during the quarter. It appears the share price weakness is in part due to subdued sentiment associated with the company’s exposure to the digital currency ecosystem. We maintain our investment, as we believe the company’s core business continues to perform well, and that the company’s recent expansion into the California market will augment further growth at above-market rates both organically and inorganically, which should allow for additional shareholder value creation going forward.
Recent Portfolio Activity
| Buys/Acquisitions | Sells/Liquidations |
|---|---|
| Aspen Technology | Bottomline Technologies |
| Summit Materials |
BUYS/ACQUISITIONS
Aspen Technology (AZPN), a process optimization software company and existing portfolio holding, was acquired by Emerson Electric Co. during the quarter. As a result, Emerson contributed cash and two of its software businesses for a majority stake in the newly formed entity. The new company will retain and trade under the previous ticker AZPN.
Summit Materials (SUM), a leading vertically integrated materials-based company that supplies aggregates, cement, ready-mix concrete and asphalt, was added to the portfolio. We initiated a position, as we believe company-specific self-help initiatives combined with a favorable demand backdrop, particularly with infrastructure spending on the horizon, can unlock shareholder value over the next several years.
SELLS/LIQUIDATIONS
Bottomline Technologies (EPAY), a FinTech company offering digital banking, legal spend management and online bill pay solutions for corporations, was removed from the portfolio after being acquired by private equity sponsor Thoma Bravo.
Outlook and Positioning
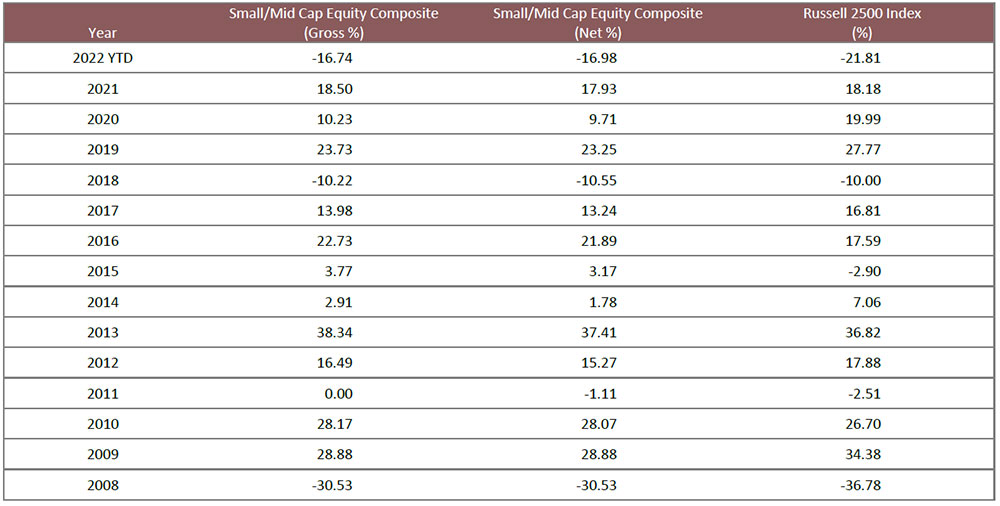
Coming into the year, we believed that 2022 would deliver more muted returns than the Russell 2500 Index’s 21.98% average calendar year return over the past three years. However, following the sharp decline in equity markets during the second quarter, the Russell 2500 Index is now down 21.81% year-to-date and will require a healthy rebound in the second half to achieve a positive full-year return. If small/mid cap equities are unable to rebound into positive territory by year-end, it will mark the first negative year for the Russell 2500 Index since 2018. Corrections of this nature, however, are not uncommon, and our work shows that declines of this magnitude typically portend strong forward returns.
From a valuation perspective, small/mid cap equities continue to remain attractive on a forward valuation basis, both on an absolute level and relative to large caps. As of quarter end, the relative forward P/E of the Russell 2500 Index versus the Russell 1000 Index continues to trade at a discount to its long-term average and now sits at its cheapest levels since the early 2000s. For long-term investors, these valuations may imply a more favorable set up for small/mid caps relative to large caps in the periods to come. In the near term, investors will turn their attention to earnings season, as earnings disappointments and guidance revisions have been flagged as the next potential risk for stocks after multiple contraction drove the first half selloff.
While it is our belief that these disruptions and selling pressures will eventually fade, we realize this continues to be a unique period in history from a policy, macroeconomic and geopolitical standpoint, with few historical analogs that compare. Although issues such as inflation, interest rates, war and trade relations may certainly persist in the coming quarters, we remain focused on what, in our opinion, is analyzable. As such, rather than attempting to forecast an outcome that is completely outside of our control, such as future Fed policy actions or the timing of commodity price moves, we choose to spend our time studying businesses that we believe can navigate uncertainty, adapt and improve their prospects regardless of the current environment. Focusing our attention on those factors that are analyzable while others chase the prevailing geopolitical or macroeconomic winds, we feel is a distinct competitive advantage.
As always, our current positioning is a function of our bottom-up security selection process and our ability to identify what we view as attractive investment candidates, regardless of economic sector definitions. Recent purchases and sales have been spread across industries and are idiosyncratic in nature, as opposed to being tied to an outlook for a particular sector. Overweights in Industrials and Information Technology are mostly a function of recent portfolio activity and the relative performance of our holdings in these sectors over the past few periods. Conversely, we continue to be underweight in Real Estate as a result of valuations and structural challenges for various end markets within the sector. We also continue to be underweight in Consumer Discretionary, as we have been unable to identify what we consider to be compelling opportunities that fit our discipline given the rising risk profiles as a result of structural headwinds for various brick and mortar businesses. Given our focus on long-term business fundamentals, patient investment approach and low portfolio turnover, the strategy’s sector positioning generally does not change significantly from quarter to quarter; however, we may take advantage of periods of volatility by adding selectively to certain companies when appropriate.
The opinions expressed herein are those of Aristotle Capital Boston, LLC (Aristotle Boston) and are subject to change without notice. Past performance is not indicative of future results. The information provided in this report should not be considered financial advice or a recommendation to purchase or sell any particular security. There is no assurance that any securities discussed herein will remain in an account’s portfolio at the time you receive this report or that securities sold have not been repurchased. The securities discussed may not represent an account’s entire portfolio and, in the aggregate, may represent only a small percentage of an account’s portfolio holdings. The performance attribution presented is of a representative account from Aristotle Boston’s Small/Mid Cap Equity Composite. The representative account is a discretionary client account which was chosen to most closely reflect the investment style of the strategy. The criteria used for representative account selection is based on the account’s period of time under management and its similarity of holdings in relation to the strategy. It should not be assumed that any of the securities transactions, holdings or sectors discussed were or will be profitable, or that the investment recommendations or decisions Aristotle Boston makes in the future will be profitable or equal the performance of the securities discussed herein. Aristotle Boston reserves the right to modify its current investment strategies and techniques based on changing market dynamics or client needs. Recommendations made in the last 12 months are available upon request.
Returns are presented gross and net of investment advisory fees and include the reinvestment of all income. Gross returns will be reduced by fees and other expenses that may be incurred in the management of the account. Net returns are presented net of actual investment advisory fees and after the deduction of all trading expenses.
As of 12/31/2021, the Russell 2500 Value Index was removed as the secondary benchmark for the Aristotle Boston Small/Mid Cap Equity strategy.
The Russell 2500 Index is a subset of the Russell 3000® Index representing approximately 10% of the total market capitalization of that index. It includes approximately 2000 of the smallest securities based on a combination of their market cap and current index membership. The Russell 2500 Growth® Index measures the performance of the small/mid cap companies located in the United States that also exhibit a growth probability. The Russell 2500 Value® Index measures the performance of the small/mid cap companies located in the United States that also exhibit a value probability. The Russell 1000 Index is a subset of the Russell 3000® Index, representing approximately 90% of the total market capitalization of that index. It includes approximately 1,000 of the largest securities based on a combination of their market capitalization and current index membership. The volatility (beta) of the composite may be greater or less than the benchmarks. It is not possible to invest directly in these indices.
This presentation is to report on the investment strategies as reported by Aristotle Capital Boston, LLC and is for illustrative purposes only. The information contained herein is obtained from multiple sources and believed to be reliable. Information has not been verified by Morgan Stanley Wealth Management, and may differ from documents created by Morgan Stanley Wealth Management. The financial advisor should refer to the Profile. This must be preceded or accompanied by the Morgan Stanley Wealth Management Profile, which you can obtain from the Morgan Stanley Wealth Management Performance Analytics. For additional information on other programs, please speak to Patrick Schussman at Aristotle Capital at (310) 954-8156.
Aristotle Capital Boston, LLC is an independent investment adviser registered under the Investment Advisers Act of 1940, as amended. Registration does not imply a certain level of skill or training. More information about Aristotle Boston, including our investment strategies, fees and objectives, can be found in our Form ADV Part 2, which is available upon request. ACB-2207-32-MSFA
Sources: SS&C Advent, Russell Investments
Composite returns for periods ended June 30, 2022 are preliminary pending final account reconciliation.
*The Aristotle Small/Mid Cap Equity Composite has an inception date of January 1, 2008 at a predecessor firm. During this time, Jack McPherson and Dave Adams had primary responsibility for managing the strategy. Performance starting January 1, 2015 was achieved at Aristotle Boston.
Past performance is not indicative of future results. Performance results for periods greater than one year have been annualized.
Returns are presented gross and net of investment advisory fees and include the reinvestment of all income. Gross returns will be reduced by fees and other expenses that may be incurred in the management of the account. Net returns are presented net of actual investment advisory fees and after the deduction of all trading expenses. Please see important disclosures enclosed within this document.