Commentary
Small/Mid Cap Equity 1Q 2023
ARISTOTLE CAPITAL BOSTON, LLC
Markets Review
SMID cap equities began the year on a positive note, with the Russell 2500 rising over 14% through the first 22 trading days of the year amid renewed investor optimism, moderating inflation data, and hopes that the Federal Reserve would soon alter their stance. This jolt of enthusiasm translated into outperformance for speculative segments of the SMID market in January, many of which were last year’s losers. Non-profitable and heavily shorted stocks also surged in January—notching gains reminiscent of those experienced during the meme frenzy in early 2021. This rally, however, was short-lived as rising rates, tighter lending conditions, and the banking system turmoil that emerged near the end of the quarter all contributed to an unsettling backdrop for investors and a 13.9% intra-quarter decline in the Russell 2500 Index. SMID cap markets stabilized towards the end of March, however, moving back into positive territory during the final week of the quarter and closing out a volatile period with a modest gain.
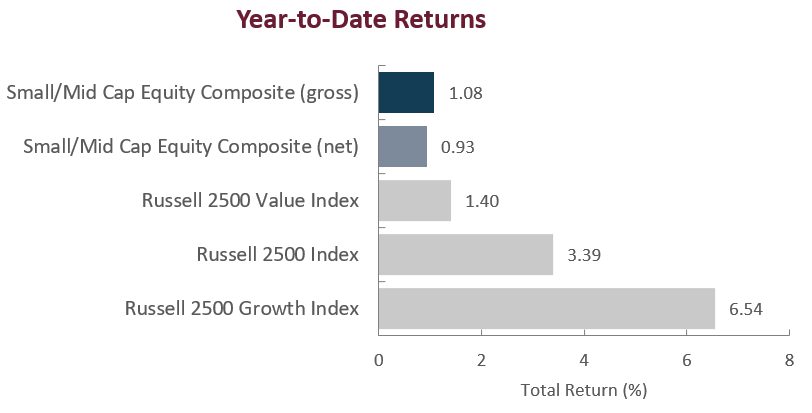
Stylistically, growth outperformed value during the quarter, as evidenced by the Russell 2500 Growth Index’s total return of 6.54% versus the 1.40% total return of the Russell 2500 Value Index. The outperformance of growth-oriented companies (as defined by Russell) during the quarter is a reversal of the recent trend that has been in place for much of the past two years. Moreover, Q1 was among the Russell 2500 Growth’s best relative quarters versus the Russell 2500 Value on record (of 149 quarters) making it a top quintile relative quarter for Growth over Value. This dispersion was driven in large part by the value index’s higher weightings in the Financials and Energy sectors, which underperformed the broader Index in the face of regional bank related turmoil and falling energy prices.
On a sector basis, Information Technology, Consumer Discretionary and Communication Services led first quarter returns, up 13.58%, 10.38%, and 8.56% respectively, with Information Technology outperforming the broader index for the first time in five quarters. Energy (-9.08%) and Financials (-7.11%) were the worst performing sectors during the quarter followed by Health Care (-0.08%) which was negatively impacted by the performance of Biotechnology companies within the sector.
Sources: SS&C Advent; Russell Investments
Past performance is not indicative of future results. Returns are presented gross and net of investment advisory fees and include the reinvestment of all income. Gross returns will be reduced by fees and other expenses that may be incurred in the management of the account. Net returns are presented net of actual investment advisory fees and after the deduction of all trading expenses. Aristotle Small Cap Equity Composite returns are preliminary pending final account reconciliation. Please see important disclosures at the end of this document.
Performance Review
For the first quarter of 2023, the Aristotle Small/Mid Cap Equity Composite generated a total return of 0.93% net of fees (1.08% gross of fees), trailing the 3.39% total return of the Russell 2500 Index. Underperformance was driven by security selection while allocation effects positively contributed. Overall, security selection was weakest within the Financials, Information Technology, and Industrials sectors and strongest in Energy, Communication Services and Health Care. From an allocation perspective, the portfolio benefited from overweight exposures in Information Technology and Industrials, however, this was partially offset by underweights in Consumer Discretionary and Communication Services.
| Relative Contributors | Relative Detractors |
|---|---|
| FTI Consulting | Signature Bank |
| Catalent | BankUnited |
| Wolverine Worldwide | National Bank Holdings |
| Belden | Acadia Healthcare |
| World Wrestling Entertainment | PacWest Bancorp |
CONTRIBUTORS
FTI Consulting (FCN), a global business advisory firm that provides a variety of consulting services to large corporations, benefited from strong fundamental performance driven by increased demand for the company’s services as its clients navigate through increased regulatory scrutiny, corporate finance and restructuring activity, and a proliferation of corporate litigation. We maintain a position, as we believe the firm’s diversified business mix, global reach and management’s efforts to optimize the business can create value for shareholders going forward.
Catalent (CTLT), a pharmaceutical contract development and manufacturing organization, appreciated amid positive momentum within the company’s Biologics segment, a renewed focus on improving efficiencies, and rumblings that the company may be acquired. We maintain a position, as we believe the long-term value creation opportunity for the company remains intact, driven by favorable outsourcing trends and the company’s competitive position in biologics, particularly within the company’s cell and gene therapy sub-segments.
DETRACTORS
Signature Bank (SBNY), a full-service commercial bank with offices across the U.S., declined after the New York Department of Financial Services took possession of the bank and appointed the Federal Deposit Insurance Corporation (FDIC) as the receiver in mid-March. Shortly thereafter the FDIC entered into an agreement with Flagstar Bank, a subsidiary of New York Community Bancorp (NYSE: NYCB) for substantially all deposits and certain loan portfolios of Signature Bridge Bank on March 20, 2023. We liquidated our remaining position late in the quarter and have provided additional color in the Recent Portfolio Activity section of the commentary below.
BankUnited (BKU), a bank holding company that provides commercial and consumer banking services in select regions nationally, declined amid broader industry wide pressures that impacted regional banking sentiment during the quarter. We maintain a position, as we believe the company can weather this period of volatility given the diversified nature of its business, strong asset quality metrics, and favorable geographic exposures.
Recent Portfolio Activity
| Buys/Acquisitions | Sells/Liquidations |
|---|---|
| Hannon Armstrong Sustainable Infrastructure Capital | Altra Industrial Motion |
| Teleflex | iStar |
| PacWest Bancorp | |
| Signature Bank |
BUYS/ACQUISITIONS
Hannon Armstrong Sustainable Infrastructure Capital (HASI), a Maryland-based sustainable asset financing and investing company was added to the portfolio. We believe the company remains uniquely positioned to benefit as the demand for sustainable energy and infrastructure continues to grow. Additionally, we believe the company’s diverse portfolio, emphasis on proven technologies and long-term partnerships will result in less cyclical, lower risk, more predictable cash flows which can drive shareholder value in periods to come.
Teleflex (TFX), a global provider of primarily single-use medical devices used by hospitals and healthcare providers for common diagnostic, therapeutic procedures, and surgical applications was added to the portfolio on our belief that the company’s diverse portfolio of industry leading brands can drive shareholder value as procedure volumes continue to recover. Furthermore, company specific margin improvement initiatives, product mix shift towards faster growing, more profitable products, and increased penetration internationally should also benefit shareholders over the next several years, in our view.
SELLS/LIQUIDATIONS
Altra Industrial Motion (AIMC), a global manufacturer and supplier of motion control, power transmission and automation products was removed from the portfolio after being acquired by Regal Rexnord Corporation (NYSE: RRX).
iStar (STAR), an internally-managed real estate investment trust specializing in ground leases, was removed from the portfolio following the completion of its merger with Safehold Inc. and the spinoff of the company’s non-ground lease assets. We maintain a position in the newly created business entity which now trades under the ticker “SAFE” and operates as the only self-managed, pure-play ground lease company in the public markets.
PacWest Bancorp (PACW), a West Coast relationship-based community bank focused on providing business banking and treasury management services to small, middle-market, and venture-backed businesses, was sold from the portfolio due to our belief that future shareholder value creation may be impeded by uncertainties related to the bank’s exposure to late-stage venture capital sponsored clients, and that the company’s risk/reward potential was no longer justified.
Signature Bank (SBNY), a full-service commercial bank with offices across the U.S, was sold from the portfolio following the FDIC takeover and subsequent carve-out of Signature Bridge Bank. Having followed Signature Bank for almost two decades, our investment thesis was predicated on the belief that Signature Bank was a traditional commercial bank with a diversified clientele and business model. The bank has a history of finding attractive industries/ecosystems that have robust deposit needs and serving these areas well. Its unique operating model of acquiring experienced private client teams drove strong deposit and loan growth, while the autonomy provided to the teams helped keep overhead costs low. The company continued to acquire teams to further its growth, and we expected its successful integration of these teams to continue, particularly on the West Coast. On a fundamental basis, we believed the company had been executing well, highlighted by record annual earnings in 2022, expanding margins, loan growth, new teams added, and clean credit metrics. However, given the heightened scrutiny of the recent events involving Silicon Valley Bank and Silvergate Capital, some of the bank’s depositors opted to pull their money creating a run on the bank despite significant qualitative and quantitative differences between those two entities and Signature Bank. The company’s digital payments platform appeared to be the source of investor confusion despite its limited financial impact on the bank’s overall business. As part of this business, Signature Bank facilitated crypto-based transactions by holding customer’s U.S. Dollar-backed crypto tokens as deposits. The bank did not, however, engage in crypto-backed lending or trading and did not hold any cryptocurrencies on its balance sheet. Moreover, the company had recently announced its plans to intentionally reduce its digital assets exposure a move we expected to reduce future earnings power from 2022 levels but would help alleviate some of the negative investor sentiment. Many specific details of what prompted regulators to step in, eventually leading to the downfall of Signature Bank, are still unknown, however, we ultimately liquidated our remaining position late in the quarter after shares reopened for trading.
Outlook
After inflationary pressures, rising borrowing costs, and geopolitical turmoil created headwinds for investors in 2022, fears of an impending banking crisis and a slowing economy pose new threats in 2023. While sentiment moderately stabilized into quarter end, continued uncertainty and increased risks of recession will likely keep market participants on edge for the foreseeable future. Against this backdrop, we continue to believe the Federal Reserve will be a key driver of market volatility going forward. Specifically, now that the Fed’s initial batch rate increases are in the rearview mirror, the ongoing debate and positioning around any future Fed activity (or lack thereof) is likely to create continued bouts of volatility in both the equity and fixed income markets due to the implications on the strength of the U.S. economy, inflation expectations, and the resulting impact on corporate profitability. Another key item to watch over the coming months will be the extent to which recent events cause banks to reduce lending. This in turn may weigh on consumer demand and business investment and therefore accelerate any slowdown in the economy. As such, we will be paying close attention to management commentary and financial disclosures throughout this upcoming earnings season, which may unearth or dispel many of these ongoing concerns. Either way, it’s not a stretch to assume that there’s likely to be more volatility in the coming months, making this a good time to remember the benefits of portfolio diversification, remaining disciplined, and staying focused on companies with higher-quality characteristics such as stable earnings, clean balance sheets, and reasonable valuations.
From an asset class perspective, valuations of SMID versus large cap remain near multi-decade lows, which we believe suggests a more favorable setup for SMID caps relative to large caps in the periods to come (12.9x P/E for the Russell 2500 Index vs. 19.2x P/E for the Russell 1000 Index). SMID caps, as represented by the Russell 2500, also remain historically attractive on an absolute basis and are trading near their lowest levels in over 30 years, slightly above the lows during the GFC and below the COVID-19 recession and 2001 recession lows. Additional benefits from re-shoring efforts, investments in automation amid wage inflation/tight labor markets, and spending to reduce emissions also favor small & mid caps which are beneficiaries of U.S. capex cycles. High and falling inflationary environments have also been favorable market environments for the asset class historically, a scenario we may find ourselves in this year. So, while the near-term outlook remains uncertain, along with the length and severity of any upcoming downturn, decades of investing have taught us that these can be the most rewarding times to be invested in SMID cap companies for the long-term. When the dust settles, we are reminded that small & mid cap companies typically start moving up before many of us know for sure that the economy has begun to reaccelerate, and that missing these early stages of a market recovery can be costly*.
Positioning
As always, our current positioning is a function of our bottom-up security selection process and our ability to identify what we view as attractive investment candidates, regardless of economic sector definitions. Overweights in Industrials and Information Technology are mostly a function of recent portfolio activity and the relative performance of our holdings in these sectors over the past few periods. Conversely, we continue to be underweight in Consumer Discretionary, as we have been unable to identify what we consider to be compelling long-term opportunities that fit our discipline given the rising risk profiles of many retail businesses and a potential deceleration in goods spending following a period of strength fueled in part by government backed stimulus payments. We also continue to be underweight in Real Estate as a result of structural challenges for various end markets within the sector. Given our focus on long-term business fundamentals, patient investment approach and low portfolio turnover, the strategy’s sector positioning generally does not change significantly from quarter to quarter. However, we may take advantage of periods of volatility by adding selectively to certain companies when appropriate.
*As measured by the average return of the Russell 2500 Index the year following periods of GDP growth <0% since 1980.
The opinions expressed herein are those of Aristotle Capital Boston, LLC (Aristotle Boston) and are subject to change without notice.
Past performance is not indicative of future results. The information provided in this report should not be considered financial advice or a recommendation to purchase or sell any particular security. There is no assurance that any securities discussed herein will remain in an account’s portfolio at the time you receive this report or that securities sold have not been repurchased. The securities discussed may not represent an account’s entire portfolio and, in the aggregate, may represent only a small percentage of an account’s portfolio holdings. The performance attribution presented is of a representative account from Aristotle Boston’s Small/Mid Cap Equity Composite. The representative account is a discretionary client account which was chosen to most closely reflect the investment style of the strategy. The criteria used for representative account selection is based on the account’s period of time under management and its similarity of holdings in relation to the strategy. It should not be assumed that any of the securities transactions, holdings or sectors discussed were or will be profitable, or that the investment recommendations or decisions Aristotle Boston makes in the future will be profitable or equal the performance of the securities discussed herein. Aristotle Boston reserves the right to modify its current investment strategies and techniques based on changing market dynamics or client needs. Recommendations made in the last 12 months are available upon request.
Returns are presented gross and net of investment advisory fees and include the reinvestment of all income. Gross returns will be reduced by fees and other expenses that may be incurred in the management of the account. Net returns are presented net of actual investment advisory fees and after the deduction of all trading expenses.
Effective January 1, 2022, the Russell 2500 Value Index was removed as the secondary benchmark for the Aristotle Boston Small/Mid Cap Equity strategy.
Non-fee-paying accounts represented less than 5% of the SMID Cap Composite assets from December 31, 2010 to December 31, 2013. As of December 31, 2014, there were no non-fee-paying accounts in the Composite. In instances where non-fee paying accounts were included in the SMID Cap Composite, the highest model fee was applied to recalculate the net returns for composite purposes and the impact on the since inception return of the composite was deemed immaterial.
All investments carry a certain degree of risk, including the possible loss of principal. Investments are also subject to political, market, currency and regulatory risks or economic developments. International investments involve special risks that may in particular cause a loss in principal, including currency fluctuation, lower liquidity, different accounting methods and economic and political systems, and higher transaction costs.
These risks typically are greater in emerging markets. Securities of small‐ and medium‐sized companies tend to have a shorter history of operations, be more volatile and less liquid. Value stocks can perform differently from the market as a whole and other types of stocks.
The material is provided for informational and/or educational purposes only and is not intended to be and should not be construed as investment, legal or tax advice and/or a legal opinion. Investors should consult their financial and tax adviser before making investments.
The opinions referenced are as of the date of publication, may be modified due to changes in the market or economic conditions, and may not necessarily come to pass.
The firm’s coverage of Signature Bank includes time at a predecessor firm.
Aristotle Capital Boston, LLC is an independent investment adviser registered under the Investment Advisers Act of 1940, as amended. Registration does not imply a certain level of skill or training. More information about Aristotle Boston, including our investment strategies, fees and objectives, can be found in our Form ADV Part 2, which is available upon request. ACB-2304-17
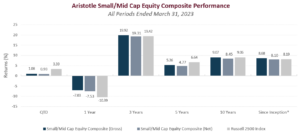
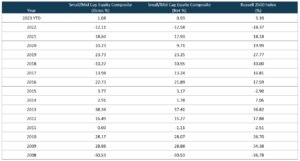
Sources: SS&C Advent, Russell Investments
Composite returns for periods ended March 31, 2023 are preliminary pending final account reconciliation.
*The Aristotle Small/Mid Cap Equity Composite has an inception date of January 1, 2008 at a predecessor firm. During this time, Jack McPherson and Dave Adams had primary responsibility for managing the strategy. Performance starting January 1, 2015 was achieved at Aristotle Boston.
Effective January 1, 2022, the Russell 2500 Value Index was removed as the secondary benchmark for the Aristotle Boston Small/Mid Cap Equity Strategy. Non-fee-paying accounts represented less than 5% of the SMID Cap Composite assets from December 31, 2010 to December 31, 2013. As of December 31, 2014, there were no non-fee-paying accounts in the Composite. In instances where non-fee paying accounts were included in the SMID Cap Composite, the highest model fee was applied to recalculate the net returns for composite purposes and the impact on the since inception return of the composite was deemed immaterial. Past performance is not indicative of future results. Performance results for periods greater than one year have been annualized.
Returns are presented gross and net of investment advisory fees and include the reinvestment of all income. Gross returns will be reduced by fees and other expenses that may be incurred in the management of the account. Net returns are presented net of actual investment advisory fees and after the deduction of all trading expenses. Please see important disclosures enclosed within this document.
The Russell 2500 Index is a subset of the Russell 3000® Index representing approximately 10% of the total market capitalization of that index. It includes approximately 2000 of the smallest securities based on a combination of their market cap and current index membership. The Russell 2500 Growth® Index measures the performance of the small/mid cap companies located in the United States that also exhibit a growth probability. The Russell 2500 Value® Index measures the performance of the small/mid cap companies located in the United States that also exhibit a value probability. The Russell 1000 Index is a subset of the Russell 3000® Index, representing approximately 90% of the total market capitalization of that index. It includes approximately 1,000 of the largest securities based on a combination of their market capitalization and current index membership. The volatility (beta) of the composite may be greater or less than the benchmarks. It is not possible to invest directly in these indices.