Research
Patience Powered by Fundamental Research
Over the past 15 years we have observed a prolonged large cap cycle, resulting in small caps as a percentage of the Russell 3000 index hitting 20 year lows. The last time large caps outperformed small caps by this wide of a margin was during the dot-com bubble in 1999. If history is any indication and markets are mean reverting, forward returns for small caps should be strong as the asset classes normalize. Explore the potential reversion of small cap stocks to historical norms and the distinctive opportunities this presents.
Small vs. Large Potential Reversion to Historical Norms
As of March 31, 2025
We believe the latest large-cap cycle is growing old, as large caps have outperformed small caps for the better half of the last decade plus. A reversion to the mean positions small caps well relative to large caps moving forward.
Rolling 10-Year Excess Return U.S. Small Cap vs. U.S. Large Cap Stocks (1935 – 3/31/2025)
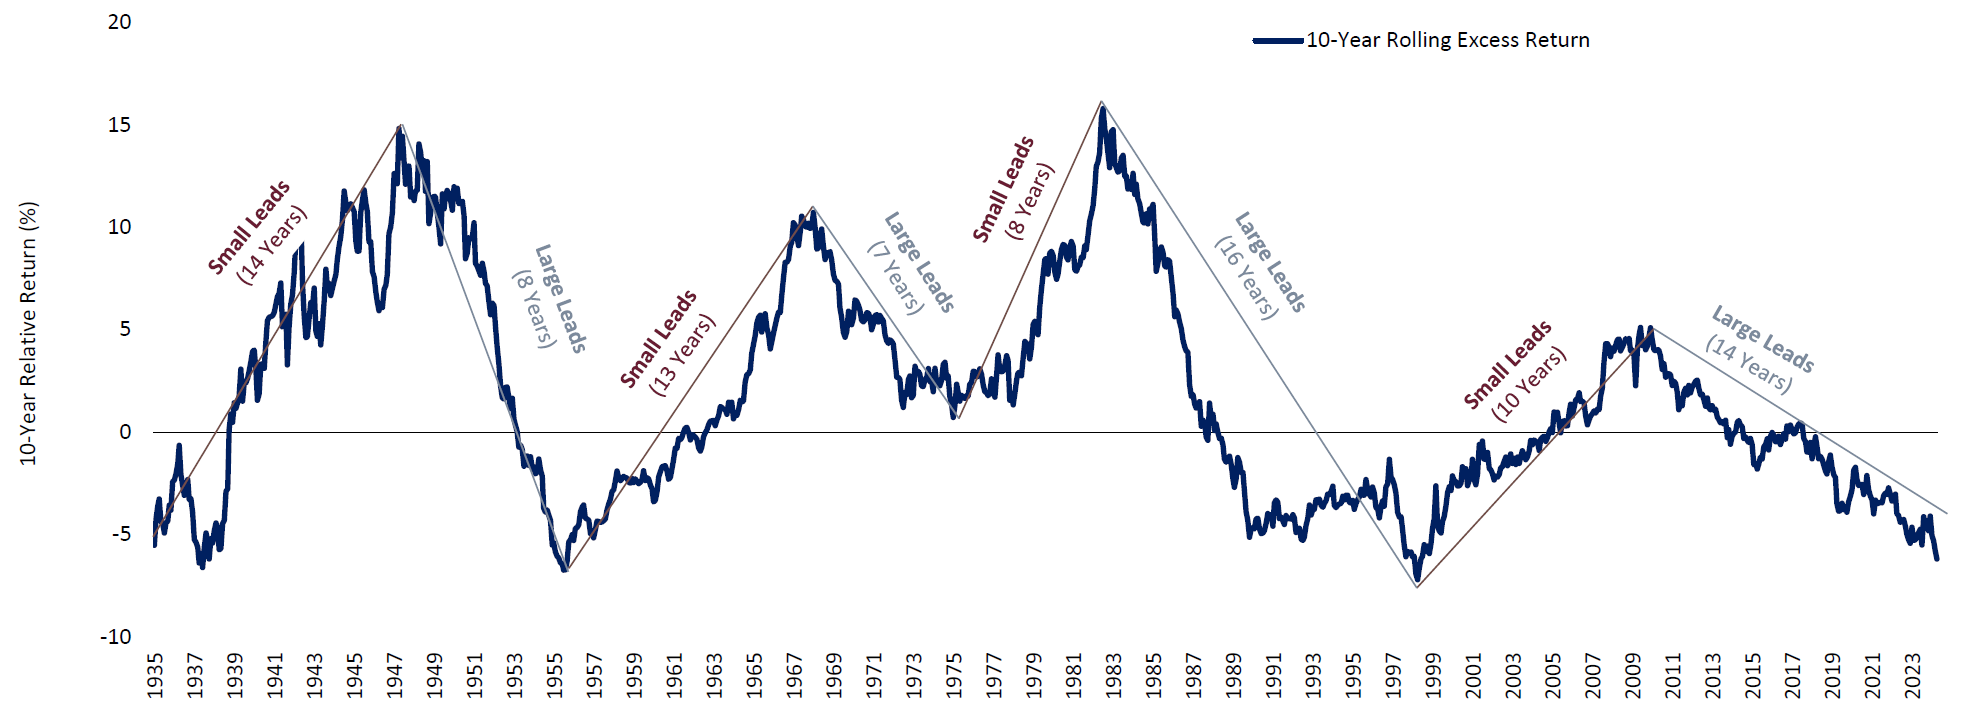
Source: eVestment. The 10-Year Rolling Excess Return represents the annualized return of the Russell 2000 Index over the trailing 10-year period minus the annualized return of the Russell 1000 Index over the same period. Rolling periods are calculated monthly based on trailing 10-year return data for these indices from 1979 to March 2025. Historical returns prior to 1979 represent the Ibbotson SBBI US Small Cap Stocks and the Ibbotson SBBI US Large Cap Stocks indices. Cycles are defined by peak to trough inflection points in 10-year rolling excess returns. Length in years are rounded to nearest whole number. Past performance is not indicative of future results..
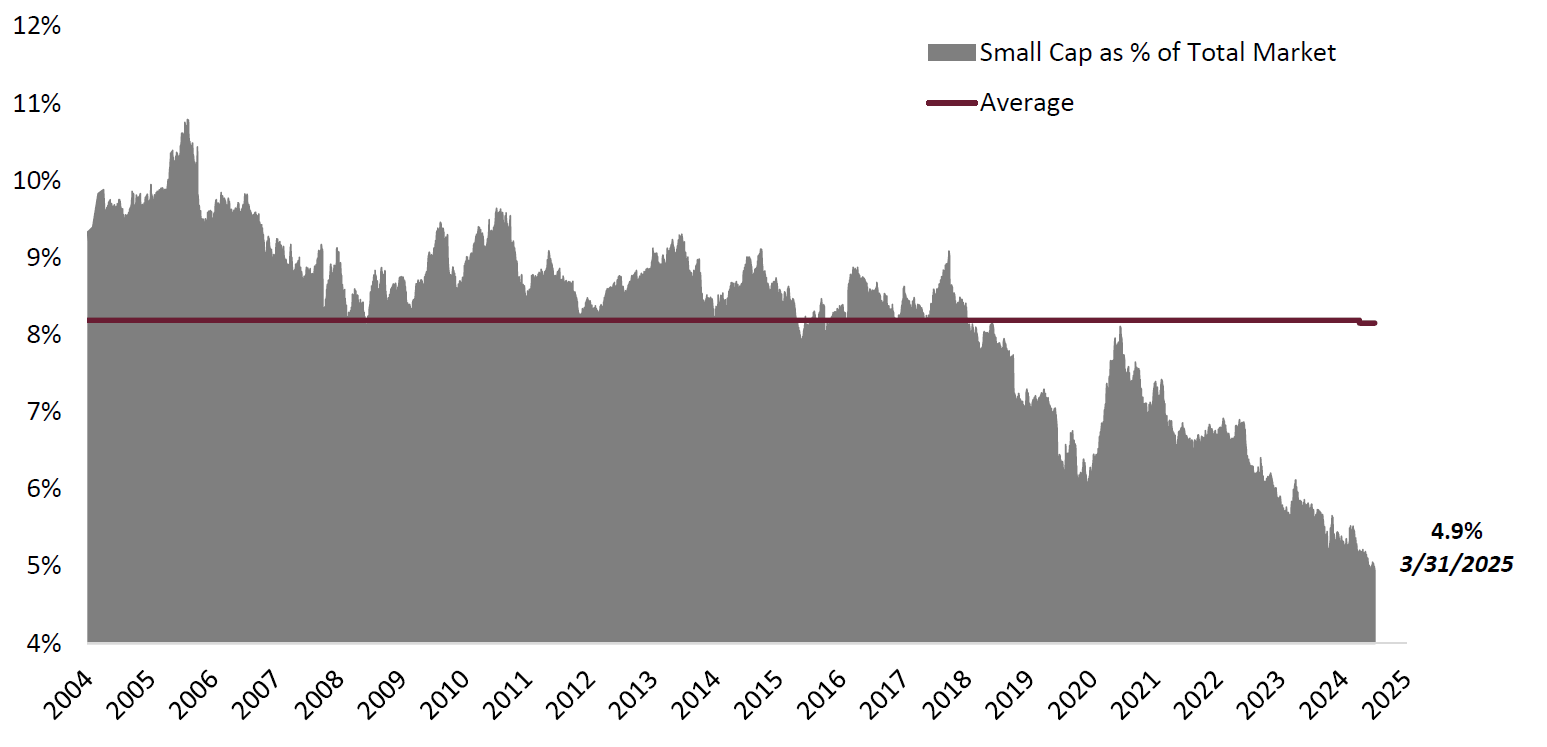
Small Cap’s Total Market Cap as a Percentage of the Russell 3000 sits at a 20-Year Low
As of March 31, 2025
Russell 2000 Total Market Cap / Russell 3000 Total Market Cap (%)
9/30/2004 – 3/31/2025
Trailing Performance History Suggests We May Be at an Inflection Point
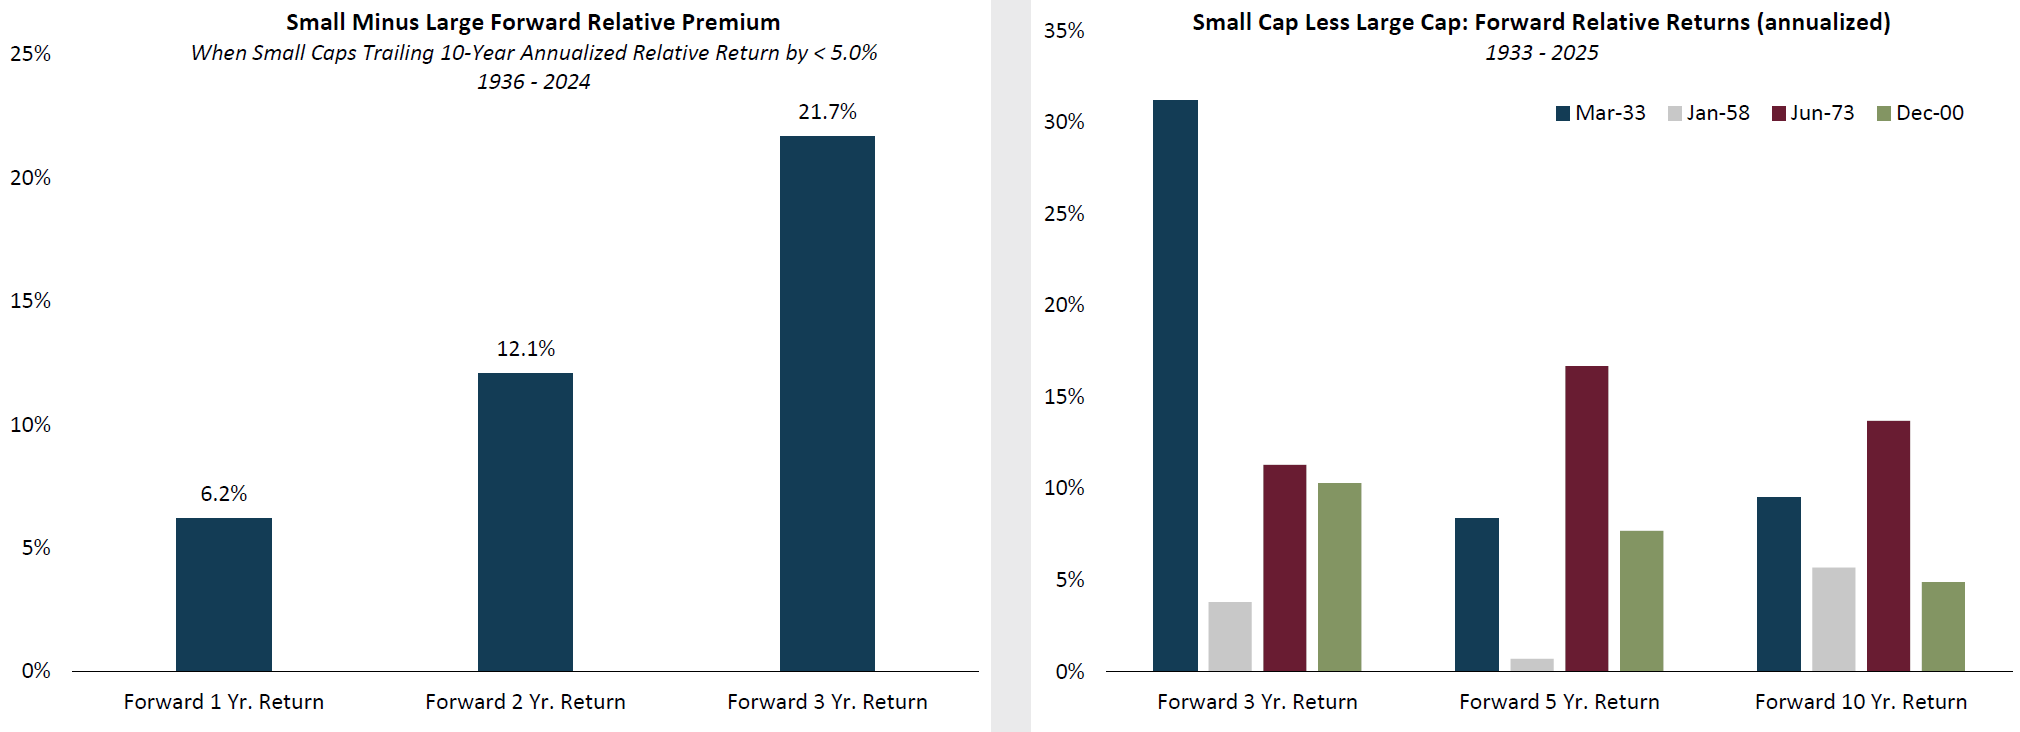
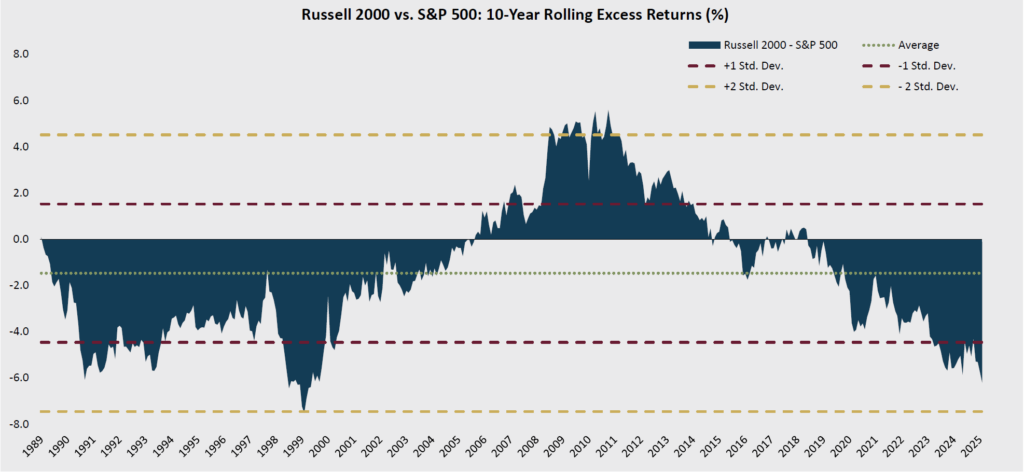
The Last Time Large Caps Outperformed Small Caps by this Margin was in 1999
As of March 31, 2025
For more small caps observations click here.
The opinions expressed herein are those of Aristotle Capital Boston (Aristotle Boston) and are subject to change without notice. This material is not financial advice or an offer to purchase or sell any product. Aristotle Boston reserves the right to modify its current investment strategies and techniques based on changing market dynamics or client needs.
All investments carry a certain degree of risk, including the possible loss of principal. Investments are also subject to political, market, currency and regulatory risks or economic developments. International investments involve special risks that may in particular cause a loss in principal, including currency fluctuation, lower liquidity, different accounting methods and economic and political systems, and higher transaction costs. These risks typically are greater in emerging markets. Securities of small- and medium-sized companies tend to have a shorter history of operations, be more volatile and less liquid. Value stocks can perform differently from the market as a whole and other types of stocks. The material is provided for informational and/or educational purposes only and is not intended to be and should not be construed as investment, legal or tax advice and/or a legal opinion. Investors should consult their financial and tax adviser before making investments. The opinions referenced are as of the date of publication, may be modified due to changes in the market or economic conditions, and may not necessarily come to pass. Information and data presented has been developed internally and/or obtained from sources believed to be reliable. Aristotle Boston does not guarantee the accuracy, adequacy or completeness of such information.
Past performance is not indicative of future results. The information provided in this report should not be considered financial advice or a recommendation to purchase or sell any particular security.
Differing historical time periods are selected throughout the presentation as we believe specific periods provide the most informative historical analog for the concepts presented.
The Russell 2000® Index measures the performance of the small cap segment of the U.S. equity universe. The Russell 2000 Index is a subset of the Russell 3000® Index representing approximately 10% of the total market capitalization of that index. It includes approximately 2000 of the smallest securities based on a combination of their market cap and current index membership. The Russell 1000® Index measures the performance of the large-cap segment of the US equity universe. It is a subset of the Russell 3000® Index and includes approximately 1,000 of the largest securities based on a combination of their market cap and current index membership. The Russell 1000 represents approximately 93% of the Russell 3000® Index, as of the most recent reconstitution. The Russell 3000® Index measures the performance of the largest 3,000 US companies representing approximately 96% of the investable US equity market, as of the most recent reconstitution. The Russell 3000 Index is constructed to provide a comprehensive, unbiased and stable barometer of the broad market and is completely reconstituted annually to ensure new and growing equities are included. The S&P 500® Index is the Standard & Poor’s Composite Index of 500 stocks and is a widely recognized, unmanaged index of common stock prices. The volatility (beta) of the portfolios may be greater or less than the benchmarks. It is not possible to invest directly in these indices.
Aristotle Capital Boston, LLC is an independent investment adviser registered under the Investment Advisers Act of 1940, as amended. Registration does not imply a certain level of skill or training. More information about Aristotle Boston, including our investment strategies, fees and objectives, can be found in Form ADV Part 2, which is available upon request. ACB-2506-26