
UBS
International Equity ADR 1Q 2022
FOR FINANCIAL ADVISORS ONLY. NOT FOR PUBLIC DISTRIBUTION.
(All MSCI index returns are shown net and in U.S. dollars unless otherwise noted.)
Markets Review
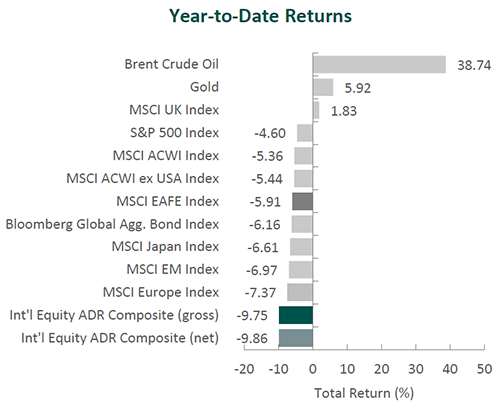
Global equity markets declined during the first quarter of the year. Overall, the MSCI ACWI Index fell 5.36% during the period. Concurrently, the Bloomberg Global Aggregate Bond Index pulled back 6.16%. In terms of style, value stocks outperformed their growth counterparts during the quarter, with the MSCI ACWI Value Index beating the MSCI ACWI Growth Index by 8.77%.
Sources: SS&C Advent, Bloomberg
Past performance is not indicative of future results. Aristotle International Equity ADR Composite returns are presented gross and net of investment advisory fees and include the reinvestment of all income. Aristotle Capital Composite returns are preliminary pending final account reconciliation. Please see important disclosures at the end of this document.
The MSCI EAFE Index dropped 5.91% during the first quarter, while the MSCI ACWI ex USA Index decreased 5.44%. Regionally, Europe & Middle East and Asia were the weakest performers, while the U.K. was the strongest. On a sector basis, nine out of the eleven sectors within the MSCI EAFE Index posted negative returns, with Information Technology, Consumer Discretionary and Industrials generating the largest declines. Conversely, Energy, Materials and Financials were the best-performing sectors.
Geopolitical conflict and corresponding economic consequences took the spotlight for the quarter. Russia invaded Ukraine by attacking major cities such as Kyiv, Kharkiv and Mariupol. As a result of the war, many Western countries imposed sweeping economic sanctions on Russia, including freezing the assets of Russia’s central bank and removing Russian banks from the international financial messaging system SWIFT.
Russia’s invasion of Ukraine created a grave humanitarian crisis and exacerbated preexisting concerns surrounding inflation and global trade relations. The war and subsequent sanctions caused further supply-chain disruptions, spiked prices of commodities such as wheat and oil, deflated global growth estimates and renewed tensions between the U.S. and China.
Nevertheless, central bank reactions to current global economic conditions and the conflict in Ukraine have been mixed. The European Central Bank stated that it will wait until the final months of the year before it raises interest rates for the first time in over a decade. Meanwhile, the U.S. Federal Reserve has already completed its first rate increase since 2018 and has communicated its view that further hikes will be appropriate. However, the People’s Bank of China has taken the opposite approach by reiterating forecasts of slowing economic growth and continuing interest rate cuts, as inflation in Asia remains relatively low.
Performance and Attribution Summary
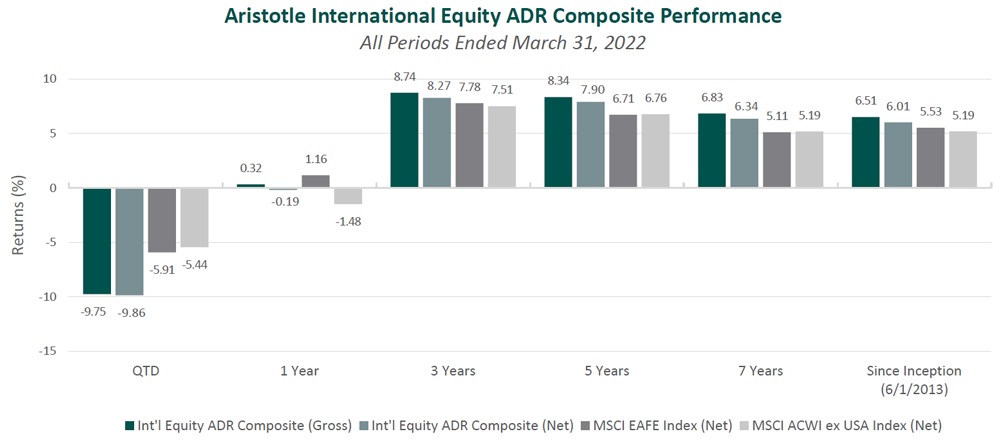
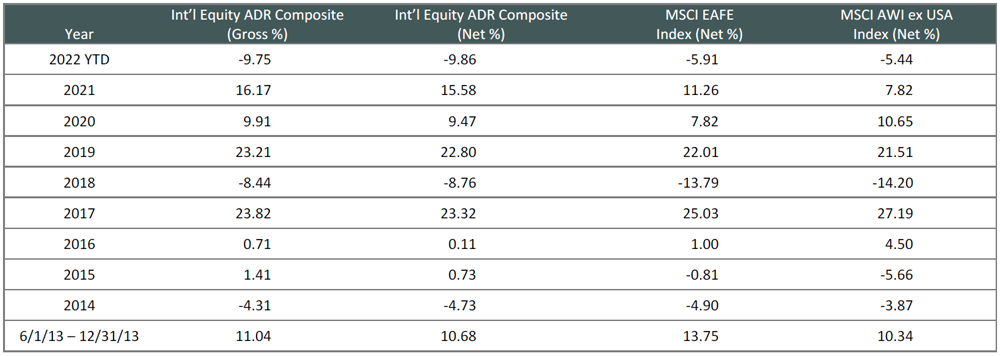
For the first quarter of 2022, Aristotle Capital’s International Equity ADR Composite posted a total U.S. dollar return of -9.75% gross of fees (-9.86% net of fees), underperforming the MSCI EAFE Index, which returned -5.91%, and the MSCI ACWI ex USA Index, which returned -5.44%. Please refer to the table below for detailed performance.
| Performance (%) | 1Q22 | 1 Year | 3 Years | 5 Years | Since Inception* |
|---|---|---|---|---|---|
| Int’l Equity ADR Composite (gross) | -9.75 | 0.32 | 8.74 | 8.34 | 6.51 |
| Int’l Equity ADR Composite (net) | -9.86 | -0.19 | 8.27 | 7.90 | 6.01 |
| MSCI EAFE Index (net) | -5.91 | 1.16 | 7.78 | 6.71 | 5.53 |
| MSCI ACWI ex USA Index (net) | -5.44 | -1.48 | 7.51 | 6.76 | 5.19 |
Source: FactSet
Past performance is not indicative of future results. Attribution results are based on sector returns, which are gross of investment advisory fees and include the reinvestment of all income. Please see important disclosures at the end of this document..
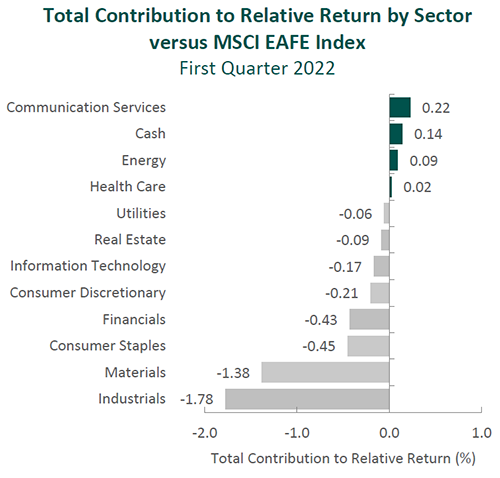
From a sector perspective, the portfolio’s underperformance relative to the MSCI EAFE Index can be attributed to both security selection and allocation effects. Security selection in Industrials, Materials and Financials detracted the most from the portfolio’s relative performance. Conversely, security selection in Communication Services and Consumer Discretionary, as well as an overweight in Financials contributed to relative return.
Regionally, security selection was primarily responsible for the portfolio’s underperformance, while allocation effects had a positive impact. Security selection in the U.K., Europe & Middle East and Asia detracted the most from relative performance, while our exposure to Emerging Markets, an underweight in Europe & Middle East and an overweight in the U.K. contributed.
Contributors and Detractors for 1Q 2022
| Contributors | Detractors |
|---|---|
| Credicorp | Nidec |
| Cameco | ING Groep |
| Pan Pacific International | Accenture |
| KDDI | Sony |
| DBS Group | Ashtead Group |
Nidec, the global supplier of brushless motors, was one of the largest detractors for the quarter. Profits came under pressure since, in the short run, the company was both impacted by lost sales due to the semiconductor shortage and its inability to fully pass increases in material costs on to its customers. However, on a normalized basis, we believe the impact of material prices will be neutral, as Nidec can negotiate with clients and pass on portions of the cost variation. Management has also reiterated confidence in its growing business supplying traction motors for electric vehicles, still expecting to ship 3.5 million of such motors in fiscal year 2025. The company plans to invest approximately ¥300 billion to ready itself to supply the developing electric vehicle market and has six factories that are either already running or in the process of being built. We believe Nidec’s experience delivering electric power steering motors to auto OEMs for more than 20 years, as well as its expertise in power efficiency, provides a unique advantage to establishing additional relationships for electric vehicle motors with OEMs.
Sony, maker of the PlayStation videogame console, was a leading detractor for the quarter. After a strong year in 2021, a shortfall in PlayStation 5 sales due to continued semiconductor shortages has dampened new console unit sales. Although there are likely to be continued limitations on the supply of components in the short term, consumer demand remains strong, and upcoming releases of major titles such as Horizon Forbidden West and Gran Turismo 7 are likely to further enhance demand. While Sony continues to manage supply-chain headwinds, the company has also again demonstrated its ability to build on the fundamental strength of its business across various segments. During the quarter, Sony acquired Bungie, a U.S.-based videogame developer known for the Destiny franchise and live game services; completed its initial equity investment in Japan Advanced Semiconductor Manufacturing, a foundry service subsidiary of Taiwan Semiconductor Manufacturing Company (TSMC); and acquired Brazilian music label Som Livre. Lastly, Sony announced a partnership with Honda Motor where the two companies expect to combine Honda’s expertise in manufacturing vehicles with Sony’s proficiency in imaging, sensing, telecommunication and network technologies to develop and commercialize electric vehicles. We feel these strategic actions demonstrate Sony’s ability to continue to improve on its market positions across its business segments with a long-term, forward-looking approach.
Cameco, the world’s largest publicly traded uranium producer, was a primary contributor for the quarter. After years of stringent operational discipline that included production cuts, inventory reduction and market purchases, the company has reported strengthening market fundamentals, as industry-wide supply concerns continue to abate. The improving conditions can provide Cameco significant leverage to drive higher prices under its market-related contracts. Moreover, the company has obtained 70 million pounds of additional long-term contracts since the beginning of 2021, demonstrating Cameco’s strong position to capture increasing demand. Nevertheless, management has reiterated its commitment to maintaining supply discipline while continuing to invest in operational efficiency through automation, digitization and training. As such, the company expects to see significant improvements in cash flow generation, as it ramps up to its 2024 planned production capacity. We believe Cameco’s disciplined approach and conservative financial management continue to reinforce its long-term position and its ability to return value to shareholders. This was recently demonstrated when Cameco’s board approved a 50% increase to the company’s annual dividend for 2022.
KDDI, the second-largest telecom operator in Japan, was a leading contributor for the quarter. The company saw strong improvements during the period with operating profits increasing substantially. Furthermore, KDDI’s board approved a ¥50 billion stock buyback and, with the continued rollout of 5G in new areas, 5G unit sales grew steadily. In addition, KDDI laid out its plan to stop offering 3G service over its network and allow current 3G users to upgrade to 4G- or 5G-compatible phones at no cost to the customer, which management indicated would free up frequencies. The company also continued its success at diversifying away from traditional telecom revenue streams, making progress toward its transformation into a “Life Design Company”—a catalyst we had previously identified. Its customer base for bundled services such as home electricity, payments and mobile entertainment all expanded. In our view, this diminishes the risk of the business becoming just a “pipe” like many other telecom service providers.
Recent Portfolio Activity
| Buys | Sells |
|---|---|
| None | None |
Consistent with our long-term horizon and low turnover, there were no new purchases or sales completed during the quarter.
Conclusion
Performance for the first few months of 2022 has undoubtedly been disappointing. However, in both strong short-term periods and weak ones, we are resolute in our mantra — “not every quarter, not every year.” Down markets and short-term price swings are a natural part of investing. While issues such as inflation, interest rates, war and trade relations will certainly persist in the coming quarters, we remain focused on what, in our opinion, is analyzable. As such, while we are ever cognizant of the events and environment around us, we will always choose to instead concentrate on the long-term fundamentals of the businesses we study. We believe our approach of understanding companies’ earnings power from a normalized perspective, combined with our focus on high-quality, undervalued businesses that possess significant catalysts, is the best way to create lasting long-term value for our clients.
The opinions expressed herein are those of Aristotle Capital Management, LLC (Aristotle Capital) and are subject to change without notice. Past performance is not a guarantee or indicator of future results. This material is not financial advice or an offer to buy or sell any product. You should not assume that any of the securities transactions, sectors or holdings discussed in this report were or will be profitable, or that recommendations Aristotle Capital makes in the future will be profitable or equal the performance of the securities listed in this report. The portfolio characteristics shown relate to the Aristotle International Equity ADR strategy. Not every client’s account will have these characteristics. Aristotle Capital reserves the right to modify its current investment strategies and techniques based on changing market dynamics or client needs. There is no assurance that any securities discussed herein will remain in an account’s portfolio at the time you receive this report or that securities sold have not been repurchased. The securities discussed may not represent an account’s entire portfolio and, in the aggregate, may represent only a small percentage of an account’s portfolio holdings. The performance attribution presented is of a representative account from Aristotle Capital’s International Equity ADR Composite. The representative account is a discretionary client account which was chosen to most closely reflect the investment style of the strategy. The criteria used for representative account selection is based on the account’s period of time under management and its similarity of holdings in relation to the strategy. Recommendations made in the last 12 months are available upon request.
Returns are presented gross and net of investment advisory fees and include the reinvestment of all income. Gross returns will be reduced by fees and other expenses that may be incurred in the management of the account. For example, a 0.5% annual fee deducted quarterly (0.125%) from an account with a ten‐year annualized growth rate of 5.0% will produce a net result of 4.4%. Actual performance results will vary from this example. Please see important disclosures enclosed within this document.
The MSCI EAFE Index (Europe, Australasia, Far East) is a free float‐adjusted market capitalization‐weighted index that is designed to measure the equity market performance of developed markets, excluding the United States and Canada. The MSCI EAFE Index consists of the following 21 developed market country indices: Australia, Austria, Belgium, Denmark, Finland, France, Germany, Hong Kong, Ireland, Israel, Italy, Japan, the Netherlands, New Zealand, Norway, Portugal, Singapore, Spain, Sweden, Switzerland and the United Kingdom. The MSCI ACWI captures large and mid‐cap representation across 23 developed market countries and 24 emerging markets countries. With approximately 3,000 constituents, the Index covers approximately 85% of the global investable equity opportunity set. The MSCI ACWI Growth Index captures large and mid‐cap securities exhibiting overall growth style characteristics across 23 developed markets countries and 24 emerging markets countries. The MSCI ACWI Value Index captures large and mid‐cap securities exhibiting overall value style characteristics across 23 developed markets countries and 24 emerging markets countries. The MSCI ACWI ex USA Index captures large and mid‐cap representation across 22 of 23 developed markets countries (excluding the United States) and 24 emerging markets countries. With over 2,300 constituents, the Index covers approximately 85% of the global equity opportunity set outside the United States. The MSCI Emerging Markets Index is a free float‐adjusted market capitalization‐weighted index that is designed to measure the equity market performance of emerging markets. The MSCI Emerging Markets Index consists of the following 24 emerging market country indexes: Brazil, Chile, China, Colombia, Czech Republic, Egypt, Greece, Hungary, India, Indonesia, Korea, Kuwait, Malaysia, Mexico, Peru, Philippines, Poland, Qatar, Saudi Arabia, South Africa, Taiwan, Thailand, Turkey and United Arab Emirates. The S&P 500® Index is the Standard & Poor’s Composite Index of 500 stocks and is a widely recognized, unmanaged index of common stock prices. The Brent Crude Oil Index is a major trading classification of sweet light crude oil that serves as a major benchmark price for purchases of oil worldwide. The MSCI Japan Index is designed to measure the performance of the large and mid‐cap segments of the Japanese market. With over 250 constituents, the Index covers approximately 85% of the free float‐adjusted market capitalization in Japan. The Bloomberg Global Aggregate Bond Index is a flagship measure of global investment grade debt from 28 local currency markets. This multi‐currency benchmark includes treasury, government‐related, corporate and securitized fixed‐rate bonds from both developed and emerging markets issuers. The MSCI United Kingdom Index is designed to measure the performance of the large and mid‐cap segments of the U.K. market. With nearly 100 constituents, the Index covers approximately 85% of the free float‐adjusted market capitalization in the United Kingdom. The MSCI Europe Index captures large and mid‐cap representation across 15 developed markets countries in Europe. With approximately 430 constituents, the Index covers approximately 85% of the free float‐adjusted market capitalization across the European developed markets equity universe. These indices have been selected as the benchmarks and are used for comparison purposes only. The volatility (beta) of the Composite may be greater or less than the respective benchmarks. It is not possible to invest directly in these indices.
Aristotle Capital Management, LLC is an independent registered investment adviser under the Advisers Act of 1940, as amended. Registration does not imply a certain level of skill or training. More information about Aristotle Capital, including our investment strategies, fees and objectives, can be found in our Form ADV Part 2, which is available upon request. ACM‐2204‐141-UBSFA
Composite returns for all periods ended March 31, 2022 are preliminary pending final account reconciliation.
The performance information presented is based on the Aristotle International Equity ADR Composite. Past performance is not indicative of future results.
Performance results for periods greater than one year have been annualized. Returns are presented gross and net of investment advisory fees and include the reinvestment of all income. Please see important disclosures within this document.