


Commentary
Global Equity Advisory 2Q 2026
(All MSCI index returns are shown net and in U.S. dollars unless otherwise noted.)
Markets Review
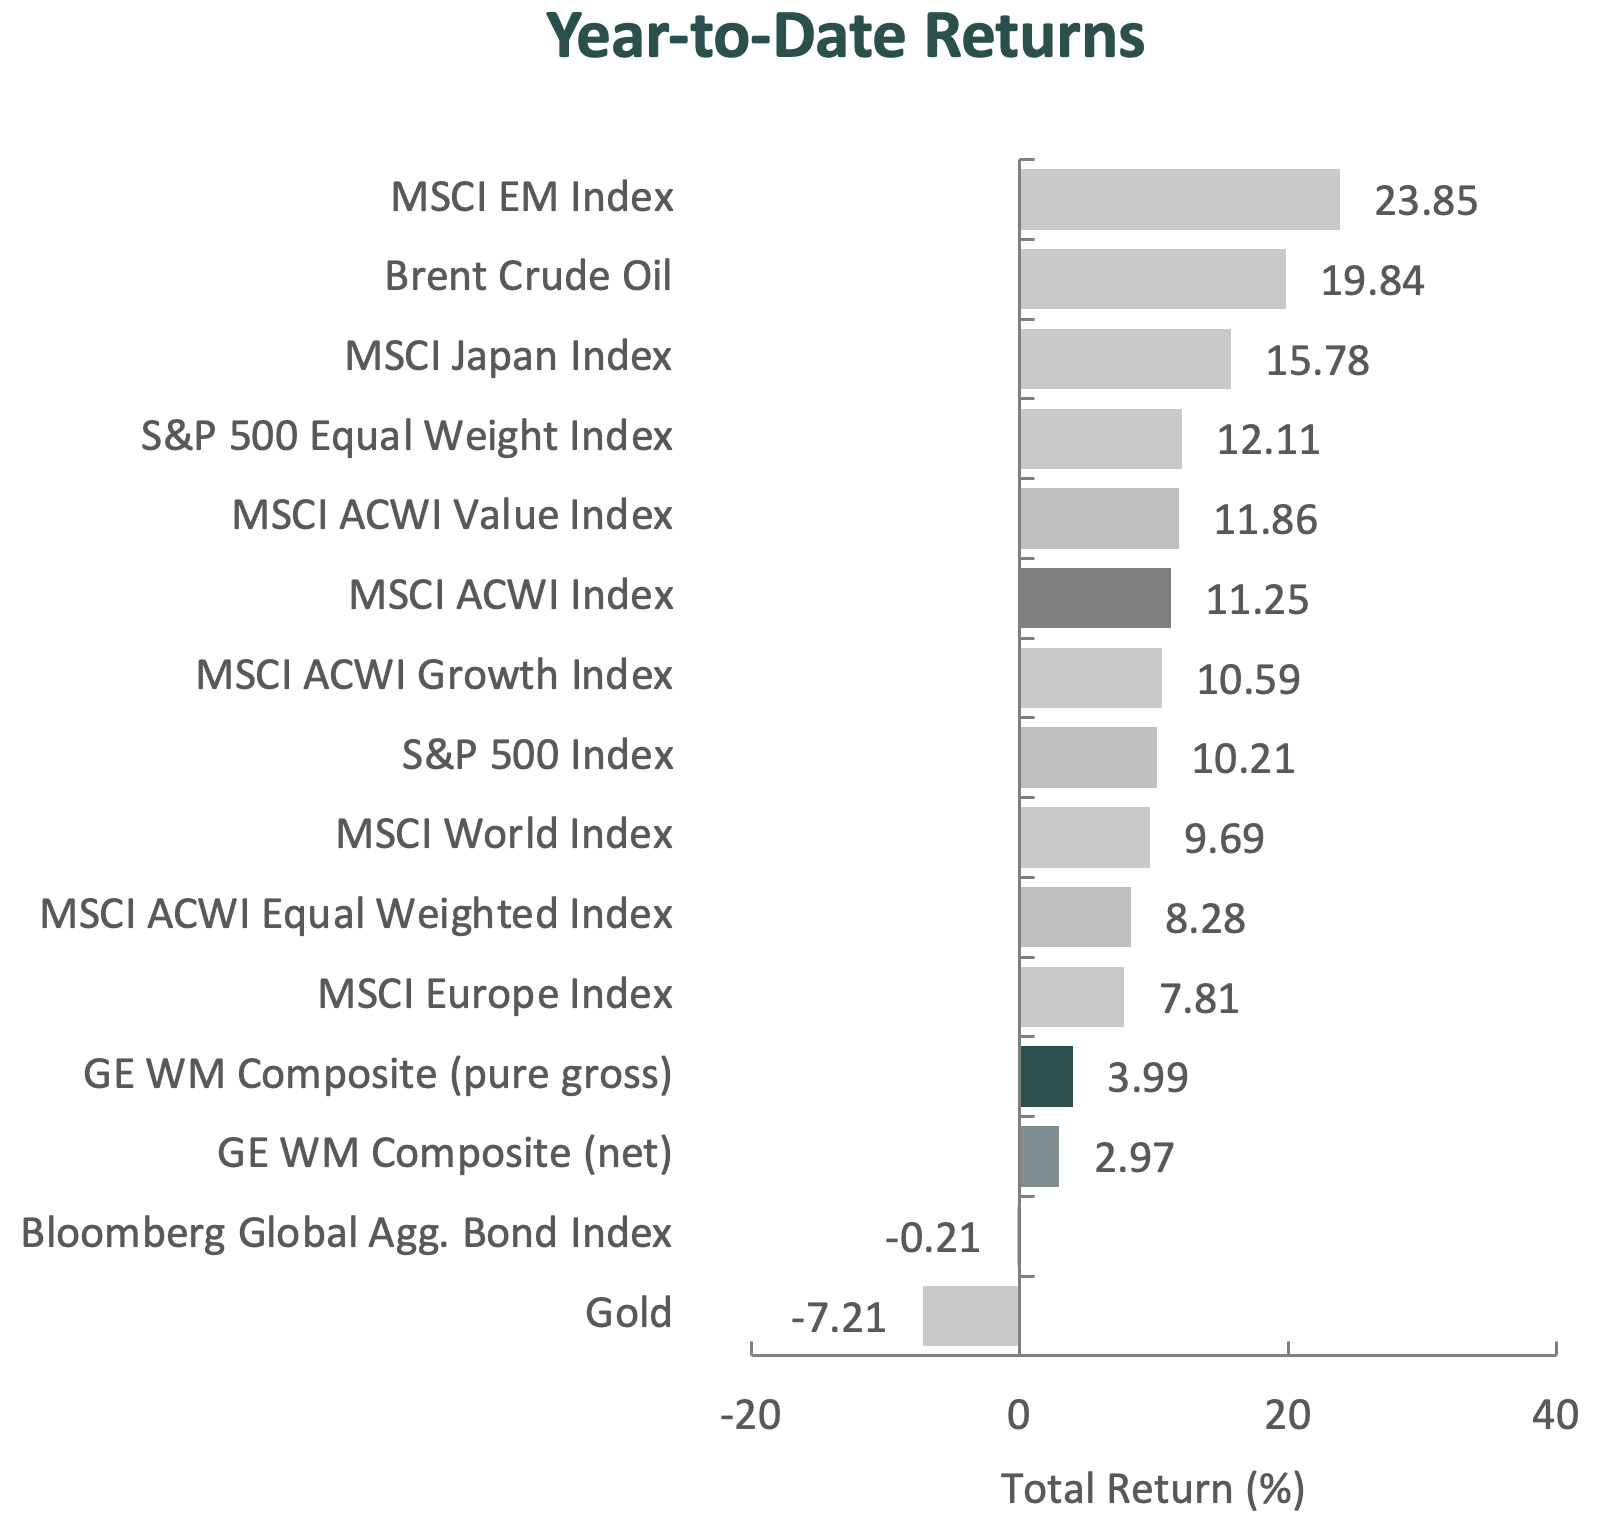
Sources: CAPS CompositeHubTM, Bloomberg
Past performance is not indicative of future results. Aristotle Global Equity WM Composite returns are presented pure gross and net of maximum wrap fee and include the reinvestment of income. Pure gross returns do not reflect the deduction of any trading costs or other fees and are supplemental to the net returns. Net returns are calculated by subtracting the highest applicable wrap/SMA fee, which includes trading costs and custodial fees, from the pure gross composite return. The highest applicable wrap/SMA fee is 2.00% on an annual basis, or 0.50% quarterly from inception to 12/31/2023 and 0.17% monthly from 1/1/2024 to present. Please see important disclosures at the end of this document.
Global equity markets rallied to record highs in the second quarter, with the MSCI ACWI Index rising 14.93% during the period. Global fixed income markets also advanced, as the Bloomberg Global Aggregate Bond Index increased 0.87%. From a style perspective, growth stocks outperformed value, with the MSCI ACWI Growth Index exceeding the MSCI ACWI Value Index by 9.21%.
Performance across global equity markets was broadly positive during the period, led by gains in Asia/Pacific ex-Japan and North America, while Latin America and Africa/Middle East lagged. On a sector basis, ten out of the eleven sectors within the MSCI ACWI Index advanced, led by Information Technology, Industrials, and Financials. Alternatively, Energy, Materials, and Utilities were the worst performers.
Geopolitics remained a source of volatility, particularly in the Middle East, where the ongoing conflict between the U.S. and Iran affected energy markets, shipping routes, and investor sentiment. During the quarter, intermittent military strikes and recurring threats to commercial shipping in and around the Strait of Hormuz kept investors focused on the potential for disruptions to global energy supply. Late in the period, a temporary ceasefire and negotiations briefly eased these concerns. However, developments shortly after quarter-end, including renewed hostilities and President Trump’s statement that the ceasefire was over, underscored the fragility of the situation and the potential for renewed volatility in energy markets.
As the two sides worked toward peace, global economies continued to feel the negative impact of the war. Due to the inflationary shock from the conflict, the European Central Bank raised interest rates during the quarter; however, concerns about stagflation increased on news that real GDP growth in the eurozone had contracted versus the previous quarter. Meanwhile, the Bank of England and U.S. Federal Reserve kept rates steady, despite elevated inflation in both countries. In Asia, the Bank of Japan raised rates, and South Korea’s government passed a $17.7 billion emergency supplementary budget to offset rising oil prices.
Despite the fragile global economic backdrop, earnings in Europe and Asia remained robust, supported by continued demand tied to AI infrastructure and strength in select commodity-linked industries. Beneath the surface, market leadership reflected a more risk-on environment globally, with high-beta stocks generally outperforming low-beta stocks. Companies tied to the buildout of AI-related infrastructure, including semiconductors, memory, power equipment, and other data center suppliers, were among the strongest performers, while more defensive and lower-volatility areas generally lagged.
Performance and Attribution Summary
For the second quarter of 2026, Aristotle Capital’s Global Equity WM Composite posted a total return of 6.92% pure gross of fees (6.40% net of fees), underperforming the MSCI ACWI Index, which returned 14.93%, and the MSCI World Index, which returned 13.76%. Please refer to the table below for detailed performance.
| Performance (%) | 2Q26 | YTD | 1 Year | 3 Years | 5 Years | 10 Years | Since Inception* |
|---|---|---|---|---|---|---|---|
| Global Equity WM Composite (pure gross) | 6.92 | 3.99 | 13.22 | 12.14 | 6.96 | 11.31 | 10.38 |
| Global Equity WM Composite (net) | 6.40 | 2.97 | 11.01 | 9.95 | 4.84 | 9.10 | 8.19 |
| MSCI ACWI Index (net) | 14.93 | 11.25 | 23.67 | 19.70 | 10.98 | 12.78 | 10.68 |
| MSCI World Index (net) | 13.76 | 9.69 | 21.34 | 19.24 | 11.47 | 13.14 | 11.37 |
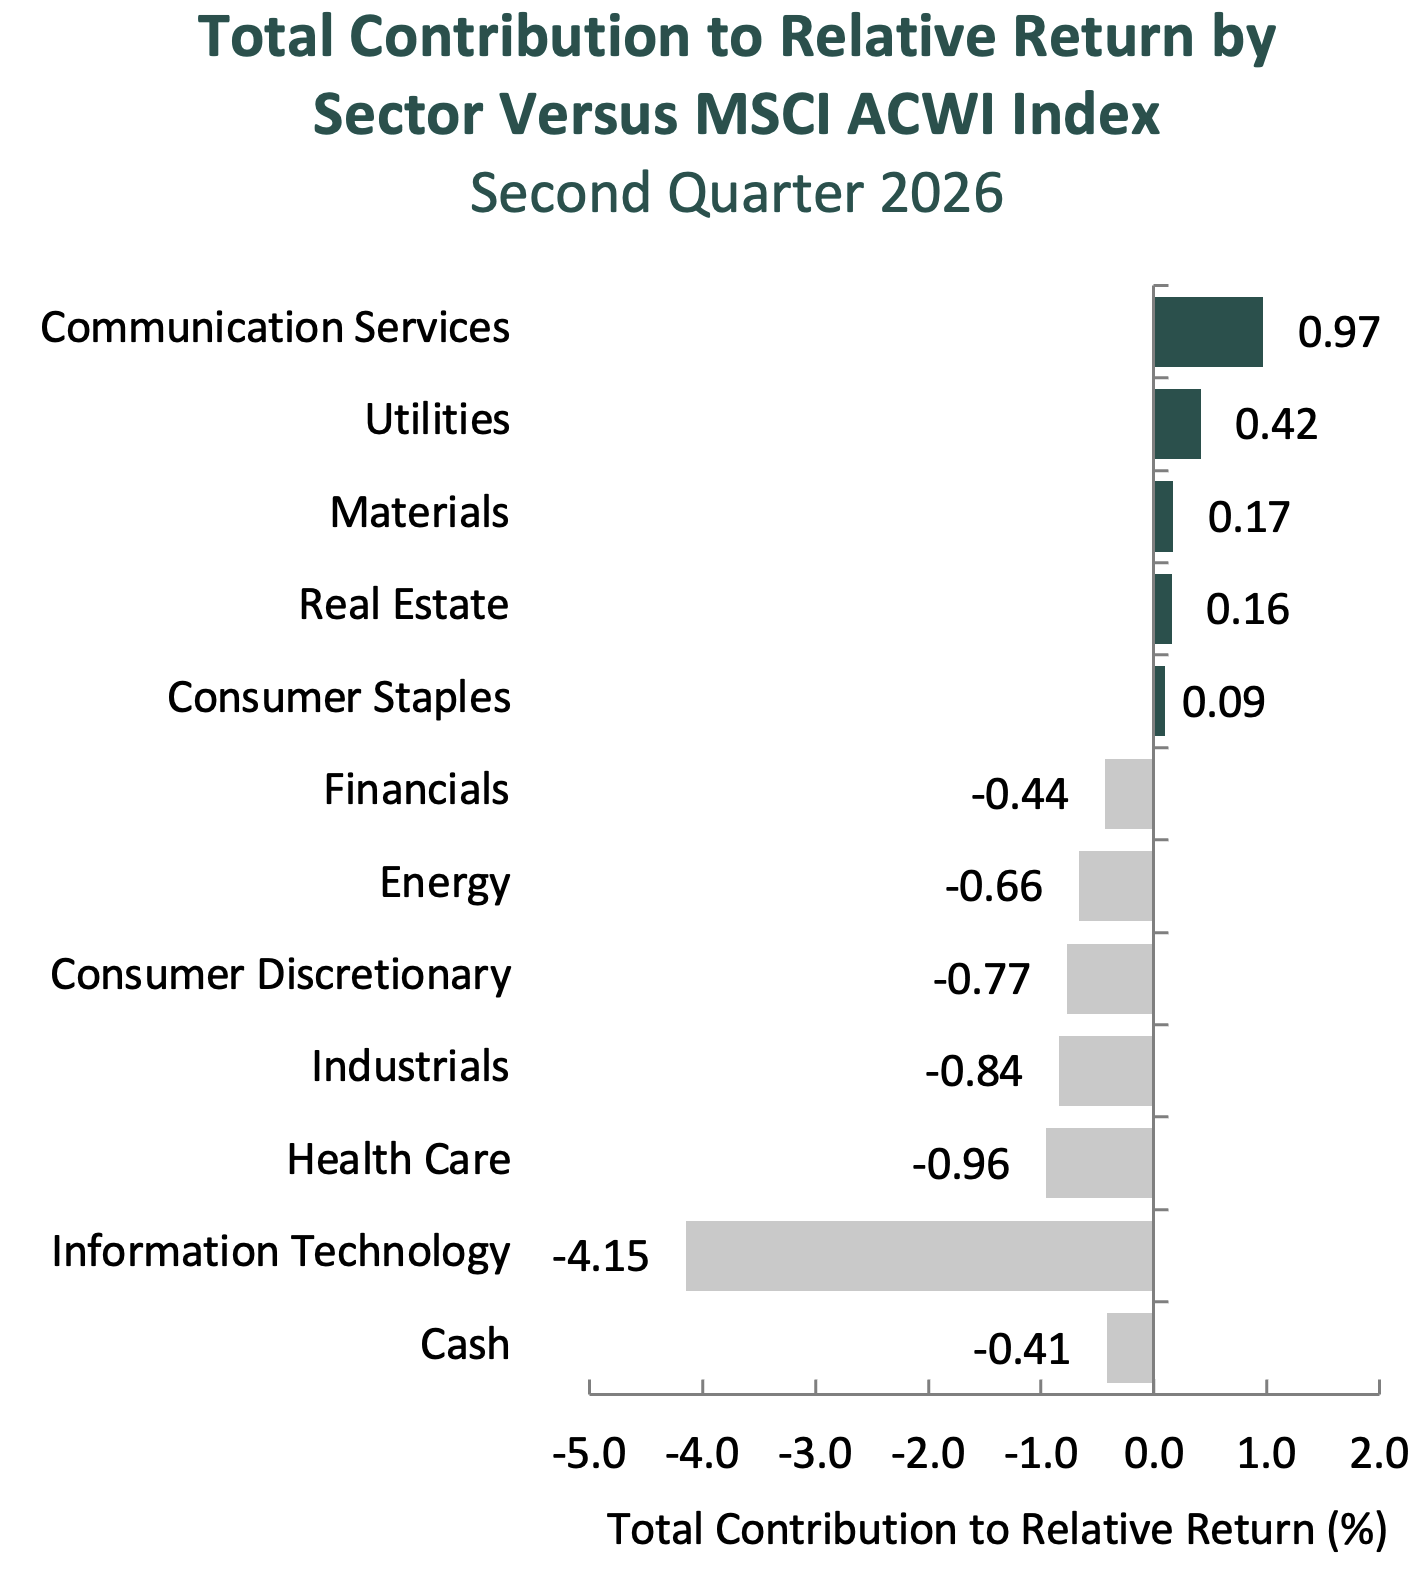
Source: FactSet
Past performance is not indicative of future results. Sector attribution shows how much of a portfolio’s overall return is directly attributable to stock selection and asset allocation decisions within the portfolio, highlighting which sectors contributed or detracted to the total return. Attribution includes the reinvestment of income. Attribution is presented pure gross of fees and does not include the deduction of all fees and expenses that a client or investor has paid or would have paid. Please refer to the gross and net composite returns included within to understand the overall impact of fees.
From a sector perspective, the portfolio’s underperformance relative to the MSCI ACWI Index can be attributed to both security selection and allocation effects. Security selection and an underweight in Information Technology, as well as security selection in Industrials, detracted the most from the portfolio’s relative performance. Conversely, security selection in Communication Services and Materials and a lack of exposure to Utilities contributed most to relative return.
Regionally, both security selection and allocation effects were responsible for the portfolio’s underperformance relative to the MSCI ACWI Index. Security selection in North America detracted the most from relative performance, while security selection in Asia/Pacific ex-Japan contributed the most.
Contributors and Detractors for 2Q 2026
| Relative Contributors | Relative Detractors |
|---|---|
| Microchip Technology | TotalEnergies |
| Qualcomm | Munich Reinsurance |
| Jazz Pharmaceuticals | Martin Marietta Materials |
| FANUC | Otsuka Holdings |
| Daikin Industries | Chevron |
Relative contributors and detractors are based on attribution total effect and exclude benchmark securities not held in the portfolio.
Munich Re, the world’s largest reinsurance company, was a detractor during the quarter. Although the company reported strong operating results, supported by lower-than-expected catastrophe losses and disciplined underwriting, shares declined as investors focused on continued pricing pressure in portions of the global reinsurance market and weaker investment results driven by capital market volatility. We view these pressures as part of the normal insurance cycle rather than a change in the quality of the franchise. Munich Re provides balance sheet capacity and risk expertise to insurers around the world across property and casualty, life and health, cyber, and other complex risks—areas where scale, data, underwriting judgment, and long-standing client relationships are critical. The company’s diversified business mix, including its growing primary insurance operations through ERGO, can help reduce reliance on any single product line or geography, while its strong capital position provides flexibility to absorb catastrophe losses, support clients when capacity is most valuable, and return capital to shareholders. In addition, management continues to differentiate Munich Re through investments in technology, data, and R&D, which should improve underwriting, claims handling, and efficiency over time. We believe these advantages, together with opportunities for share gains in specialty lines such as cyber and in underpenetrated markets such as Asia, position the company to generate attractive returns across insurance cycles.
Martin Marietta, a leading supplier of construction aggregates and building materials, was a detractor during the quarter. Shares modestly declined as investors remained focused on the pace of recovery in residential and private nonresidential construction activity, despite continued strength in infrastructure, energy, and data center-related demand. While the stock underperformed during the period, it remains a strong performer over the past 12 months. We continue to believe Martin Marietta’s irreplaceable aggregates reserves, disciplined pricing strategy, and strategically located asset base position the company to benefit from long-term infrastructure investment and population growth while generating attractive FREE cash flow over time. In addition, the announced acquisition of Lhoist North America further broadens the company’s portfolio into attractive industrial markets and, if executed successfully, should enhance its long-term earnings power and cash flow generation.
Qualcomm, a leading semiconductor and communications technology company, was among the largest contributors for the quarter. Shares recovered as management indicated that the inventory adjustments and production constraints resulting from higher memory costs were progressing largely as expected and that handset revenues from Chinese customers were expected to reach a bottom. As we noted last quarter, we believed these headwinds to be cyclical rather than structural and did not alter our long-term investment thesis. The company also continued to make progress on its long-term strategy of evolving from a handset-centric company into a broader provider of connected computing technologies. Automotive revenue reached another record high, while Internet of Things (IoT) and newer businesses such as AI-enabled PCs, industrial applications, and data center computing continue to represent a growing portion of the company and remain central to its long-term diversification strategy. We believe Qualcomm’s technologies will continue to benefit as connectivity expands across devices and AI workloads increasingly extend from the cloud to the edge, supporting Qualcomm’s ability to generate strong levels of FREE cash flow in the long run.
Jazz Pharmaceuticals, a biopharmaceutical company focused on neuroscience and oncology, was among the largest contributors during the quarter. Shares appreciated as the company delivered strong commercial execution across its portfolio, reinforcing the durability of its neuroscience franchise and the growing contribution from oncology. First-quarter revenue increased by 19% year over year, led by Xywav, Epidiolex, Zepzelca, and Modeyso, while reaffirming its full-year financial guidance. Results also highlighted several catalysts we have previously identified, including the expansion of Zepzelca into front-line maintenance treatment for extensive-stage small cell lung cancer, ongoing growth of Epidiolex in rare epilepsies, and continued uptake of Xywav for narcolepsy and idiopathic hypersomnia (IH), where it remains the only FDA-approved therapy. Management also continued preparations for the launch of Ziihera in a significantly larger cancer indication, which has the potential to meaningfully expand the company’s oncology business. We continue to believe Jazz’s portfolio of differentiated therapies, expanding oncology franchise, and disciplined approach to business development position the company to create long-term value. The company has successfully evolved from a business primarily focused on sleep disorders into a more diversified rare disease and oncology company, supported by strong cash flow generation and continued investment in both its pipeline and strategic acquisitions.
Recent Portfolio Activity
| Buys | Sells |
|---|---|
| Techtronic Industries | Danaher |
| Wal-Mart de Mexico | Dolby Laboratories |
| Tokyo Century |
During the quarter, we sold our positions in Danaher, Dolby Laboratories, and Tokyo Century and purchased Techtronic Industries and Wal-Mart de Mexico.
We first invested in Danaher, a company focused on biotechnology, life sciences and diagnostics, in the first quarter of 2016, attracted by its disciplined capital allocation, differentiated operating culture, and consistent FREE cash flow generation. The business is distinguished by a portfolio of market-leading franchises and a high mix of recurring consumables revenue tied to a large installed base. Its differentiated operating culture, anchored by the Danaher Business System (DBS), has historically enabled the company to be a highly effective acquirer, consistently integrating new businesses, expanding margins, and driving strong FREE cash flow generation. Over our decade-long holding period, Danaher successfully transformed itself from a diversified industrial company into a more focused healthcare business. This evolution included the spinoffs of Fortive, Envista, and Veralto, as well as the acquisition and integration of key assets such as Pall, Cepheid, and Cytiva. The company also increased the contribution from recurring revenue and workflow-based solutions embedded in customer operations, which contributed to the durability and predictability of the business.
More recently, as Danaher has shifted further into more complex, innovation-driven end markets, the application of DBS appears to be less differentiated than it was in Danaher’s traditional manufacturing-oriented businesses. Success in these new end markets is increasingly driven by scientific innovation, faster product cycles, and more specialized customer requirements. At the same time, increased scale and a more centralized organizational structure appear to be limiting flexibility at the business unit level, reducing the speed and effectiveness with which opportunities can be pursued. While we continue to view Danaher as a high-quality business, we believe much of our original investment thesis has now been realized, with fewer company-specific catalysts ahead. Accordingly, we elected to exit the position and redeploy the proceeds into what we view as more attractive opportunities.
We first invested in Dolby Laboratories, the creator and licensor of audio and imaging technologies, in the first quarter of 2022. We were attracted to Dolby’s asset-light licensing model, trusted brand, strong intellectual property portfolio, and deep relationships with both content creators and device makers. We believed Dolby would benefit from the growing demand for more immersive entertainment experiences, allowing the company to extend its technology into new use cases. During our ownership, Dolby executed well in several respects: increasing adoption across content and devices, expanding into newer end markets such as autos and gaming, adding to its patent portfolio, and maintaining the high-margin, cash-generative financial profile that first attracted us. However, adoption has not translated into the level of earnings growth we initially expected. As a result, while we continue to view Dolby as a high-quality franchise and will monitor its monetization efforts, we believe the remaining catalysts lack the visibility and timing we require, and exited the position.
We first invested in Tokyo Century, the Japan-based provider of leasing and specialty finance solutions, in the third quarter of 2024. The company benefits from a diversified platform across equipment leasing, specialty finance, automobility, and global financing, as well as its strategic relationships with partners such as NTT, Itochu, and CSI Leasing. We also saw attractive catalysts in aviation leasing through Aviation Capital Group, IT leasing through CSI Leasing, and data center-related investments. During our ownership, Tokyo Century continued to benefit from favorable aircraft leasing conditions, including tight aircraft supply, rising lease rates, and improved aircraft values, while its broader leasing franchise remained supported by scale, a strong balance sheet, and diversified revenue streams. However, as we reassessed the Global Equity portfolio, we concluded that a more direct investment in Itochu, which owns roughly 30% of Tokyo Century, together with a new investment in Techtronic, offered a more attractive use of capital. Given this overlap and the clearer catalysts we see in these opportunities, we elected to exit Tokyo Century and redeploy the proceeds.
Techtronic Industries Co. Ltd.
Headquartered in Hong Kong, Techtronic Industries (“TTI”) is a global manufacturer of power tools, outdoor power equipment and related accessories. The company operates primarily through two flagship brands: Milwaukee, which serves professional tradespeople, and Ryobi, which targets the DIY and light professional market (including handymen and maintenance professionals whose needs fall between homeowners and full-time trades). Over the past decade, TTI has transformed itself into one of the leading players in the global power tool industry, driven by sustained innovation and disciplined brand investment.
Milwaukee has been the primary growth engine, expanding from approximately $450 million in sales in the early 2000s to roughly $10 billion today. The brand has gained meaningful share in professional trades through a focus on productivity, safety, and battery-powered innovation. Ryobi remains a leading DIY platform, supported by a long-standing distribution relationship with Home Depot, TTI’s largest retail partner.
TTI continues to benefit from the long-term industry transition from corded, gas-powered, and pneumatic tools toward battery-powered platforms. The company’s strategy of maintaining backward compatibility across battery generations has reinforced customer loyalty and created a durable installed base across both Milwaukee and Ryobi ecosystems.
High-Quality Business
Some of the quality characteristics we have identified for TTI include:
- Leading positions in professional and DIY power tools through the Milwaukee and Ryobi brands, supported by strong brand equity, deep engagement with professional tradespeople, and a track record of consistent product innovation;
- A powerful battery ecosystem strategy, with over 110 million M18 and 65 million M12 batteries in circulation and backward and forward compatibility across generations, creating switching costs and repeat purchases across hundreds of compatible tools;
- Ongoing investment in research and development, enabling consistent product innovation, market share gains, and expansion into adjacent product categories; and
- Deep retail partnerships, particularly with Home Depot, reinforced by dedicated in-store sales representation and merchandising support.
Attractive Valuation
We believe shares are attractively valued relative to our estimate of intrinsic value. Our analysis reflects the growing contribution of the Milwaukee franchise, which now represents the majority of operating profit, and the benefits of continued mix shift toward professional products, as well as stabilization of underperforming segments. In addition, as recent investment spending normalizes, we expect FREE cash flow to increase to levels that we believe are not fully reflected in the current share price.
Compelling Catalysts
Catalysts we have identified for TTI, which we believe will cause its stock price to appreciate over our three- to five-year investment horizon, include:
- Continued mix shift toward the higher-margin Milwaukee brand, which has grown from 18% of total sales in 2010 to approximately two-thirds today;
- Geographic expansion of the Milwaukee brand outside the United States, where market share remains below North American levels, and introduction of the Ryobi platform into additional markets such as Latin America and Australia;
- Expansion into adjacent professional categories, including personal protective equipment and modular tool storage systems, thereby increasing wallet share within the professional customer base; and
- Improvement in operating profitability through turnaround of underperforming segments and greater cost discipline.
Wal-Mart de Mexico SAB de CV
Founded in 1952 and headquartered in Mexico City, Wal-Mart de Mexico (“Walmex”) is the largest retailer in Mexico and Central America and a key subsidiary of Walmart Inc., which retains a majority ownership stake. Walmex operates more than 3,800 stores across multiple formats—Bodega Aurrerá (discount stores and the company’s fastest-growing format), Walmart Supercenter (big-box retail), Sam’s Club (membership warehouse), Walmart Express (small supermarkets), and other discount outlets—giving it a uniquely diversified presence across the consumer landscape.
This multi-format approach serves a wide spectrum of customers and shopping occasions—from everyday essentials and large family baskets to convenience and premium purchases. Bodega Aurrerá, for example, has become a household name across Mexico and now represents roughly half of the company’s stores, while Sam’s Club caters to membership customers seeking bulk purchases and higher-ticket items. Together, these formats provide Walmex broad market coverage, geographic reach, and strong brand loyalty across urban centers, suburban communities, and regional towns.
In recent years, the company has significantly expanded its omnichannel ecosystem, investing in e-commerce, logistics, and digital services to enhance convenience and deepen customer engagement. E-commerce is ~8% of total sales, supported by strong growth in online grocery and third-party marketplace offerings. Complementary platforms, such as Cashi (digital payments), BAIT (mobile telecom), and Walmart Connect (digital advertising), extend Walmex’s reach into financial and digital services, strengthening customer ties and building new revenue streams.
High-Quality Business
Some of the quality characteristics we have identified for Walmex include:
- Dominant scale advantages with over 3,000 stores in Mexico, making it the clear market leader in food and general merchandise retail;
- Diversified and resilient revenue base, with a meaningful percentage of sales from grocery—providing recurring traffic and stable cash flow—complemented by general merchandise, fuel, pharmacy, and membership-based services;
- Strong returns on invested capital (~18%), supported by consistent execution and capital discipline; and
- Support from Walmart Inc., which provides access to global best practices, digital tools, and procurement efficiencies.
Attractive Valuation
We believe Walmex is attractively valued relative to its long-term normalized earnings power. In our view, the market underappreciates the company’s ability to grow revenue through ongoing store expansion and strengthen margins and FREE cash flow generation through efficiency gains, scale benefits and continued growth in higher-margin channels, such as private label and e-commerce.
Compelling Catalysts
Catalysts we have identified for Walmex, which we believe will cause its stock price to appreciate over our three- to five-year investment horizon, include:
- Expansion of private label penetration (from mid-teens to mid-20s), which should improve profitability and customer loyalty;
- Further development of the e-commerce platform, with Walmex aiming to become a one-stop shop by combining online grocery and a third-party marketplace, supported by digital tools adapted from Walmart U.S.;
- Disciplined store expansion, with current plans to add approximately 1,500 new stores across Mexico and Central America over the next five years, extending reach and scale advantages; and
- Leadership continuity, as newly appointed interim CEO Cristian Barrientos, a veteran Walmart executive with more than 25 years of experience, provides operational stability and maintains focus on profitable growth during the leadership transition.
Conclusion
As we look ahead, the global backdrop remains complex. Geopolitical developments, central bank decisions, and changes in investor risk appetite can all influence returns over shorter periods, but these factors are difficult to forecast with consistency. Rather than position the portfolio around macro outcomes, we continue to focus on the businesses we own and the actions management teams are taking to increase value over time.
Our investment process centers on the three pillars of Quality, Valuation, and Catalysts. We seek companies with strong competitive positions, capable management teams, financial resilience, and identifiable opportunities to improve profitability and FREE cash flow. While markets can move quickly from one theme to the next, we believe owning high-quality businesses at attractive valuations remains the best way to create value for clients over the long term.
The opinions expressed herein are those of Aristotle Capital Management, LLC (Aristotle Capital) and are subject to change without notice. Past performance is not a guarantee or indicator of future results. This material is not financial advice or an offer to buy or sell any product. You should not assume that any of the securities transactions, sectors or holdings discussed in this report were or will be profitable, or that recommendations Aristotle Capital makes in the future will be profitable or equal the performance of the securities listed in this report. The portfolio characteristics shown relate to the Aristotle Global Equity Advisory strategy. Not every client’s account will have these characteristics. Aristotle Capital reserves the right to modify its current investment strategies and techniques based on changing market dynamics or client needs. There is no assurance that any securities discussed herein will remain in an account’s portfolio at the time you receive this report or that securities sold have not been repurchased. The securities discussed may not represent an account’s entire portfolio and, in the aggregate, may represent only a small percentage of an account’s portfolio holdings. The performance attribution presented is of a representative account from Aristotle Capital’s Global Equity WM Composite. The representative account is a discretionary client account which was chosen to most closely reflect the investment style of the strategy. The criteria used for representative account selection is based on the account’s period of time under management and its similarity of holdings in relation to the strategy. Recommendations made in the last 12 months are available upon request.
Composite returns are presented pure gross and net of the maximum wrap fee and include the reinvestment of all income. Pure gross returns do not reflect the deduction of any trading costs or other fees and are supplemental to the net returns. Net returns are calculated by subtracting the highest applicable wrap/SMA fee, which includes trading costs and custodial fees, from the pure gross composite return. The highest applicable wrap/SMA fee is 2.00% on an annual basis, or 0.50% quarterly from inception to 12/31/2023 and 0.17% monthly from 1/1/2024 to present.
All investments carry a certain degree of risk, including the possible loss of principal. Investments are also subject to political, market, currency and regulatory risks or economic developments. International investments involve special risks that may in particular cause a loss in principal, including currency fluctuation, lower liquidity, different accounting methods and economic and political systems, and higher transaction costs. These risks typically are greater in emerging markets. While Large-capitalization companies may have more stable prices than smaller, less established companies, they are still subject to equity securities risk. In addition, large-capitalization equity security prices may not rise as much as prices of equity securities of small-capitalization companies. Securities of small- and medium-sized companies tend to have a shorter history of operations and be more volatile and less liquid. Value stocks can perform differently from the market as a whole and other types of stocks. The material is provided for informational and/or educational purposes only and is not intended to be and should not be construed as investment, legal or tax advice and/or a legal opinion. Investors should consult their financial and tax adviser before making investments. The opinions referenced are as of the date of publication, may be modified due to changes in the market or economic conditions, and may not necessarily come to pass. Information and data presented has been developed internally and/or obtained from sources believed to be reliable. Aristotle Capital does not guarantee the accuracy, adequacy or completeness of such information.
Aristotle Capital Management, LLC is an independent investment adviser registered under the Investment Advisers Act of 1940, as amended. Registration does not imply a certain level of skill or training. More information about Aristotle Capital, including our investment strategies, fees and objectives, can be found in our Form ADV Part 2, which is available upon request. ACM-2607-69
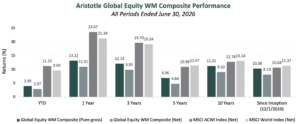
Sources: CAPS CompositeHubTM, MSCI
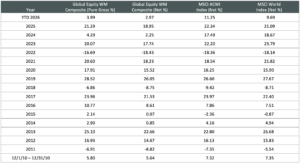
The Aristotle Global Equity WM Composite has an inception date of December 1, 2010. As of 1/1/2024, the composite was renamed from the Global Equity Advisory Composite.
Past performance is not indicative of future results. The information provided should not be considered financial advice or a recommendation to purchase or sell any particular security or product. Performance results for periods greater than one year have been annualized.
Composite returns are presented pure gross and net of the maximum wrap fee and include the reinvestment of all income. Pure gross returns do not reflect the deduction of any trading costs or other fees and are supplemental to the net returns. Net returns are calculated by subtracting the highest applicable wrap/SMA fee, which includes trading costs and custodial fees, from the pure gross composite return. The highest applicable wrap/SMA fee is 2.00% on an annual basis, or 0.50% quarterly from inception to 12/31/2023 and 0.17% monthly from 1/1/2024 to present.
The MSCI ACWI Index captures large and mid cap representation across Developed Markets (DM) and Emerging Markets (EM) countries. The index covers approximately 85% of the global investable equity opportunity set. The MSCI ACWI Equal Weighted Index represents an alternative weighting scheme to its market capitalization-weighted parent index, the MSCI ACWI. The Index includes the same constituents as its parent (large and mid-cap securities from 23 developed markets and 24 emerging markets countries). However, at each quarterly rebalance date, all index constituents are weighted equally, effectively removing the influence of each constituent’s current price (high or low). The MSCI World Index (Net) is a free float-adjusted market capitalization-weighted index that is designed to measure the equity market performance of developed markets. The MSCI World Index includes the following 23 developed market countries: Australia, Austria, Belgium, Canada, Denmark, Finland, France, Germany, Hong Kong, Ireland, Israel, Italy, Japan, Netherlands, New Zealand, Norway, Portugal, Singapore, Spain, Sweden, Switzerland, the United Kingdom and the United States. The index returns are net of withholding taxes. The MSCI ACWI Index (Net) was stated as the primary benchmark on June 1, 2024 and the MSCI World Index (Net) became the secondary benchmark. The MSCI Emerging Markets Index is a free float-adjusted market capitalization-weighted index that is designed to measure equity market performance of emerging markets. The MSCI Emerging Markets Index consists of the following 24 emerging market country indexes: Brazil, Chile, China, Colombia, Czech Republic, Egypt, Greece, Hungary, India, Indonesia, Korea, Kuwait, Malaysia, Mexico, Peru, Philippines, Poland, Qatar, Saudi Arabia, South Africa, Taiwan, Thailand, Turkey and United Arab Emirates. The MSCI ACWI Growth Index captures large and mid-cap securities exhibiting overall growth style characteristics across 23 developed markets countries and 24 emerging markets countries. The MSCI ACWI Value Index captures large and mid-cap securities exhibiting overall value style characteristics across 23 developed markets countries and 24 emerging markets countries. The MSCI Europe Index captures large and mid-cap representation across 15 developed markets countries in Europe. With approximately 400 constituents, the Index covers approximately 85% of the free float-adjusted market capitalization across the European developed markets equity universe. The MSCI Japan Index is designed to measure the performance of the large and mid-cap segments of the Japanese market. With approximately 200 constituents, the Index covers approximately 85% of the free float-adjusted market capitalization in Japan. The S&P 500® Index is the Standard & Poor’s Composite Index of 500 stocks and is a widely recognized, unmanaged index of common stock prices. The S&P 500® Equal Weight Index is designed to be the size-neutral version of the S&P 500. It includes the same constituents as the market capitalization-weighted S&P 500, but each company in the S&P 500 Equal Weight Index is allocated the same weight at each quarterly rebalance. The Bloomberg Global Aggregate Bond Index is a flagship measure of global investment grade debt from 27 local currency markets. This multi-currency benchmark includes Treasury, government-related, corporate and securitized fixed rate bonds from both developed and emerging markets issuers. The Brent Crude Oil Index is a major trading classification of sweet light crude oil that serves as a major benchmark price for purchases of oil worldwide. The volatility (beta) of the Composite may be greater or less than the benchmarks. It is not possible to invest directly in these indexes.