Commentary
Core Equity 2Q 2025
Markets Review
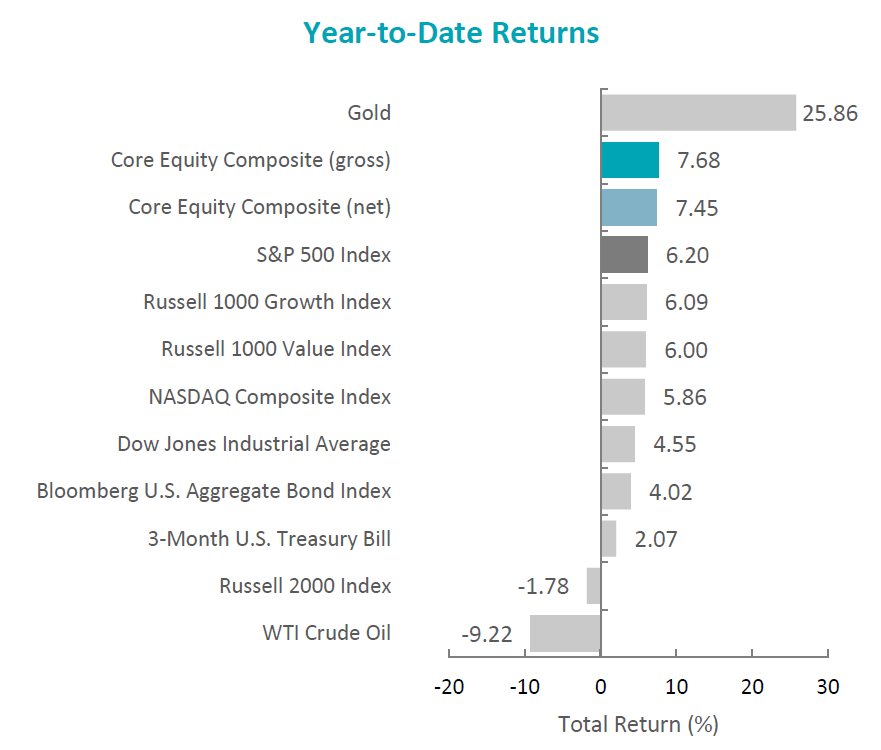
Despite some early volatility in the second quarter, the U.S. equity market rebounded with strength, with the S&P 500 Index rising 10.94% during the period. Bonds also delivered positive returns, as the Bloomberg U.S. Aggregate Bond Index rose 1.21%.
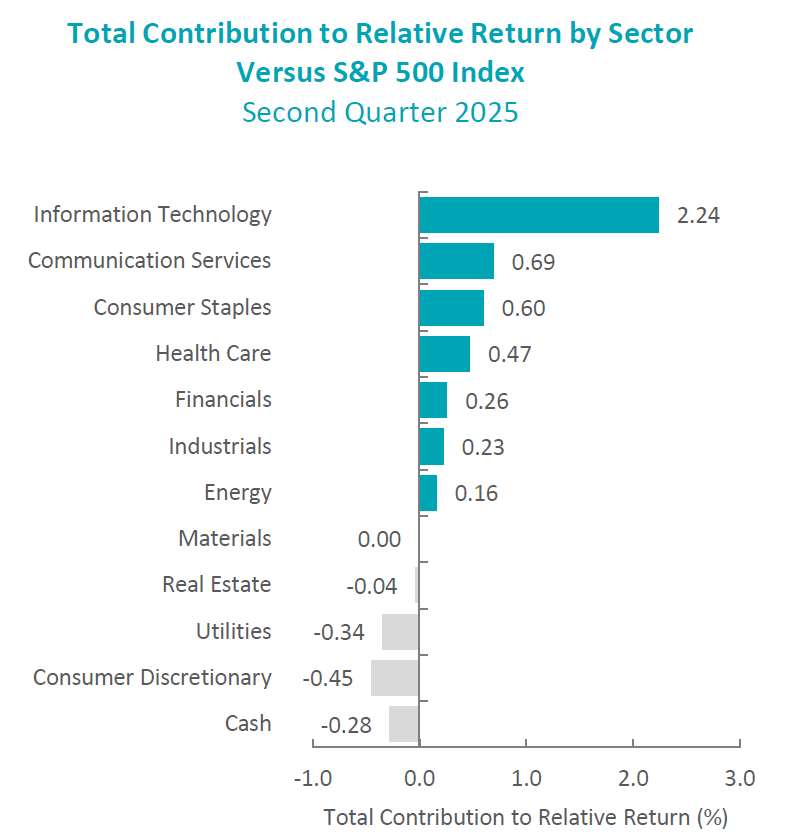
On a sector basis, positive performance was led by eight of the eleven sectors within the S&P 500 Index in the second quarter of 2025. The best-performing sectors were Information Technology and Communication Services. The weakest sectors were Energy and Health Care.
Sources: CAPS CompositeHubTM, Bloomberg
Past performance is not indicative of future results. Aristotle Atlantic Core Equity Composite returns are presented gross and net of investment advisory fees and include the reinvestment of all income. Gross returns will be reduced by fees and other expenses that may be incurred in the management of the account. Net returns are presented net of actual investment advisory fees and after the deduction of all trading expenses. Aristotle Atlantic Composite returns are preliminary pending final account reconciliation. Please see important disclosures at the end of this document.
Trade policy remained a focal point. In early April, President Trump introduced a universal 10% import tariff, as well as reciprocal tariffs on dozens of countries, as part of “Liberation Day.” Roughly a week later, and to encourage the start of negotiations, a 90-day pause on reciprocal tariffs was enacted for almost all countries. Later in the quarter, the U.S. and U.K. finalized the Economic Prosperity Deal, which included expanding American access to British markets and lowering tariffs on the first 100,000 of U.K. autos entering the U.S. each year. Meanwhile, negotiations continued with the EU, Japan, Canada and India. After escalating, trade tensions with China eased somewhat; however, considerable tariffs and other trade policy disputes remain for both countries as negotiations continue. Shortly after quarter end, Congress also passed the Trump administration’s sweeping fiscal legislation, which included major tax incentives, infrastructure funding and manufacturing subsidies. Concurrently, the U.S. Dollar Index (DXY) fell 10.7% in the first six months of the year—the fastest decline since 1973.
Economic data released during the quarter painted a mixed picture. U.S. real GDP for the first quarter contracted at an annual rate of 0.5%, primarily due to reduced government spending and a rise in imports. Meanwhile, the Consumer Price Index (CPI) rose 2.4% year-over-year in May, and the unemployment rate remained close to 4%. Notably, a key gauge of consumer confidence rebounded in June, increasing for the first time in six months. However, given the ongoing uncertainty around the macroeconomic outlook, the Federal Reserve opted to hold its policy rate steady at a range of 4.25% to 4.50%, signaling a cautious, data-dependent stance.
Corporate fundamentals continued to serve as a relative bright spot, as S&P 500 companies reported 12.9% year-over-year earnings growth, with 78% of companies exceeding EPS expectations. Still, concerns around global trade and input costs were evident, with more than 425 companies referencing tariffs in earnings calls and nearly 12% issuing negative EPS guidance for the quarter ahead. Management teams broadly emphasized cost discipline and capital flexibility in the face of persistent macro headwinds.
In geopolitics, tensions in the Middle East escalated sharply during the quarter, with Israel and Iran engaging in direct missile exchanges—their most overt confrontation in decades. A succession of precision strikes on key Iranian figures and military sites, as well as U.S. airstrikes on nuclear infrastructure, further fueled fears of a broader regional conflict. However, after 12 days of war, a ceasefire was reached late in the quarter, easing immediate tensions but leaving uncertainty over its durability. In Europe, Russian forces entered eastern Ukraine in the Dnipropetrovsk region for the first time in three years. While the two sides engaged in a second round of negotiations and completed prisoner exchanges, prospects of a material advancement toward a ceasefire remain unclear. Despite the heightened geopolitical risks, WTI crude oil fell 8.9% during the quarter.
Performance and Attribution Summary
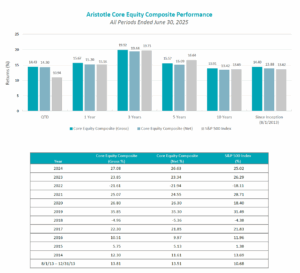
For the second quarter of 2025, Aristotle Atlantic’s Core Equity Composite posted a total return of 14.43% gross of fees (14.30% net of fees), outperforming the S&P 500 Index, which recorded a total return of 10.94%.
| Performance (%) | 2Q25 | 1 Year | 3 Years | 5 Years | 10 Years | Since Inception* |
|---|---|---|---|---|---|---|
| Core Equity Composite (gross) | 14.43 | 15.67 | 19.92 | 15.57 | 13.91 | 14.40 |
| Core Equity Composite (net) | 14.30 | 15.20 | 19.44 | 15.09 | 13.42 | 13.88 |
| S&P 500 Index | 10.94 | 15.16 | 19.71 | 16.64 | 13.65 | 13.62 |
Source: FactSet
Past performance is not indicative of future results. Sector attribution shows how much of a portfolio’s overall return is directly attributable to stock selection and asset allocation decisions within the portfolio, highlighting which sectors contributed or detracted to the total return. Attribution includes the reinvestment of income. Attribution is presented gross of fees and does not include the deduction of all fees and expenses that a client or investor has paid or would have paid. Please refer to the gross and net composite returns included within to understand the overall impact of fees. Please see important disclosures at the end of this document.
During the second quarter, the portfolio’s outperformance relative to the S&P 500 Index was due to security selection. Security selection in Information Technology and Health Care contributed the most to relative performance; conversely, security selection in Consumer Discretionary and Utilities detracted from relative performance.
Contributors and Detractors for 2Q 2025
| Relative Contributors | Relative Detractors |
|---|---|
| Oracle | Becton, Dickinson and Company |
| Broadcom | Chubb |
| Trane Technologies | Halliburton |
| Adaptive Biotechnologies | Bio-Techne |
| Apple | American Water Works |
Contributors
Oracle
Oracle contributed to performance in the second quarter, as the company reported strong quarterly results that highlighted continued strong demand for the company’s OCI infrastructure, sustained growth in the company’s SaaS apps business, and accelerating growth trends in the cloud database segment. Management highlighted RPO growth of over 100%, which speaks to continuing demand for Oracle’s infrastructure and software products over a multi-year period.
Broadcom
Broadcom contributed to performance in the second quarter, as the company reported strong quarterly results for its AI compute and networking business, as well as its VMware segment. The company also provided positive commentary on the setup for the AI-related silicon business units for the rest of 2025, and also for 2026, as strong customer demand for AI silicon for training and inference continues.
Detractors
Becton, Dickinson and Company
Becton Dickinson detracted from relative performance in the second quarter following a worse-than-expected fiscal quarter earnings report in which the company felt the impact of cuts to the National Institutes of Health (NIH) budget and uncertainty around future cuts. Furthermore, forward earnings and revenue guidance were reduced to reflect the continued weakness in funding for biosciences R&D and the expected impact of tariffs.
Chubb
Chubb detracted from performance in the second quarter, primarily due to a market rotation out of defensive names amid a broader market rally led by technology and other cyclical sectors. The company’s first quarter earnings report showed slowing growth in P&C net written premiums, raising concerns about potentially softening pricing trends in its commercial insurance business following several years of strong performance.
Recent Portfolio Activity
The table below shows all buys and sells completed during the quarter, followed by a brief rationale.
| Buys | Sells |
|---|---|
| Expedia Group | |
| Zoetis |
Buys
There were no buys in the second quarter of 2025.
Sells
Expedia Group
We sold Expedia Group due to a higher risk of a recession following the significant increase in global tariffs, which can be expected to reduce overall levels of economic activity. In addition, the negative impact on the wealth effect due to potentially declining equity markets will likely impact demand for retail travel. Travel is among the most discretionary spend categories within the consumer discretionary sector.
Zoetis
We sold Zoetis, as concerns continue to grow about competitive entrants in the dermatology and parasiticides animal health marketplace. While the company has continued to execute well in the face of new entrants, we believe that this will continue to be an overhang on the stock in the near to medium term. Given the premium valuation versus other areas in health care, we believe there is more upside elsewhere and are exiting our position in the stock.
Outlook
The equity markets in the second quarter rose sharply on hopes of a reasonable resolution to tariffs and a resilient economy. Interest rates were largely unchanged for the quarter, with the 10-year Treasury yield at 4.2%. With the looming tariff deadline of July 9th, the markets reacted positively to reported progress. The July 4th deadline for Congress to pass the extension to tax cuts also seems to be progressing. The economic data was mostly in line with expectations, with employment steady and inflation data just above the Fed’s 2% target. With the strong rebound in equity markets, valuation levels are once again above historical averages. Our focus will continue to be at the company level, with an emphasis on seeking to invest in companies with secular tailwinds or strong product-driven cycles.
The opinions expressed herein are those of Aristotle Atlantic Partners, LLC (Aristotle Atlantic) and are subject to change without notice. Past performance is not a guarantee or indicator of future results. This material is not financial advice or an offer to purchase or sell any product. You should not assume that any of the securities transactions, sectors or holdings discussed in this report were or will be profitable, or that recommendations Aristotle Atlantic makes in the future will be profitable or equal the performance of the securities listed in this report. The portfolio characteristics shown relate to the Aristotle Atlantic Core Equity strategy. Not every client’s account will have these characteristics. Aristotle Atlantic reserves the right to modify its current investment strategies and techniques based on changing market dynamics or client needs. There is no assurance that any securities discussed herein will remain in an account’s portfolio at the time you receive this report or that securities sold have not been repurchased. The securities discussed may not represent an account’s entire portfolio and, in the aggregate, may represent only a small percentage of an account’s portfolio holdings. The performance attribution presented is of a representative account from Aristotle Atlantic’s Core Equity Composite. The representative account is a discretionary client account which was chosen to most closely reflect the investment style of the strategy. The criteria used for representative account selection is based on the account’s period of time under management and its similarity of holdings in relation to the strategy. Recommendations made in the last 12 months are available upon request.
Returns are presented gross and net of investment advisory fees and include the reinvestment of all income. Gross returns will be reduced by fees and other expenses that may be incurred in the management of the account. Net returns are presented net of actual investment advisory fees and after the deduction of all trading expenses.
All investments carry a certain degree of risk, including the possible loss of principal. Investments are also subject to political, market, currency and regulatory risks or economic developments. International investments involve special risks that may in particular cause a loss in principal, including currency fluctuation, lower liquidity, different accounting methods and economic and political systems, and higher transaction costs. These risks typically are greater in emerging markets. While Large-capitalization companies may have more stable prices than smaller, less established companies, they are still subject to equity securities risk. In addition, large-capitalization equity security prices may not rise as much as prices of equity securities of small-capitalization companies. Securities of small- and medium-sized companies tend to have a shorter history of operations, be more volatile and less liquid. Value stocks can perform differently from the market as a whole and other types of stocks. The material is provided for informational and/or educational purposes only and is not intended to be and should not be construed as investment, legal or tax advice and/or a legal opinion. Investors should consult their financial and tax adviser before making investments. The opinions referenced are as of the date of publication, may be modified due to changes in the market or economic conditions, and may not necessarily come to pass. Information and data presented has been developed internally and/or obtained from sources believed to be reliable. Aristotle Capital does not guarantee the accuracy, adequacy or completeness of such information.
Aristotle Atlantic Partners, LLC is an independent registered investment adviser under the Advisers Act of 1940, as amended. Registration does not imply a certain level of skill or training. More information about Aristotle Atlantic, including our investment strategies, fees and objectives, can be found in our Form ADV Part 2, which is available upon request. AAP-2507-10
Sources: CAPS CompositeHubTM
Composite returns for all periods ended June 30, 2025 are preliminary pending final account reconciliation.
The Aristotle Core Equity Composite has an inception date of August 1, 2013 at a predecessor firm. During this time, Mr. Fitzpatrick had primary responsibility for managing the strategy. Performance starting November 1, 2016 was achieved at Aristotle Atlantic.
Past performance is not indicative of future results. Performance results for periods greater than one year have been annualized. Returns are presented gross and net of investment advisory fees and include the reinvestment of all income. Gross returns will be reduced by fees and other expenses that may be incurred in the management of the account. Net returns are presented net of actual investment advisory fees and after the deduction of all trading expenses.
The Russell 1000® Growth Index measures the performance of the large cap growth segment of the U.S. equity universe. It includes those Russell 1000 companies with higher price-to-book ratios and higher forecasted growth values. This index has been selected as the benchmark and is used for comparison purposes only. The Russell 1000® Value Index measures the performance of the large cap value segment of the U.S. equity universe. It includes those Russell 1000 companies with lower price-to-book ratios and lower expected growth values. The S&P 500® Index is the Standard & Poor’s Composite Index of 500 stocks and is a widely recognized, unmanaged index of common stock prices. The Dow Jones Industrial Average® is a price-weighted measure of 30 U.S. blue-chip companies. The Index covers all industries except transportation and utilities. The NASDAQ Composite Index measures all NASDAQ domestic and international based common type stocks listed on The NASDAQ Stock Market. The NASDAQ Composite includes over 3,000 companies, more than most other stock market indices. The Bloomberg U.S. Aggregate Bond Index is an unmanaged index of domestic investment grade bonds, including corporate, government and mortgage-backed securities. The WTI Crude Oil Index is a major trading classification of sweet light crude oil that serves as a major benchmark price for oil consumed in the United States. The Russell 2000® Index measures the performance of the small cap segment of the U.S. equity universe. The Russell 2000 Index is a subset of the Russell 3000® Index representing approximately 10% of the total market capitalization of that index. It includes approximately 2000 of the smallest securities based on a combination of their market cap and current index membership. The 3-Month U.S. Treasury Bill is a short-term debt obligation backed by the U.S. Treasury Department with a maturity of three months. The U.S. Dollar Index (DXY) is a measure of the value of the U.S. dollar relative to the value of a basket of currencies of the majority of the United States’ most significant trading partners. The Consumer Price Index (CPI) is a measure of the average change over time in the prices paid by urban consumers for a market basket of consumer goods and services. While stock selection is not governed by quantitative rules, a stock typically is added only if the company has an excellent reputation, demonstrates sustained growth and is of interest to a large number of investors. The volatility (beta) of the Composite may be greater or less than its respective benchmarks. It is not possible to invest directly in these indices.