


Research
Patience Powered by Fundamental Research
Small Caps: Improving Fundamentals Meet Attractive Valuations
What happens when accelerating earnings growth meets historically attractive valuations? The investment case for small caps becomes increasingly compelling.
Despite recent market volatility, small cap fundamentals continue to strengthen, supported by improving earnings momentum and significant valuation discounts relative to large caps.
Our latest research highlights several encouraging trends:
- Earnings Momentum Is Accelerating: Russell 2000 earnings are projected to grow 25% in 2026 and nearly 22% in 2027, potentially outpacing large cap earnings growth next year. A growing percentage of companies are reporting positive earnings and sales growth.
- Valuations Remain Attractive: Small caps trade at significant discounts to large caps across multiple valuation measures, with small cap value and core stocks particularly inexpensive relative to growth peers.
- Free Cash Flow Stands Out: Small cap companies generating positive free cash flow trade at a substantial discount to their large cap counterparts, with relative valuations near historical lows.
- Fundamentals Are Driving Returns: Over the past 12 months, earnings growth, not multiple expansion, has been the primary driver of equity returns, highlighting improving fundamentals despite valuation compression.
The takeaway?
Accelerating earnings growth and attractive valuations provide a constructive backdrop for small caps. However, meaningful differences in profitability, balance sheet strength, and valuations reinforce the importance of disciplined fundamental research and active stock selection.
Explore our small caps observations for deeper insight.
Small Cap Earnings and Sales Growth Have Improved
Indexed Russell 2000 and S&P 600 Indexed Earnings (LTM)
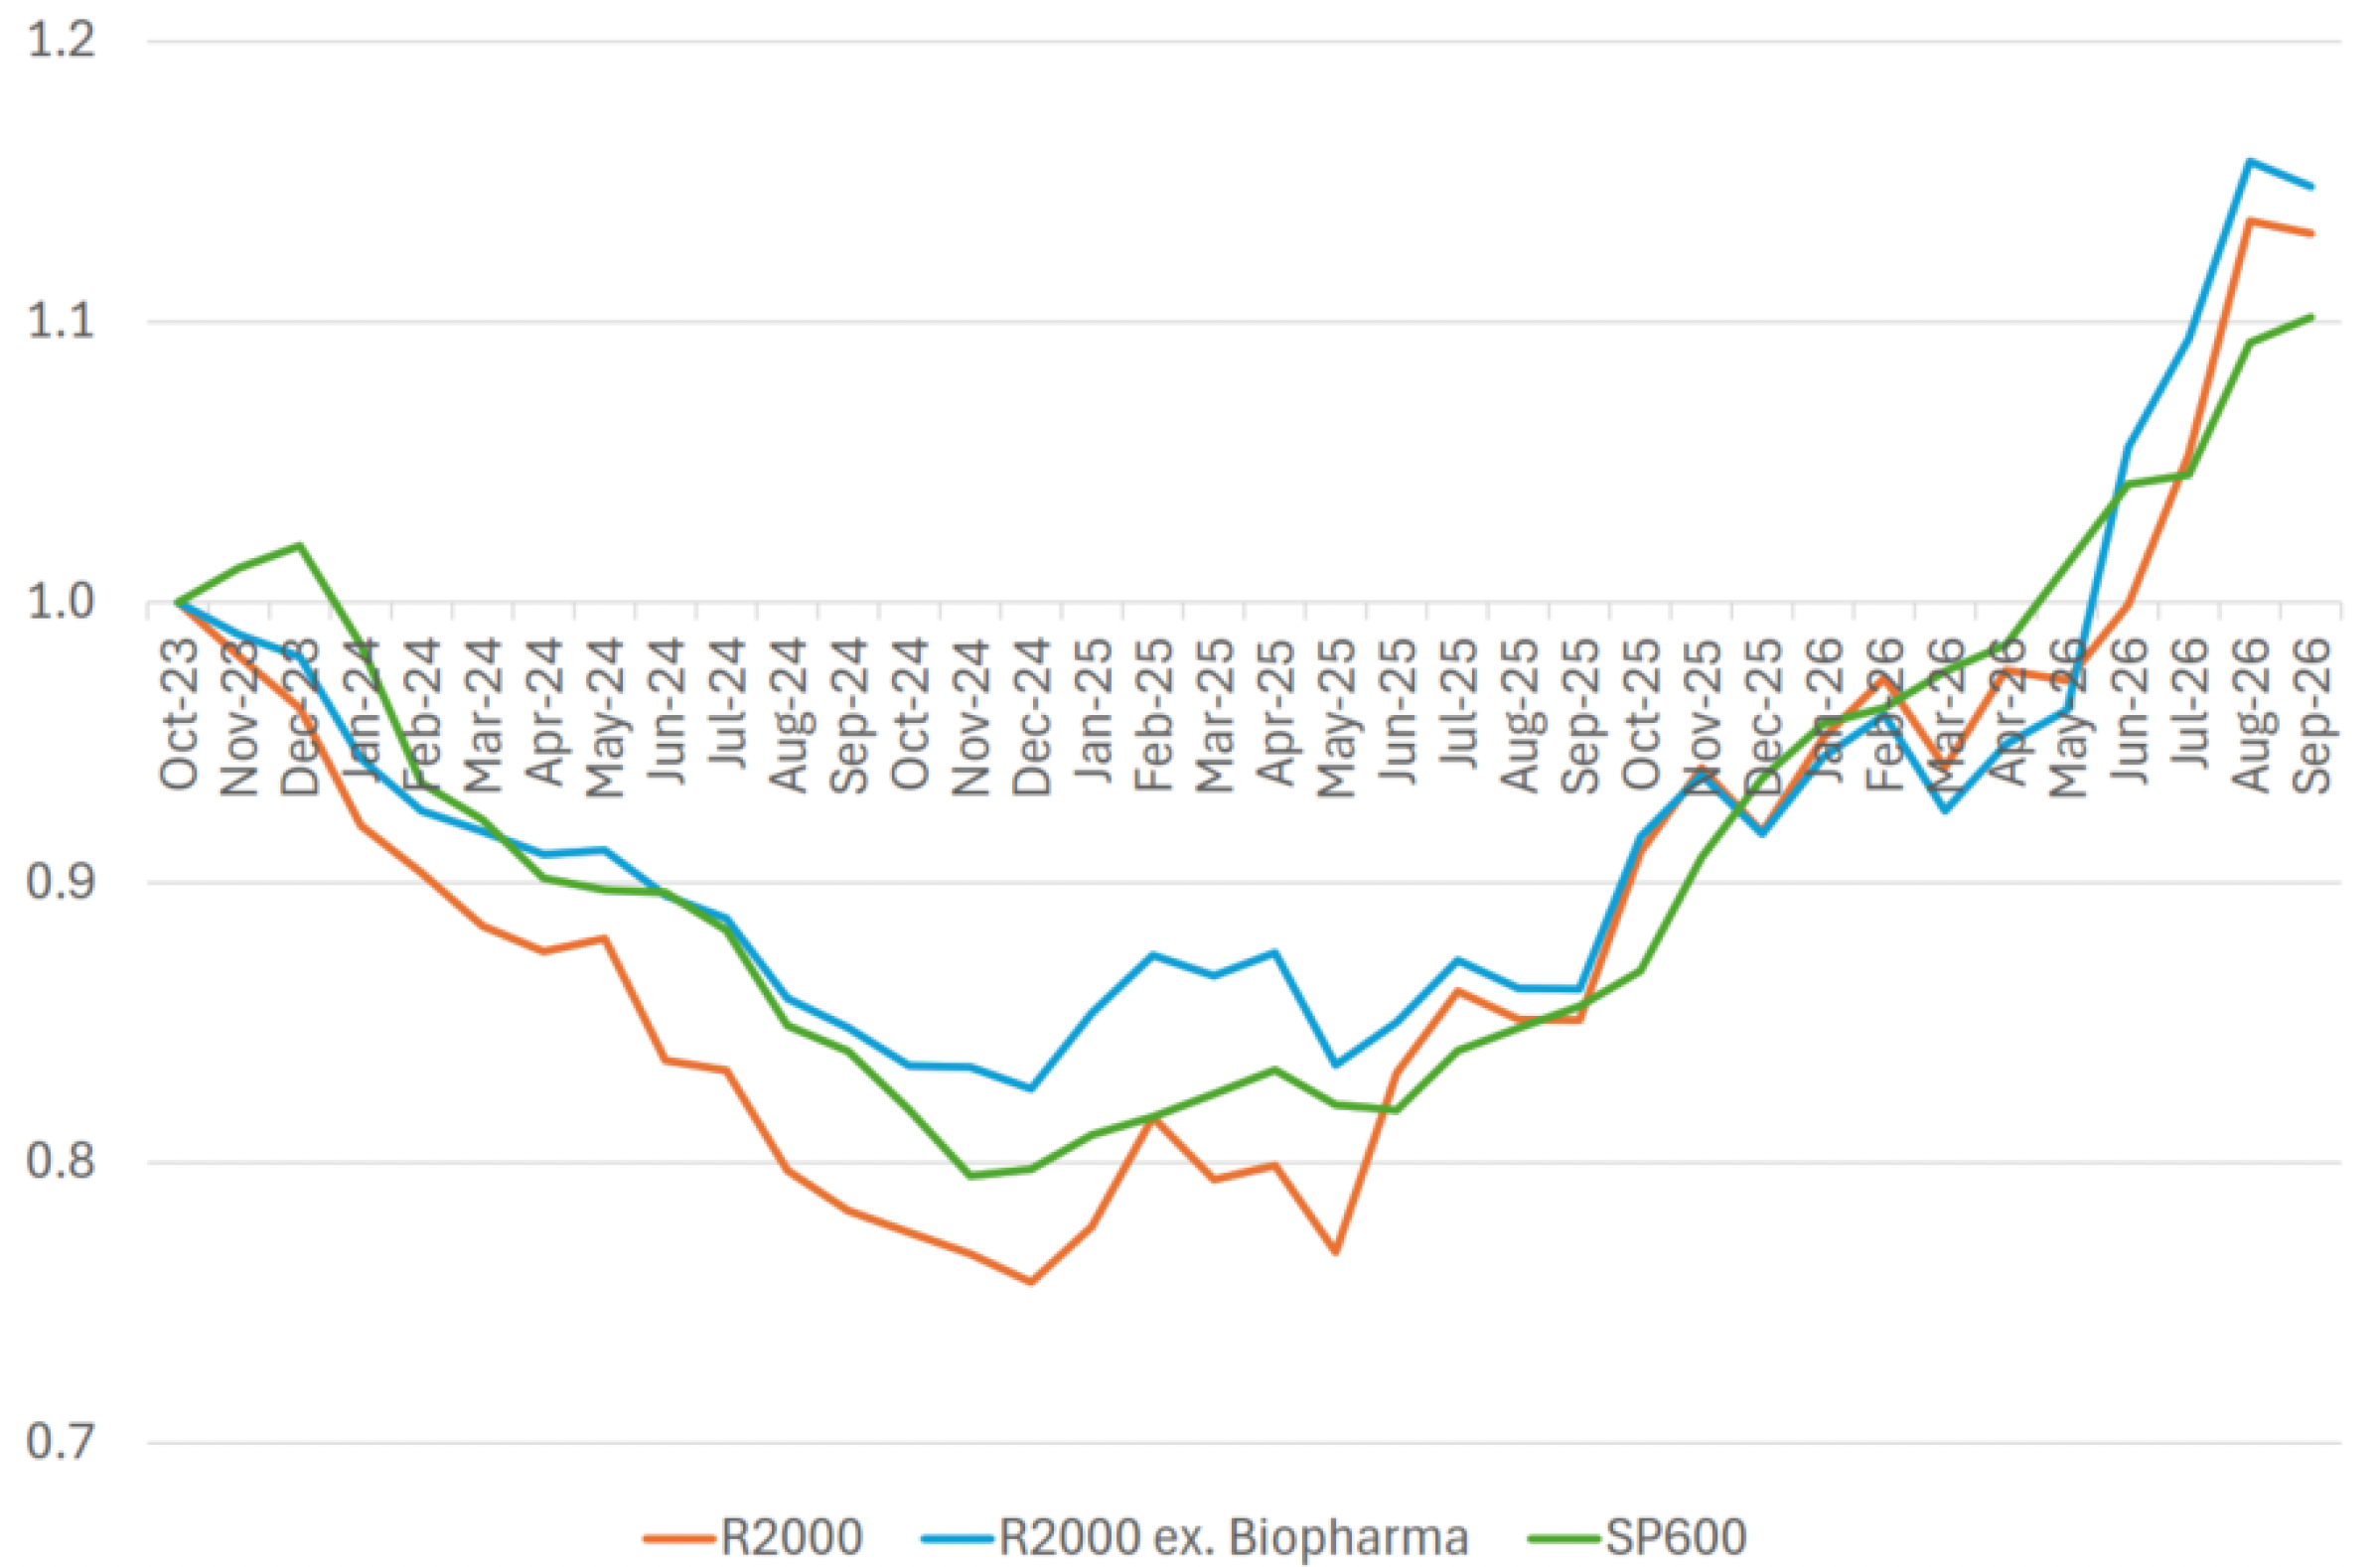
Source: Furey Research Partners as of 9/30/2026.
Small Caps Cheap vs. History and Up Cap
As of September 30, 2026
Small caps are less expensive vs. history than large caps across five of six metrics.
Russell 2000, Russell Midcap and Russell 1000: Valuation premium vs history, 1/31/1985-9/30/2026 (%)
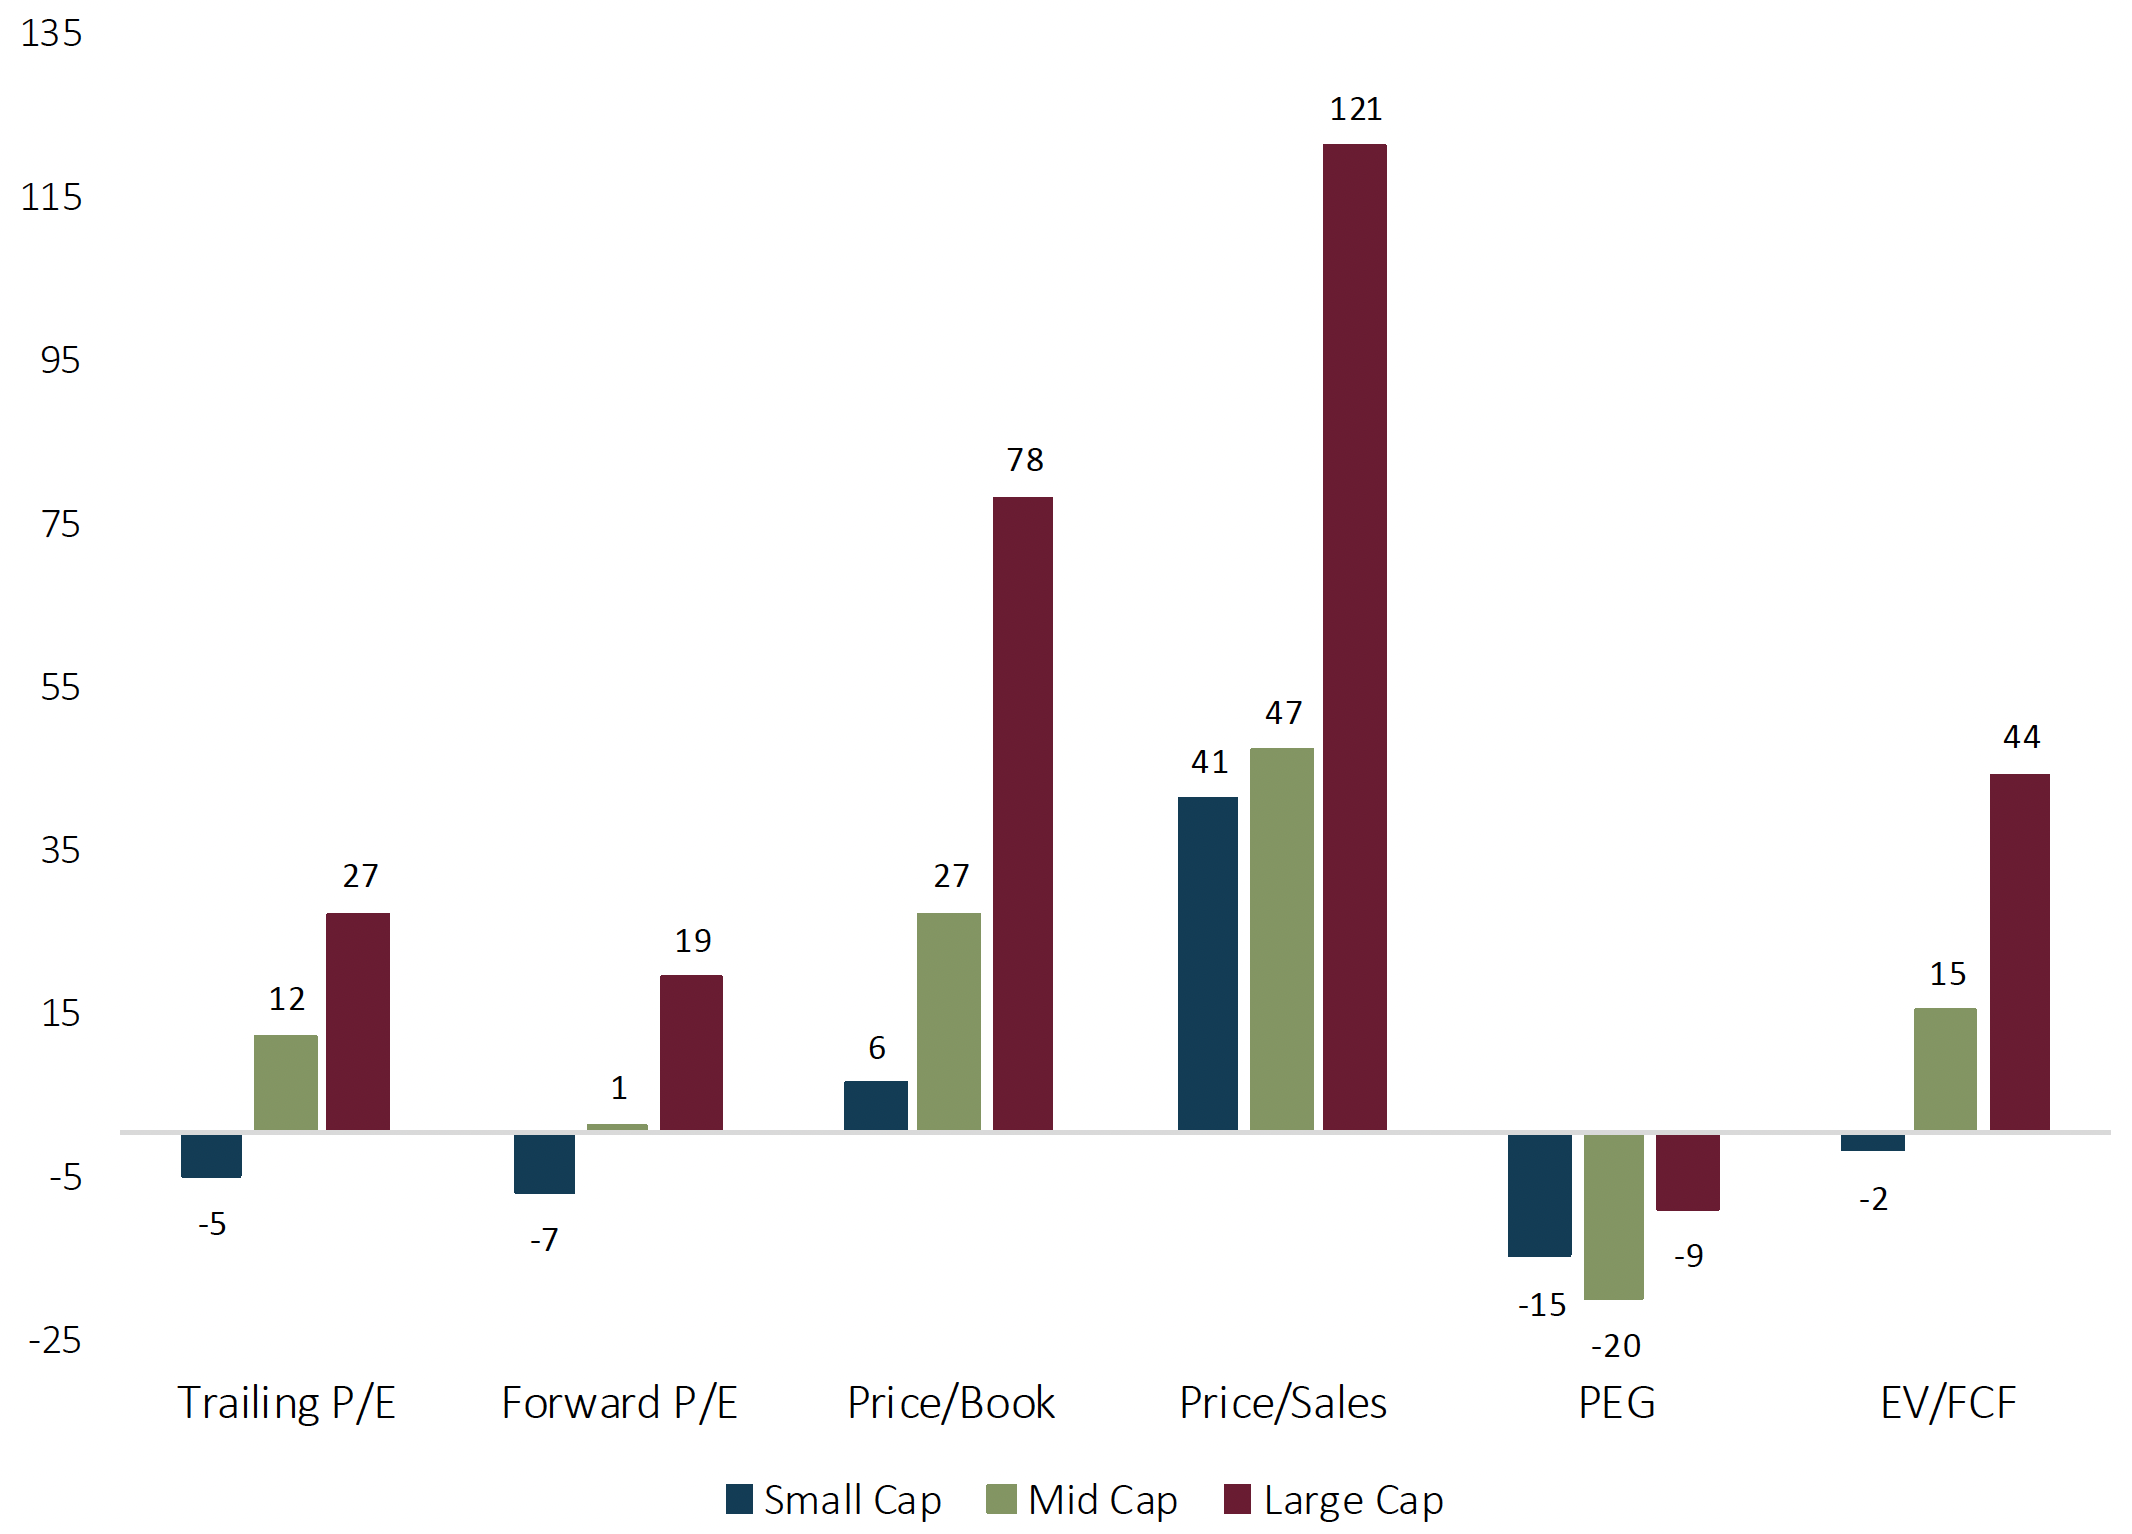
Source: BofA Global Research; FactSet as of 9/30/2026.
Large Caps have been Trading at a Premium to Small Caps since 2020
As of September 30, 2026
Relative P/E (LTM) Russell 1000 vs. Russell 2000
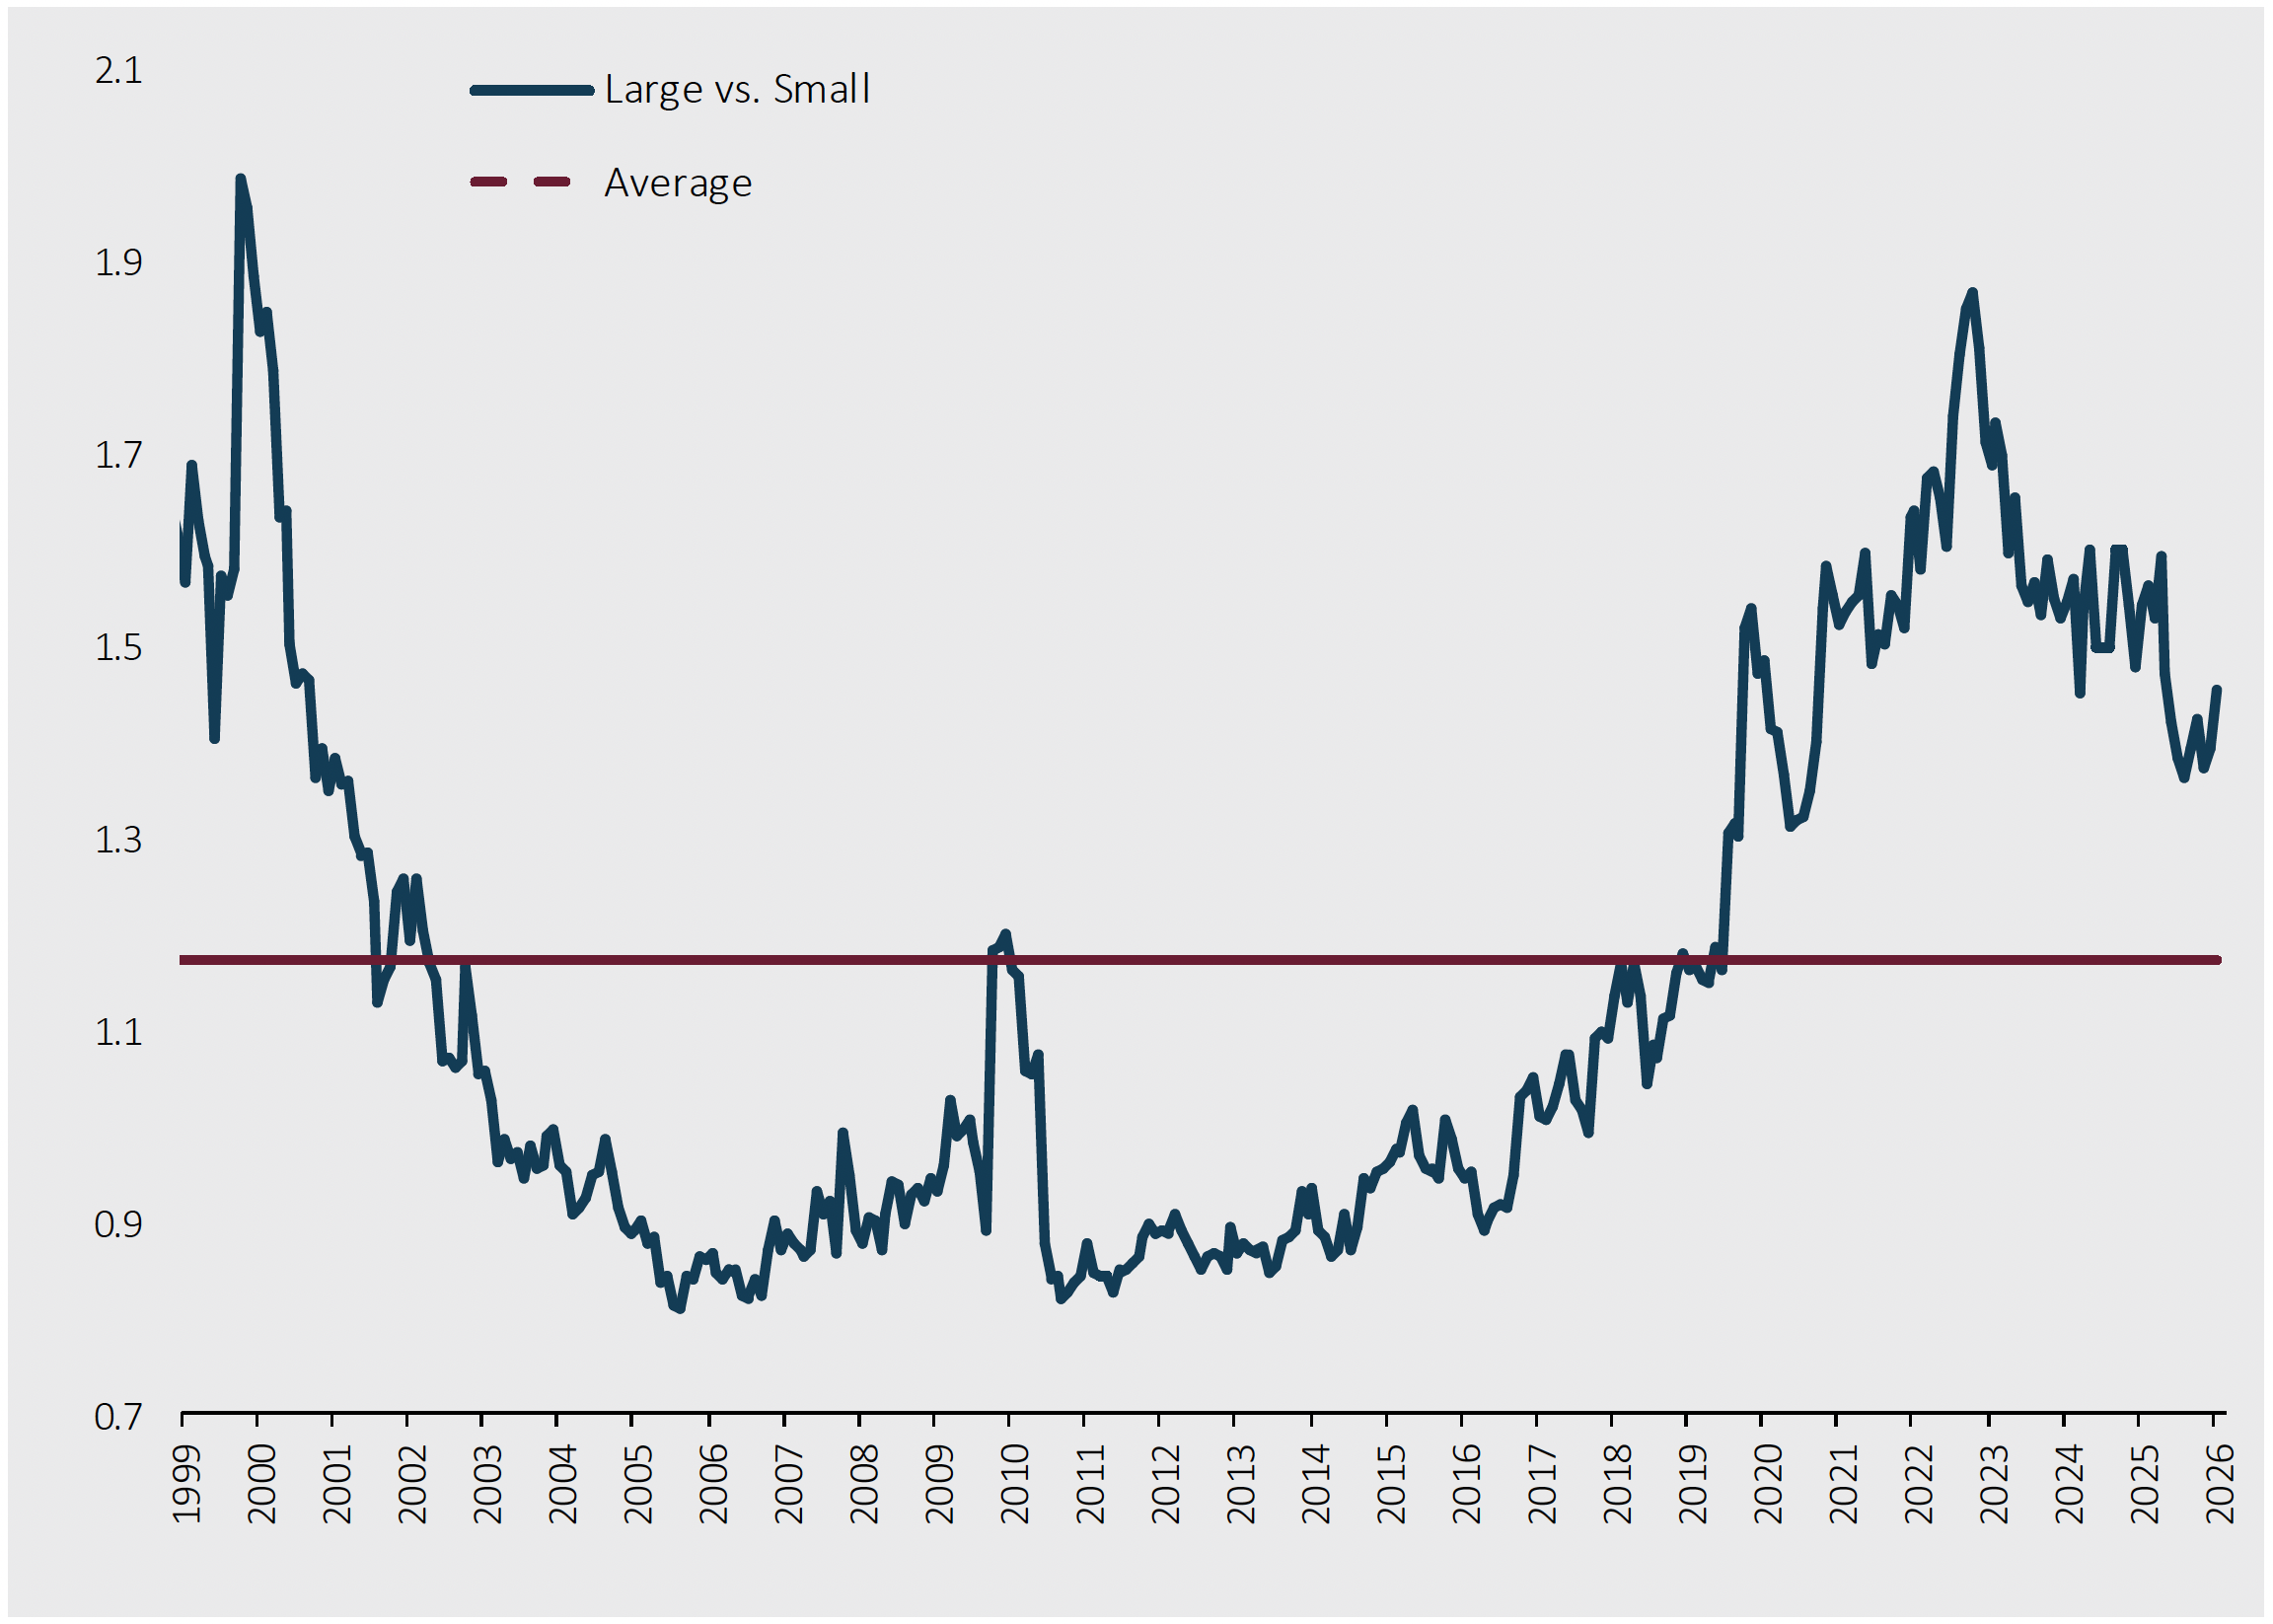
Source: FactSet. Based on trailing 12-month earnings. 9/30/1999 – 9/30/2026.
Small Cap Free Cash Flow is Attractively Priced
Small cap free cash flow is one of the few areas that is not expensive
Enterprise Value/Free Cash Flow LTM (Non-Financials)
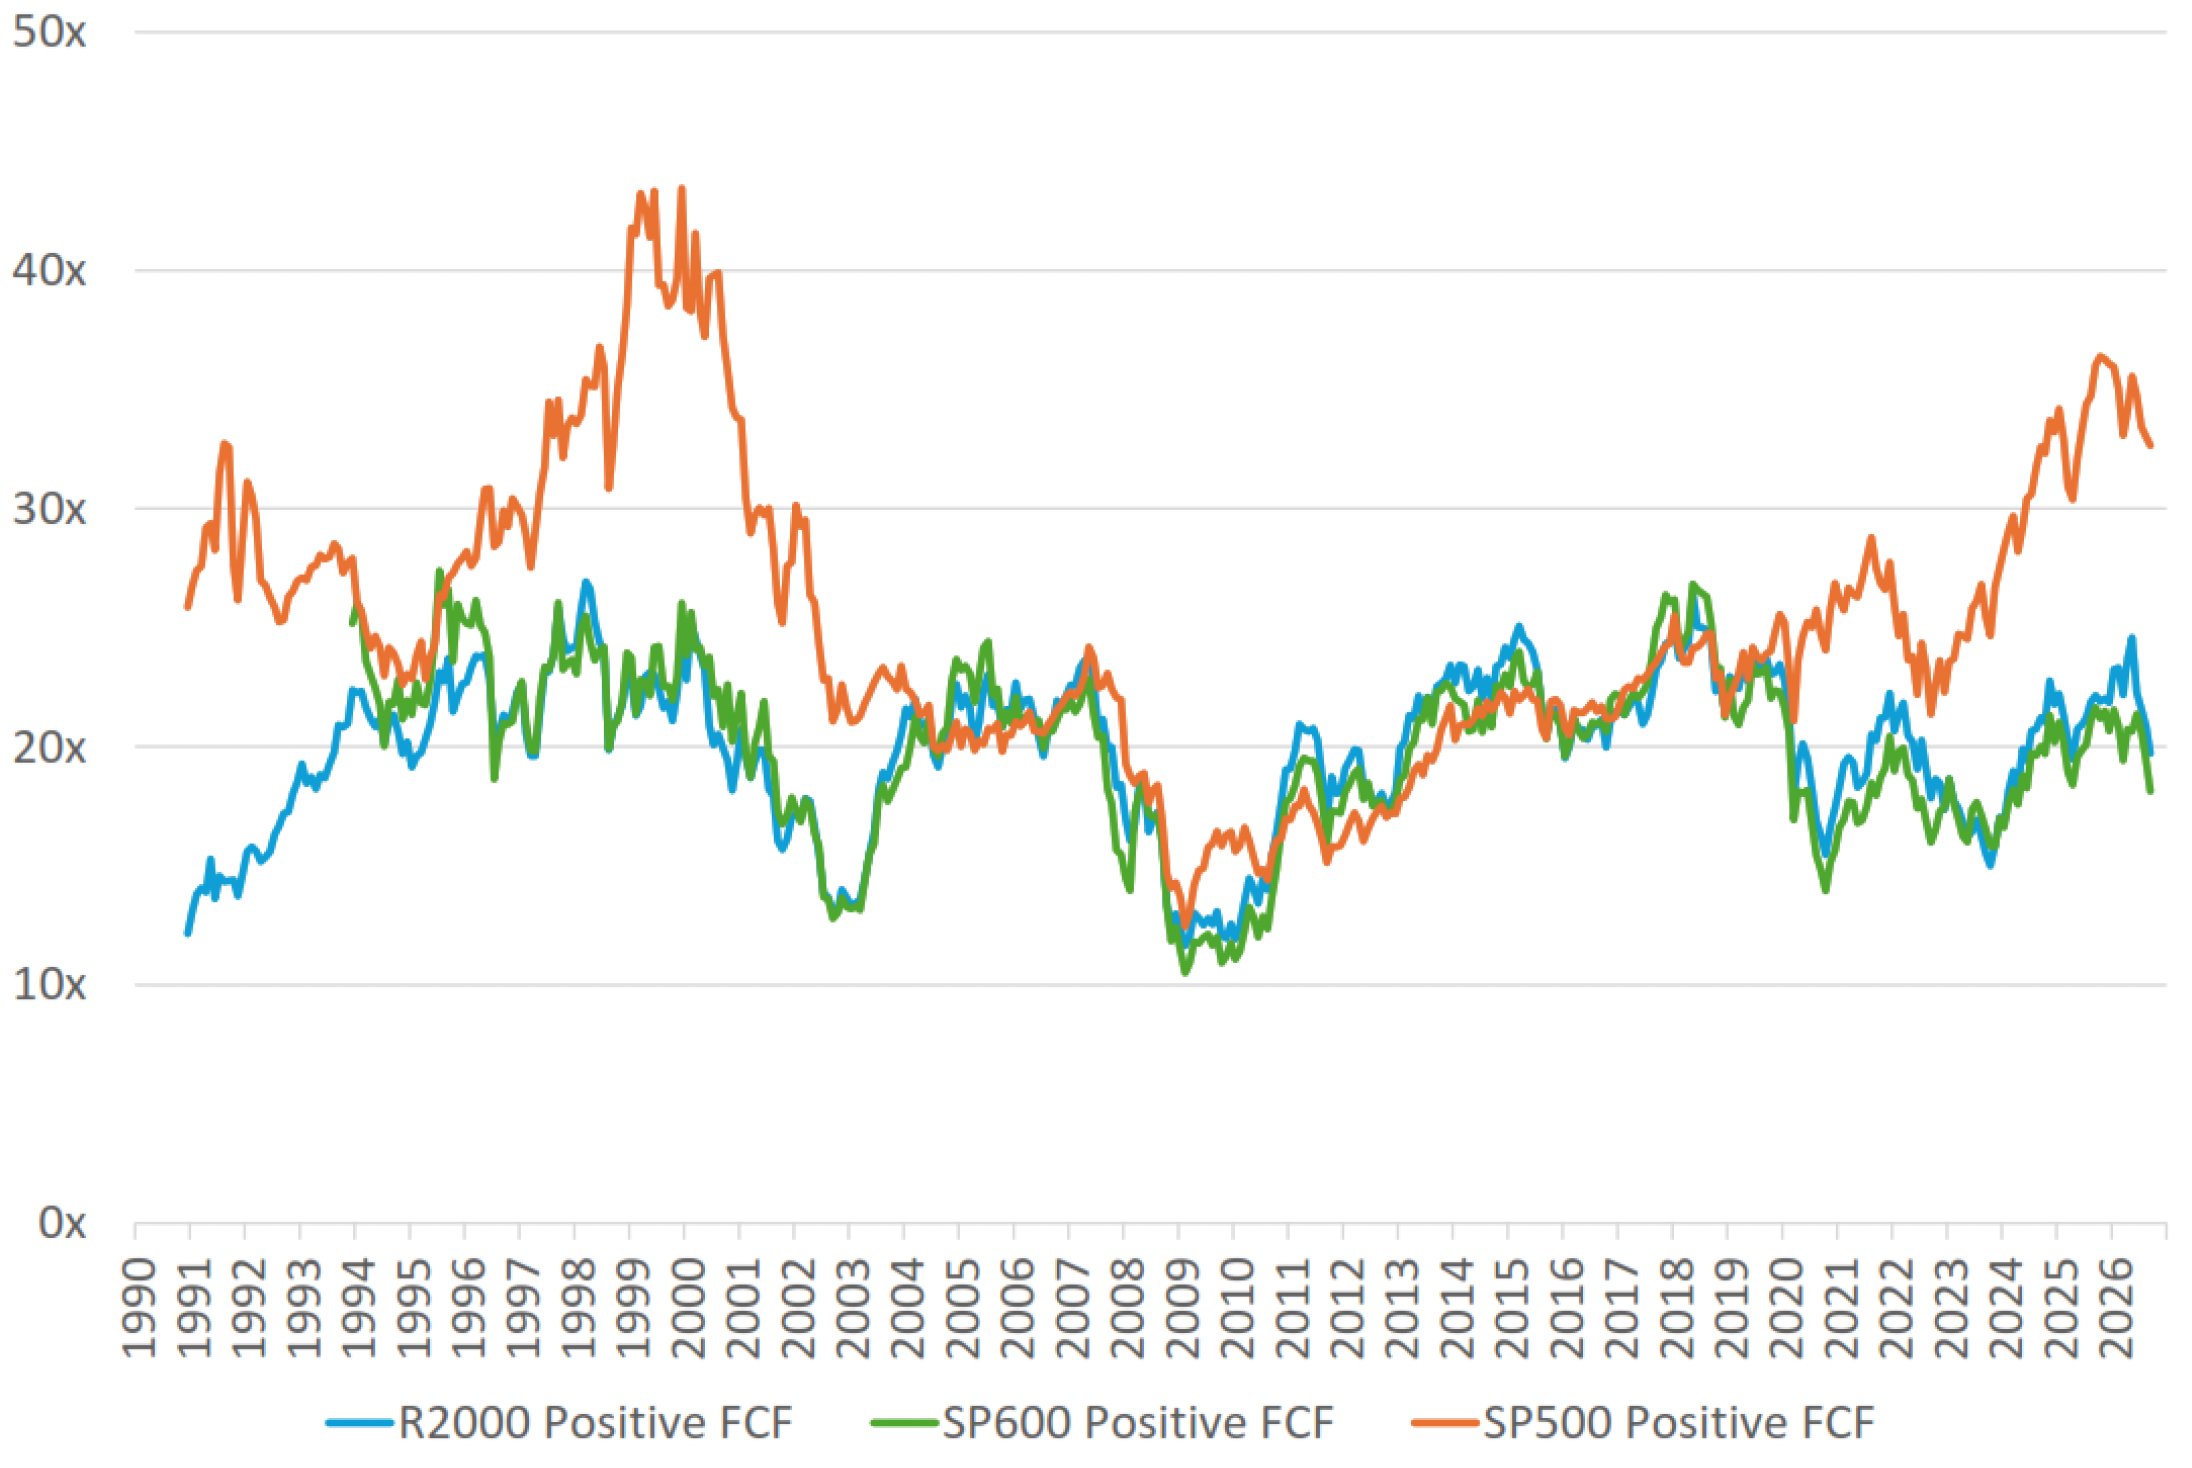
Source: Furey Research Partners, FactSet; Russell 2000 Index, S&P 600 Index, and S&P 500 Index as of 9/30/2026.
The Past Year has been Earnings Driven
As of September 30, 2026
Sources of Return in the Last 12 Months
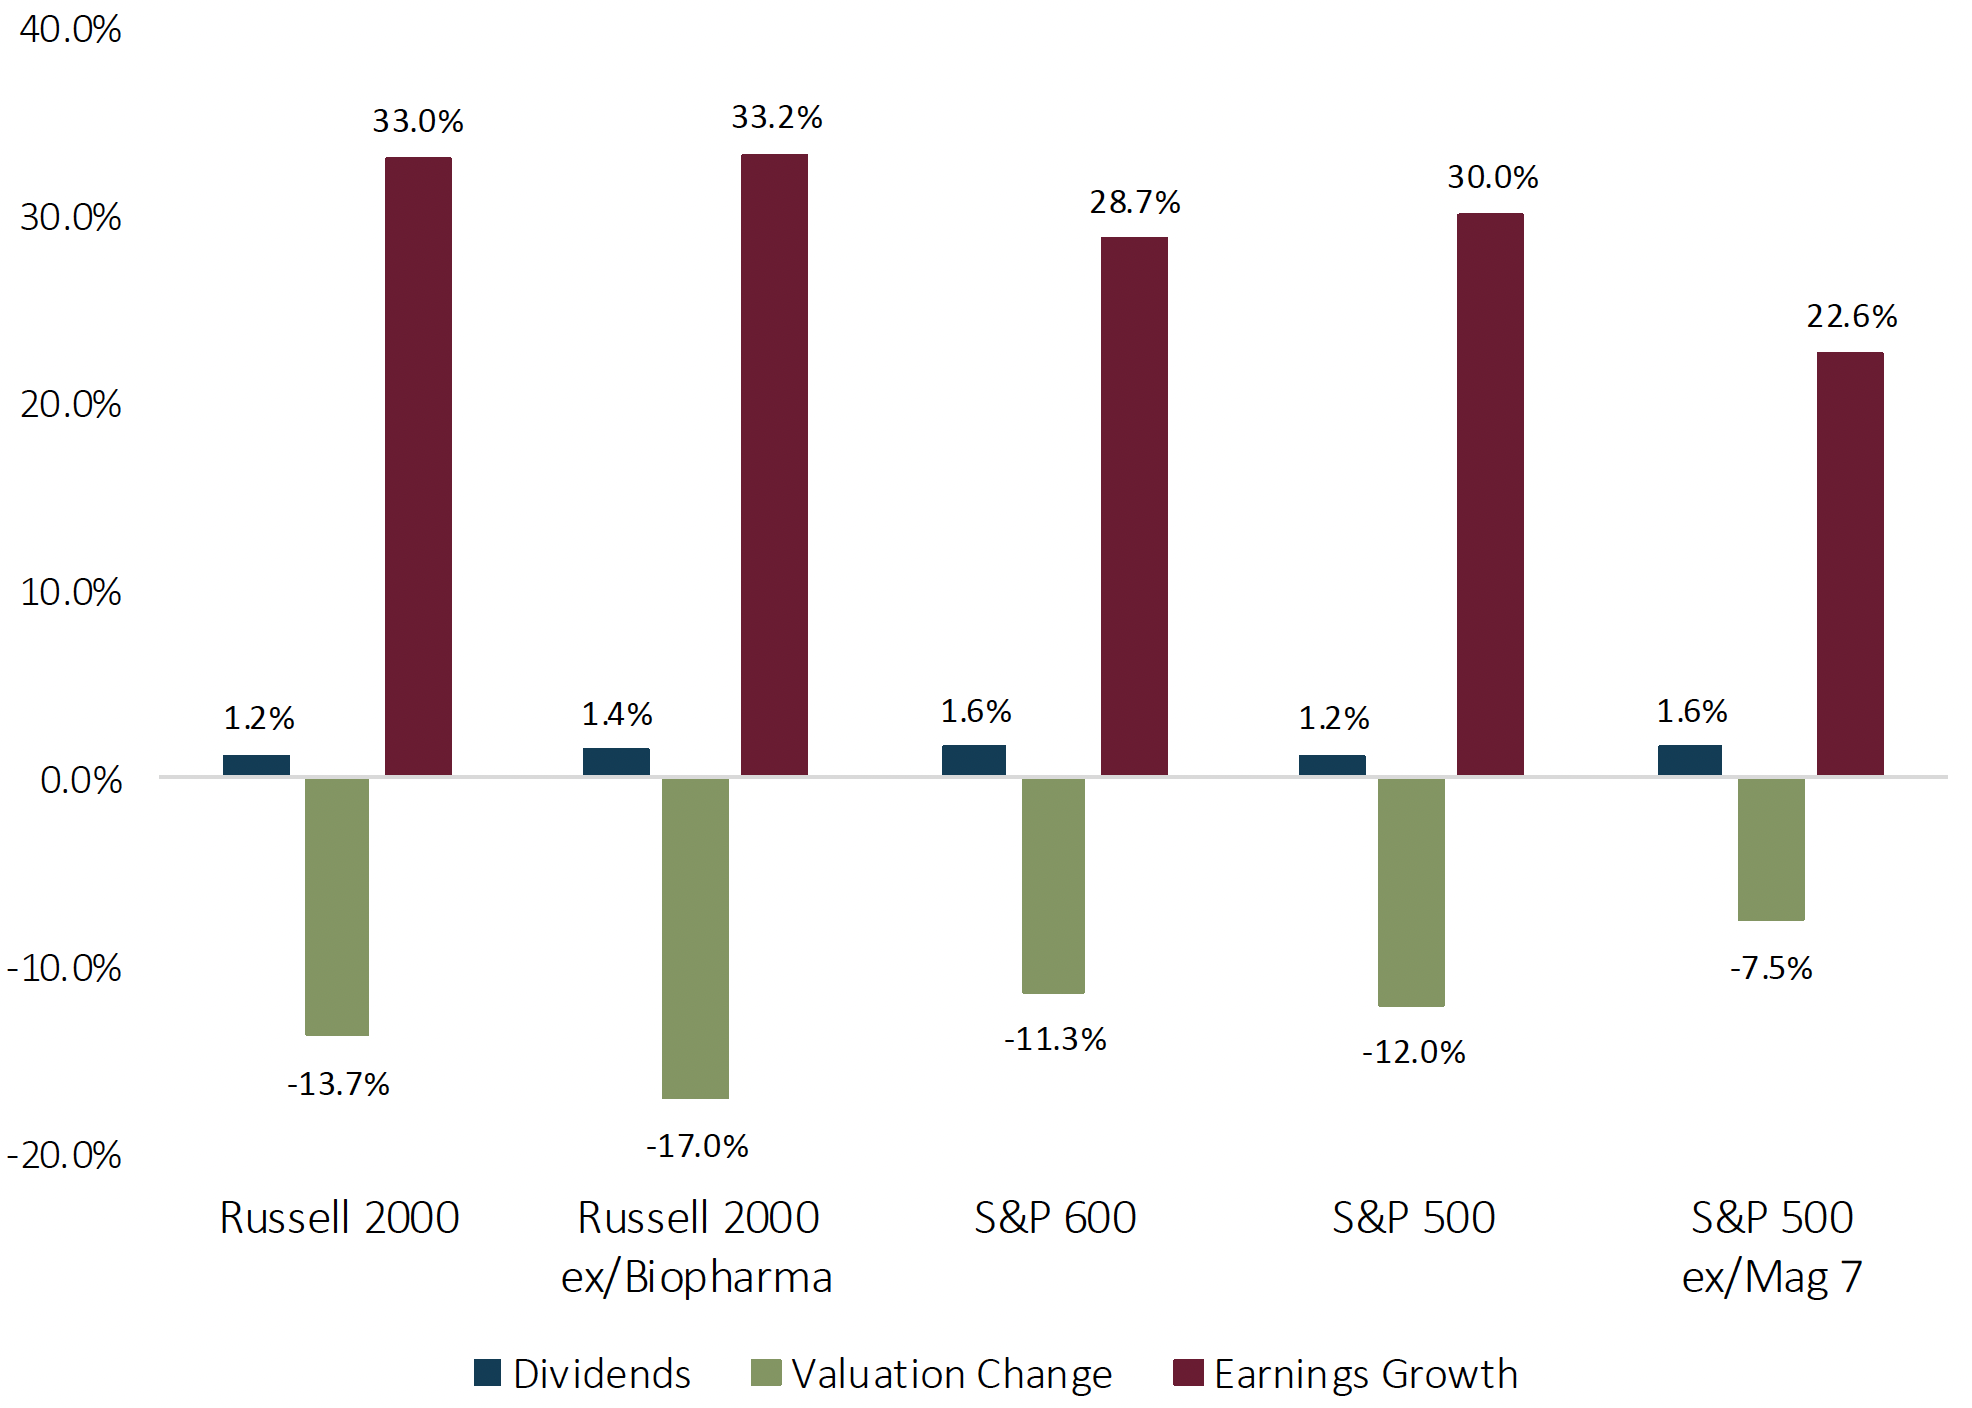
Source: Furey Research Partners; FactSet as of 9/30/2026.
For more small caps observations click here.
The opinions expressed herein are those of Aristotle Capital Boston (Aristotle Boston) and are subject to change without notice. This material is not financial advice or an offer to purchase or sell any product. Aristotle Boston reserves the right to modify its current investment strategies and techniques based on changing market dynamics or client needs.
All investments carry a certain degree of risk, including the possible loss of principal. Investments are also subject to political, market, currency and regulatory risks or economic developments. International investments involve special risks that may in particular cause a loss in principal, including currency fluctuation, lower liquidity, different accounting methods and economic and political systems, and higher transaction costs. These risks typically are greater in emerging markets. Securities of small- and medium-sized companies tend to have a shorter history of operations, be more volatile and less liquid. Value stocks can perform differently from the market as a whole and other types of stocks. The material is provided for informational and/or educational purposes only and is not intended to be and should not be construed as investment, legal or tax advice and/or a legal opinion. Investors should consult their financial and tax adviser before making investments. The opinions referenced are as of the date of publication, may be modified due to changes in the market or economic conditions, and may not necessarily come to pass. Information and data presented has been developed internally and/or obtained from sources believed to be reliable. Aristotle Boston does not guarantee the accuracy, adequacy or completeness of such information.
Past performance is not indicative of future results. The information provided in this report should not be considered financial advice or a recommendation to purchase or sell any particular security.
Differing historical time periods are selected throughout the presentation as we believe specific periods provide the most informative historical analog for the concepts presented.
The Russell 2000® Index measures the performance of the small cap segment of the U.S. equity universe. The Russell 2000 Index is a subset of the Russell 3000® Index representing approximately 10% of the total market capitalization of that index. It includes approximately 2000 of the smallest securities based on a combination of their market cap and current index membership. The volatility (beta) of the portfolios may be greater or less than the benchmark. It is not possible to invest directly in this index.
Aristotle Capital Boston, LLC is an independent investment adviser registered under the Investment Advisers Act of 1940, as amended. Registration does not imply a certain level of skill or training. More information about Aristotle Boston, including our investment strategies, fees and objectives, can be found in Form ADV Part 2, which is available upon request. ACB-2610-26